| Param | Original file | Final file |
|---|---|---|
| Filename | modeM0/AS1G06_077T02_9000001076_07856cztM0_level2.evt | modeM0/AS1G06_077T02_9000001076_07856cztM0_level2_quad_clean.evt |
| Size (bytes) | 469,379,520 | 87,819,840 |
| Size | 447.6 MB | 83.8 MB |
| Events in quadrant A | 3,042,094 | 556,632 |
| Events in quadrant B | 4,145,420 | 556,773 |
| Events in quadrant C | 3,321,904 | 562,076 |
| Events in quadrant D | 3,268,331 | 534,718 |
| Mode M9 | |||
|---|---|---|---|
| Quadrant | BADHDUFLAG | Total packets | Discarded packets |
| A | 0 | 11 | 0 |
| B | 0 | 11 | 0 |
| C | 0 | 11 | 0 |
| D | 0 | 12 | 0 |
| Mode M0 | |||
|---|---|---|---|
| Quadrant | BADHDUFLAG | Total packets | Discarded packets |
| A | 0 | 13312 | 3 |
| B | 0 | 16563 | 2 |
| C | 0 | 14314 | 2 |
| D | 0 | 13997 | 2 |
| Mode SS | |||
|---|---|---|---|
| Quadrant | BADHDUFLAG | Total packets | Discarded packets |
| A | 0 | 132 | 0 |
| B | 0 | 132 | 0 |
| C | 0 | 132 | 0 |
| D | 0 | 132 | 0 |
| Quadrant | Total seconds | Saturated seconds | Saturation percentage |
|---|---|---|---|
| A | 6434 | 49 | 0.761579% |
| B | 6434 | 351 | 5.455393% |
| C | 6434 | 49 | 0.761579% |
| D | 6434 | 50 | 0.777122% |
Noise dominated data is calculated using 1-second bins in cleaned event files. If a bin has >2000 counts, and if more than 50% of those come from <1% of pixels, then it is considered to be noise-dominated and hence unusable.
| Quadrant | # 1 sec bins | Bins with >0 counts | Bins with >2000 counts | High rate bins dominated by noise | Noise dominated (total time) | Noise dominated (detector-on time) | Marked lightcurve |
|---|---|---|---|---|---|---|---|
| A | 7519 | 6435 | 1 | 1 | 0.01% | 0.02% | 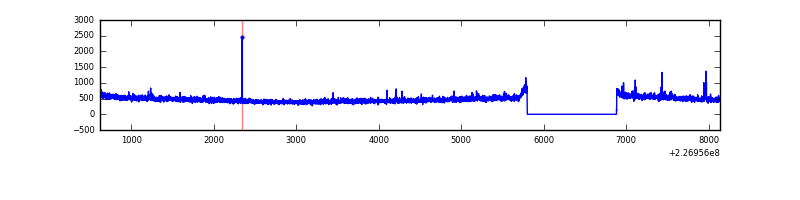 |
| B | 7519 | 6435 | 187 | 187 | 2.49% | 2.91% | 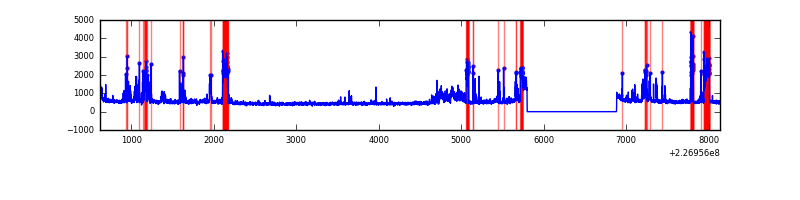 |
| C | 7519 | 6435 | 4 | 4 | 0.05% | 0.06% | 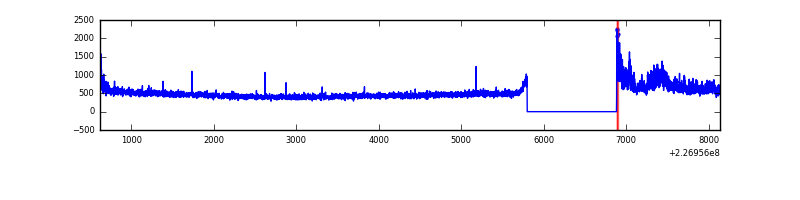 |
| D | 7519 | 6435 | 14 | 14 | 0.19% | 0.22% | 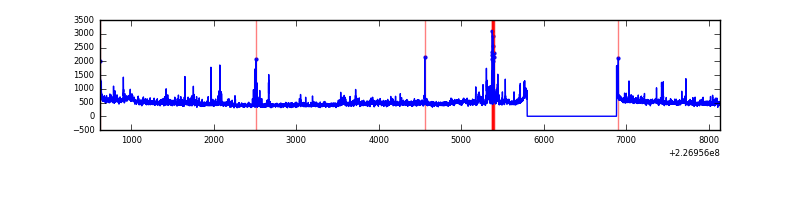 |
Top three noisy pixels from each quadrant. If the there are fewer than three noisy pixels in the level2.evt file, extra rows are filled as -1
| Pixel properties | Quadrant properties | ||||||
|---|---|---|---|---|---|---|---|
| Quadrant | DetID | PixID | Counts | Sigma | Mean | Median | Sigma |
| A | 13 | 248 | 17038 | 102.41 | 781 | 766 | 158.9 |
| A | 15 | 174 | 10321 | 60.13 | 781 | 766 | 158.9 |
| A | 15 | 234 | 8031 | 45.72 | 781 | 766 | 158.9 |
| B | 4 | 239 | 618602 | 4199.47 | 776 | 759 | 147.1 |
| B | 4 | 173 | 280793 | 1903.39 | 776 | 759 | 147.1 |
| B | 5 | 255 | 97561 | 657.96 | 776 | 759 | 147.1 |
| C | 1 | 16 | 322183 | 1814.69 | 763 | 768 | 177.1 |
| C | 10 | 22 | 11366 | 59.84 | 763 | 768 | 177.1 |
| C | 8 | 229 | 7174 | 36.17 | 763 | 768 | 177.1 |
| D | 1 | 52 | 143668 | 780.33 | 754 | 733 | 183.2 |
| D | 13 | 104 | 80758 | 436.89 | 754 | 733 | 183.2 |
| D | 5 | 233 | 59281 | 319.63 | 754 | 733 | 183.2 |
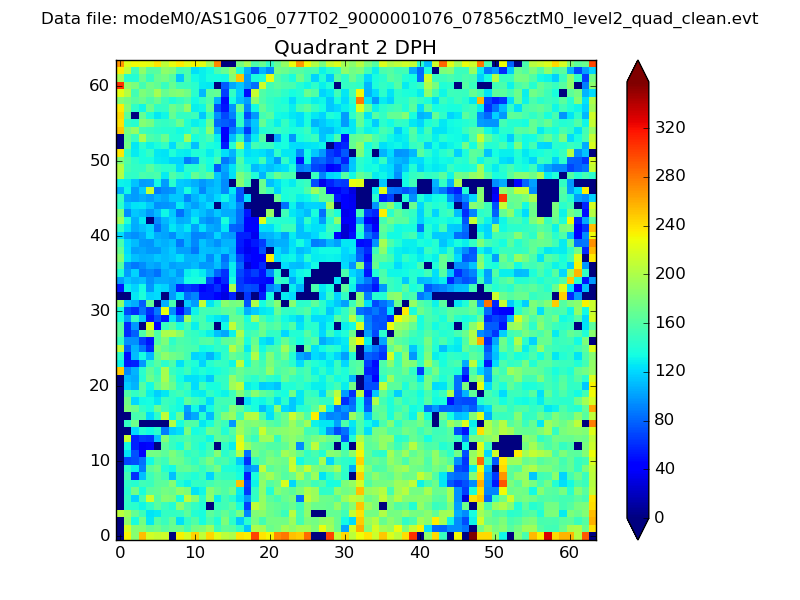
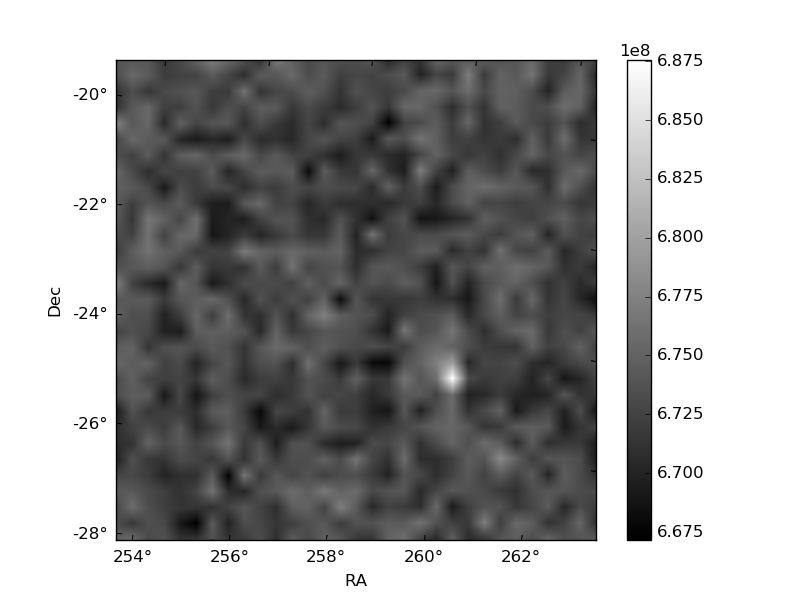
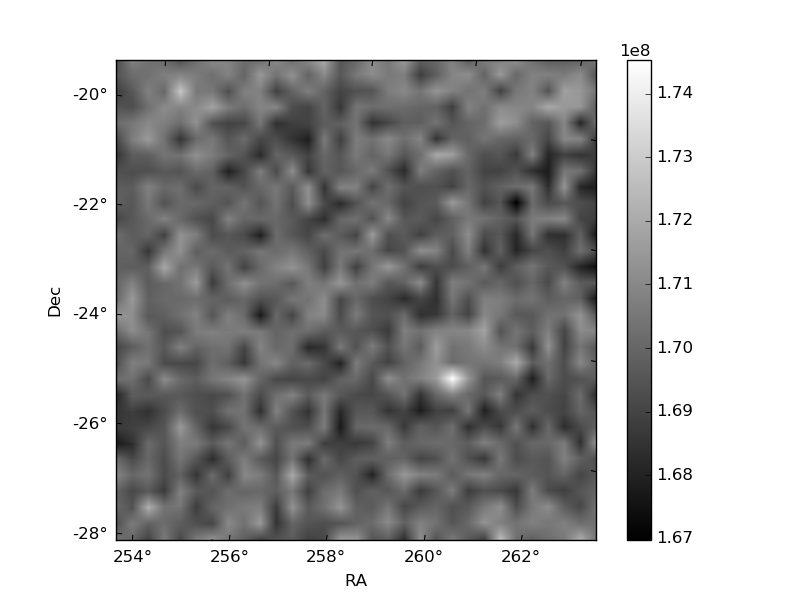
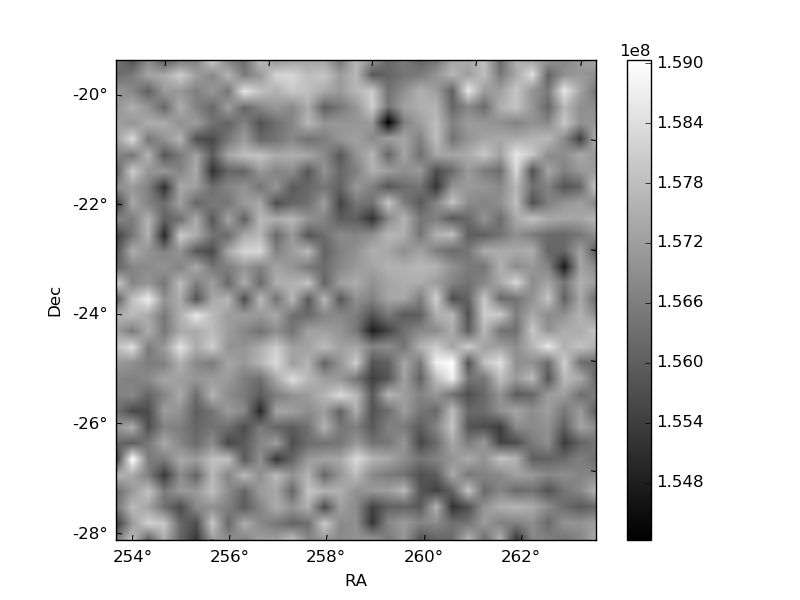
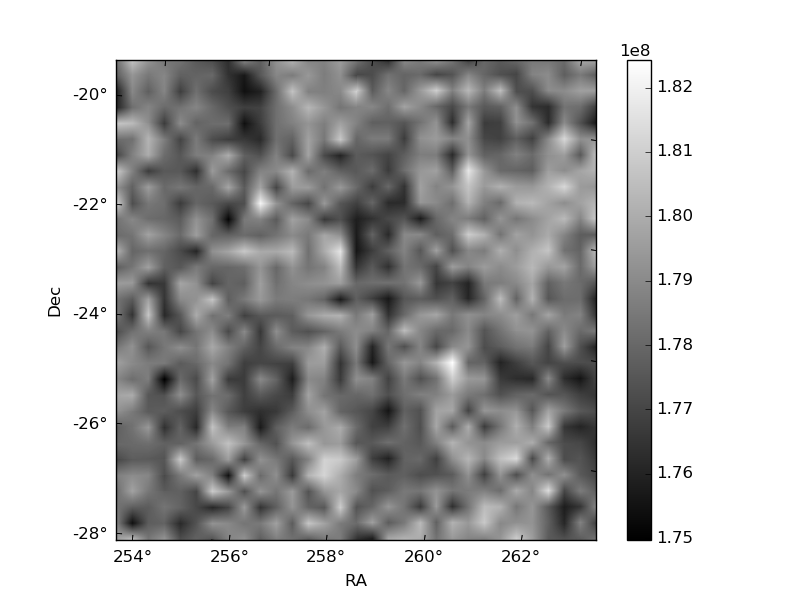
Histogram calculated using DETX and DETY for each event in the final _common_clean file
| Quadrant A | 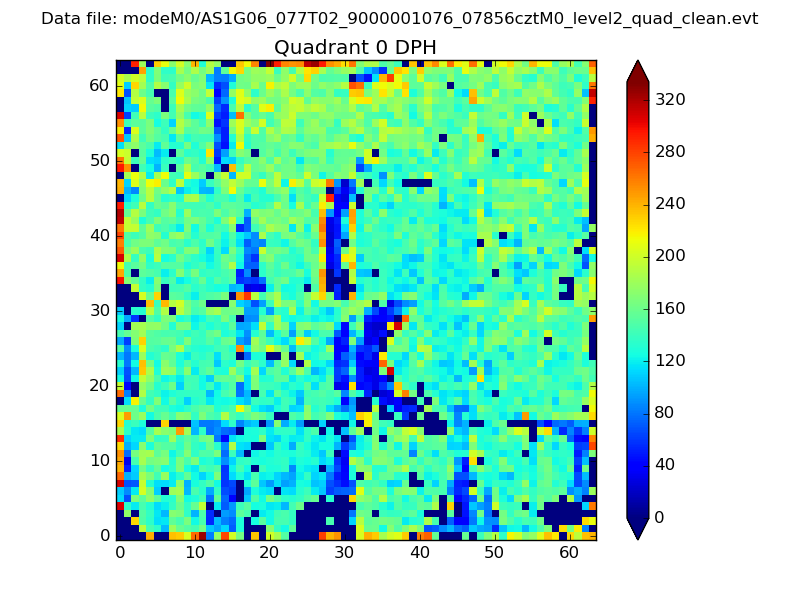 |
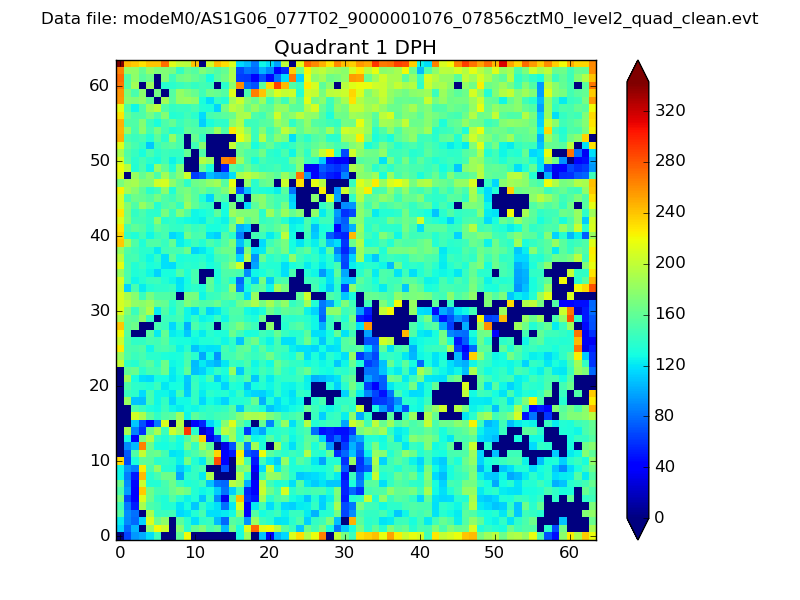 |
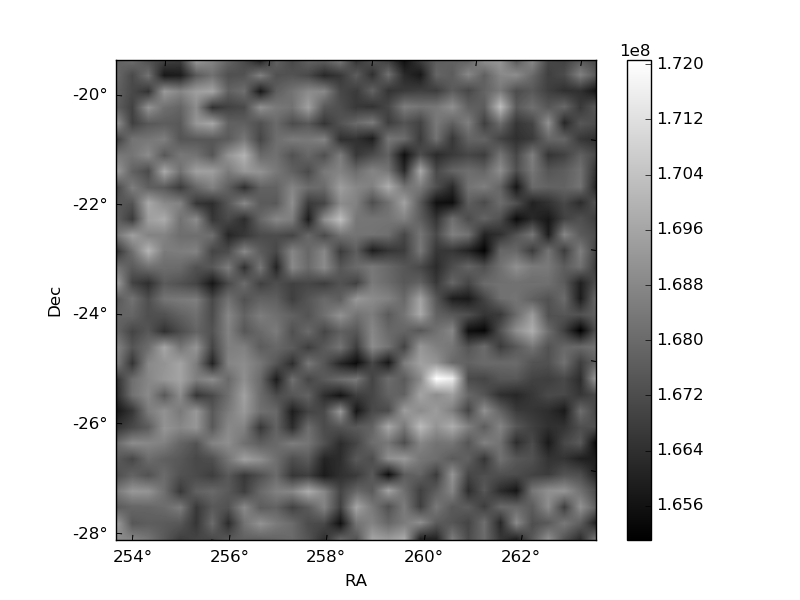
Quadrant B |
|---|---|---|---|
| Quadrant D | 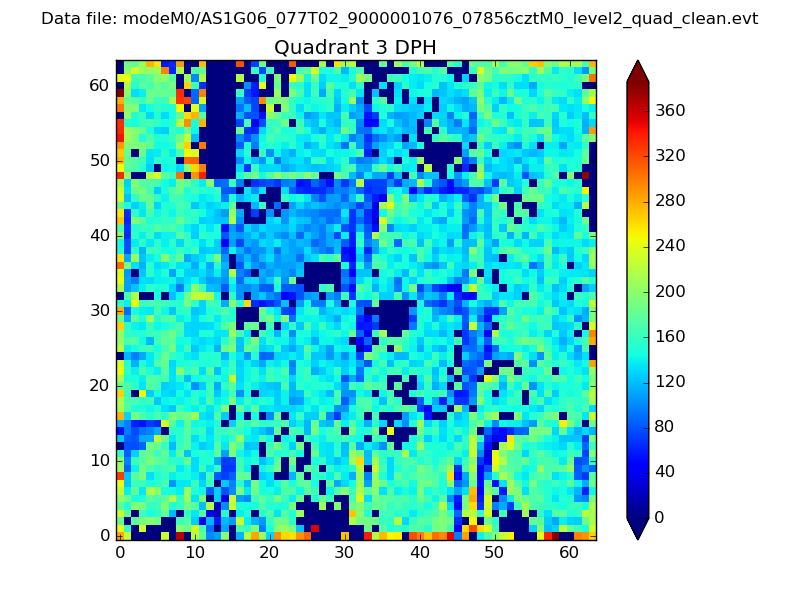 |
 |
Quadrant C |
| Plot type | Count rate plots | Images |
|---|---|---|
| Comparison with Poisson distribution Blue bars denote a histogram of data divided into 1 sec bins. Red curve is a Poisson curve with rate = median count rate of data. |
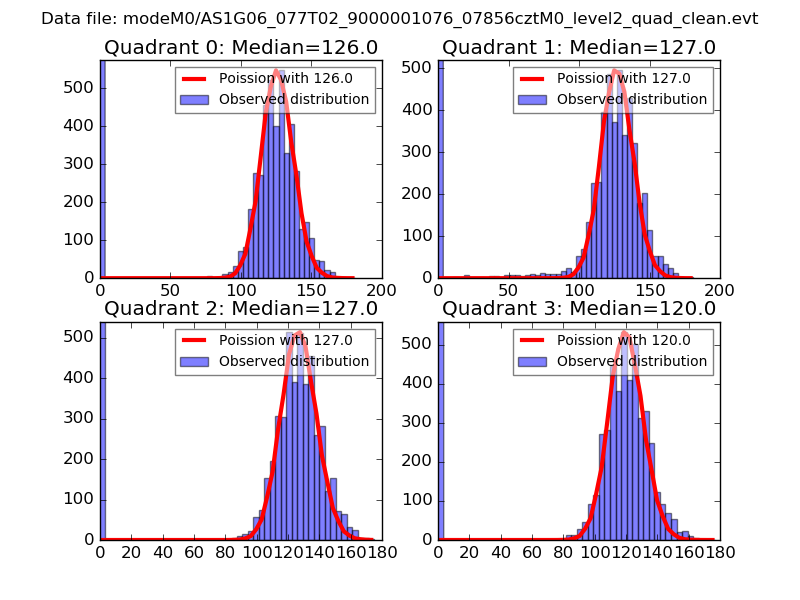 |
 |
| Quadrant-wise count rates Data is divided into 100 sec bins |
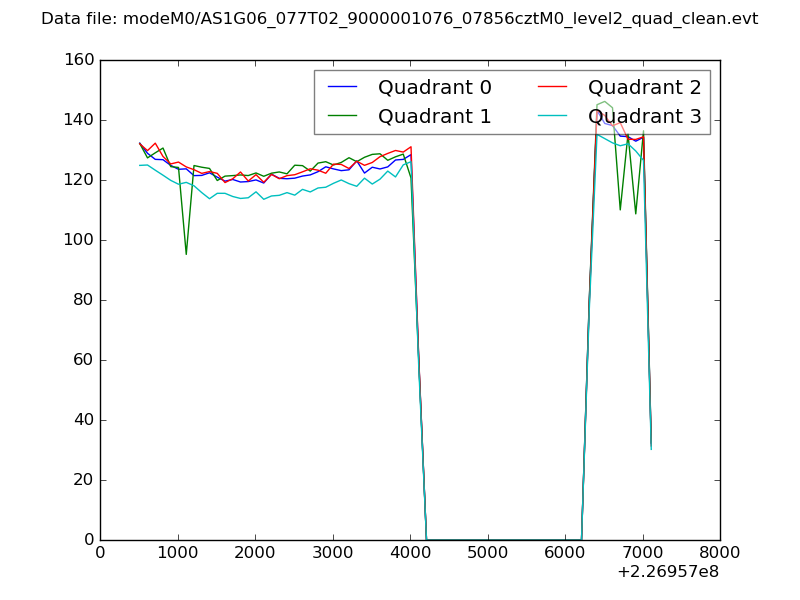 |
|
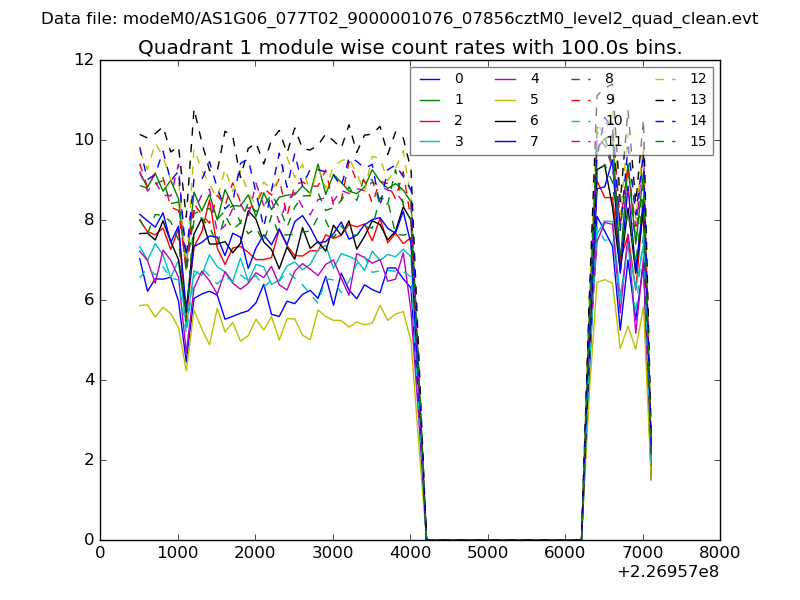
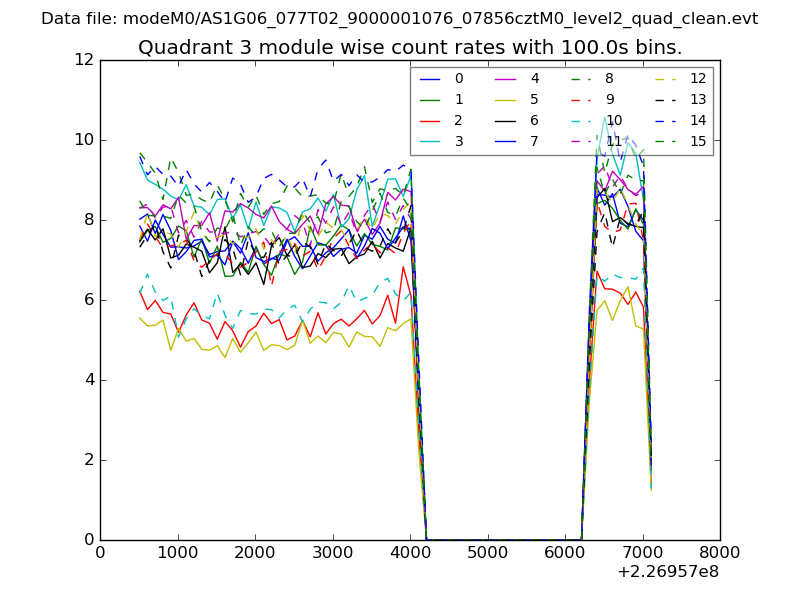
| Module-wise count rates for Quadrant A Data is divided into 100 sec bins |
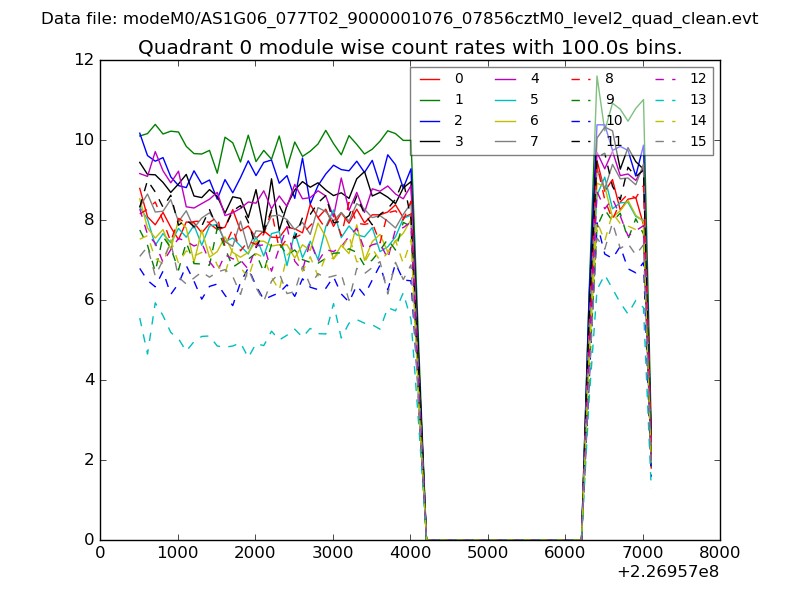 |
 |
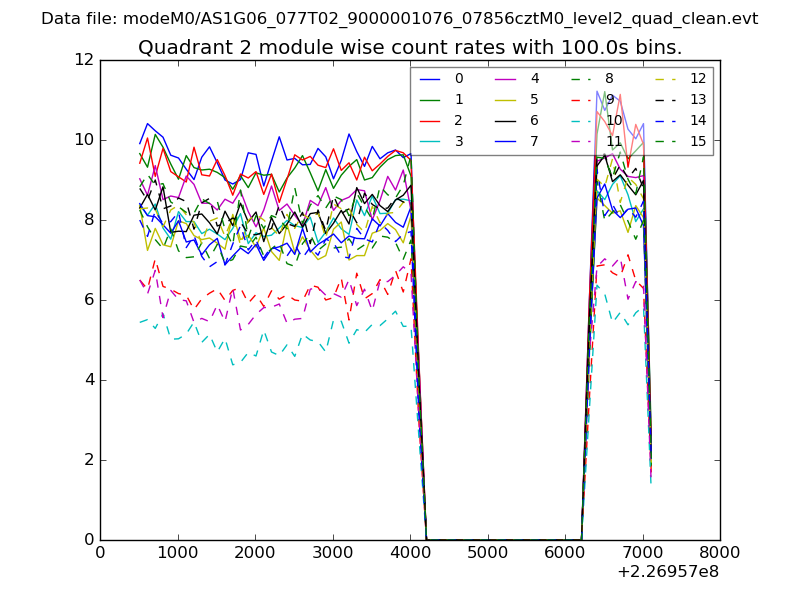
| Module-wise count rates for Quadrant B Data is divided into 100 sec bins |
 |
 |
| Module-wise count rates for Quadrant C Data is divided into 100 sec bins |
 |
 |
| Module-wise count rates for Quadrant D Data is divided into 100 sec bins |
 |
 |
| Parameter | Plot |
|---|---|
| CZT HV Monitor | 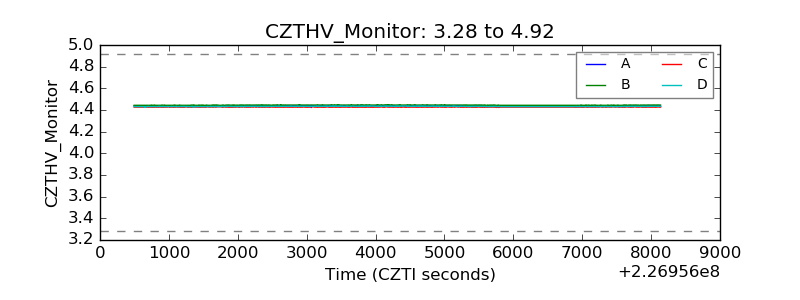 |
| D_VDD | 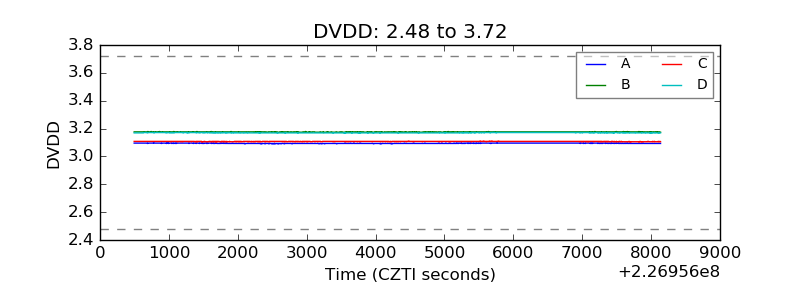 |
| Temperature 1 | 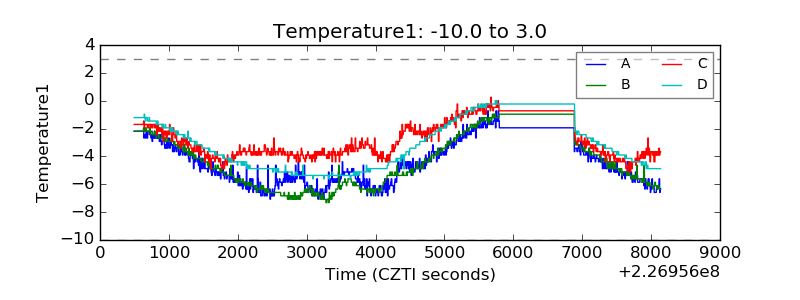 |
| Veto HV Monitor | 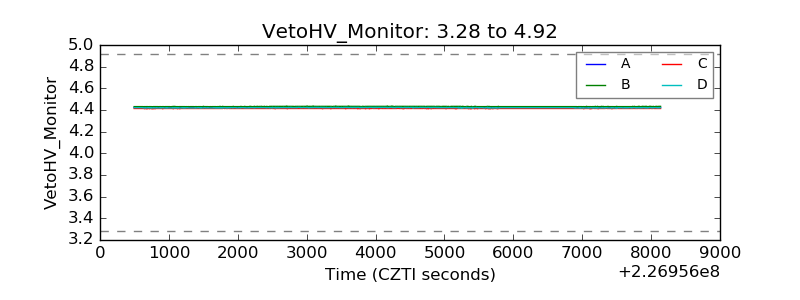 |
| Veto LLD | 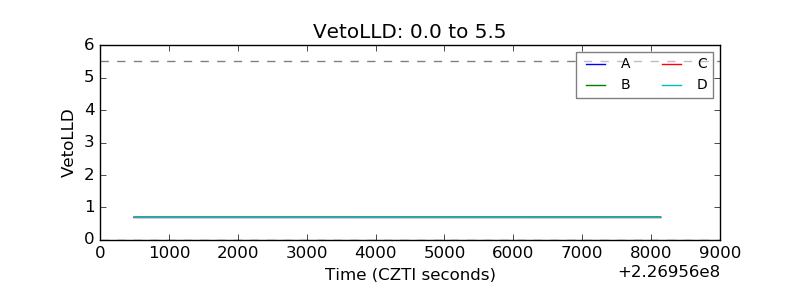 |
| Alpha Counter | 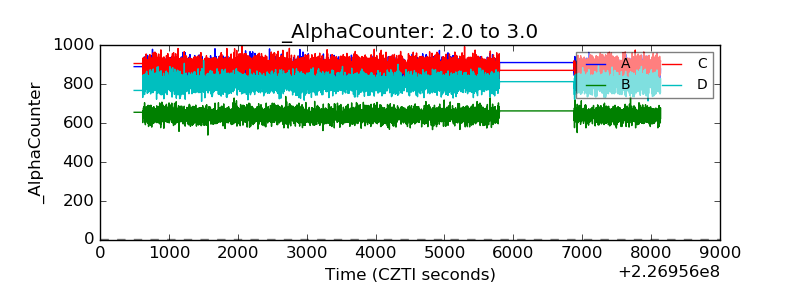 |
| _CPM_Rate | 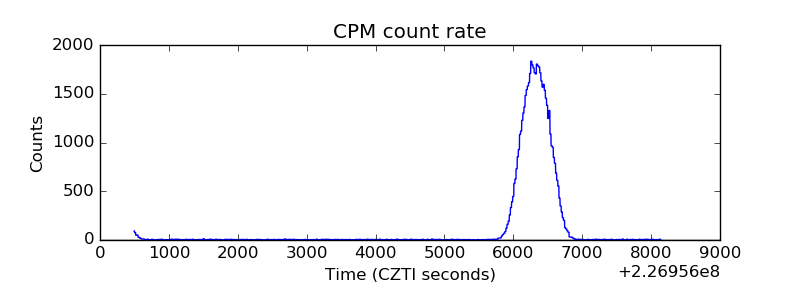 |
| CZT Counter | 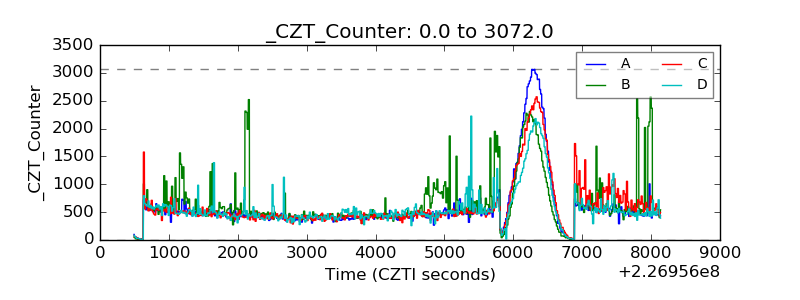 |
| +2.5 Volts monitor | 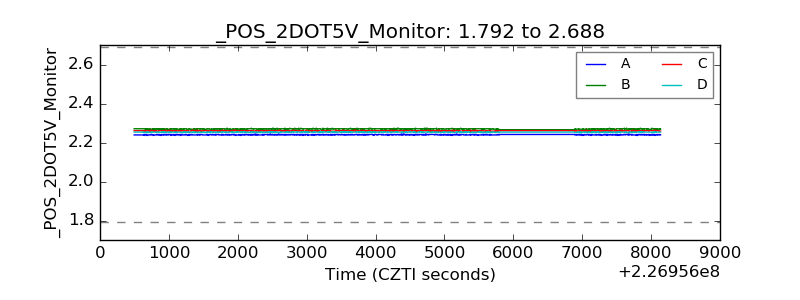 |
| +5 Volts monitor |  |
| _ROLL_ROT | 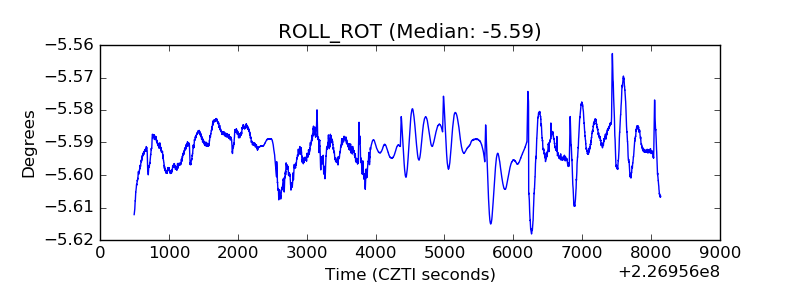 |
| _Roll_DEC | 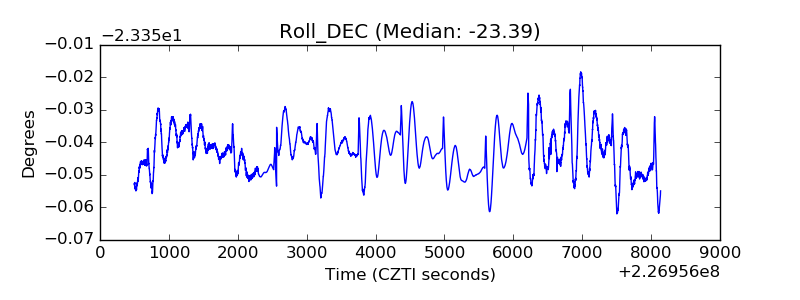 |
| _Roll_RA | 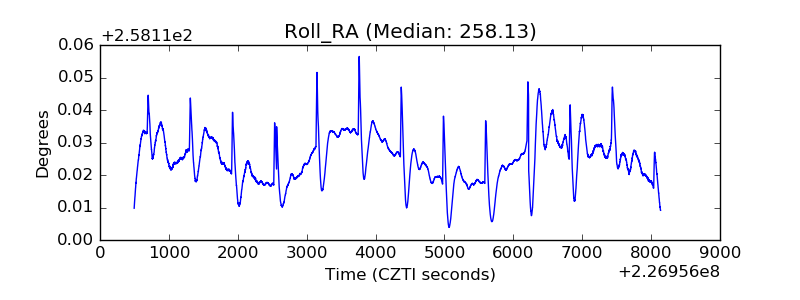 |
| Veto Counter | 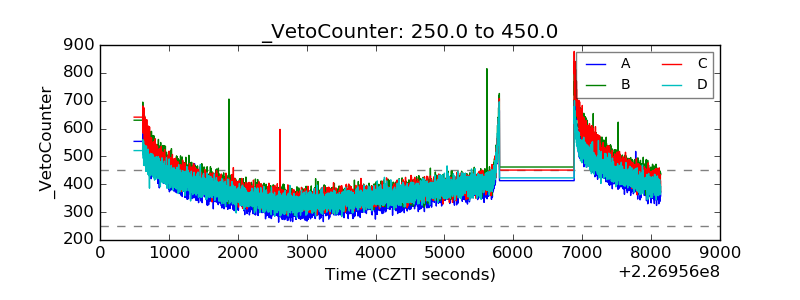 |