| Param | Original file | Final file |
|---|---|---|
| Filename | modeM0/AS1G06_077T02_9000001076_07858cztM0_level2.evt | modeM0/AS1G06_077T02_9000001076_07858cztM0_level2_quad_clean.evt |
| Size (bytes) | 444,588,480 | 106,300,800 |
| Size | 424.0 MB | 101.4 MB |
| Events in quadrant A | 3,022,785 | 690,641 |
| Events in quadrant B | 3,583,895 | 713,730 |
| Events in quadrant C | 3,266,963 | 709,968 |
| Events in quadrant D | 3,162,336 | 665,203 |
| Mode M9 | |||
|---|---|---|---|
| Quadrant | BADHDUFLAG | Total packets | Discarded packets |
| A | 0 | 20 | 0 |
| B | 0 | 20 | 0 |
| C | 0 | 20 | 0 |
| D | 0 | 21 | 0 |
| Mode M0 | |||
|---|---|---|---|
| Quadrant | BADHDUFLAG | Total packets | Discarded packets |
| A | 0 | 13041 | 3 |
| B | 0 | 14743 | 2 |
| C | 0 | 13757 | 2 |
| D | 0 | 13670 | 2 |
| Mode SS | |||
|---|---|---|---|
| Quadrant | BADHDUFLAG | Total packets | Discarded packets |
| A | 0 | 130 | 0 |
| B | 0 | 130 | 0 |
| C | 0 | 130 | 0 |
| D | 0 | 130 | 0 |
| Quadrant | Total seconds | Saturated seconds | Saturation percentage |
|---|---|---|---|
| A | 6296 | 24 | 0.381194% |
| B | 6296 | 144 | 2.287166% |
| C | 6296 | 19 | 0.301779% |
| D | 6296 | 39 | 0.619441% |
Noise dominated data is calculated using 1-second bins in cleaned event files. If a bin has >2000 counts, and if more than 50% of those come from <1% of pixels, then it is considered to be noise-dominated and hence unusable.
| Quadrant | # 1 sec bins | Bins with >0 counts | Bins with >2000 counts | High rate bins dominated by noise | Noise dominated (total time) | Noise dominated (detector-on time) | Marked lightcurve |
|---|---|---|---|---|---|---|---|
| A | 7561 | 6297 | 2 | 2 | 0.03% | 0.03% | 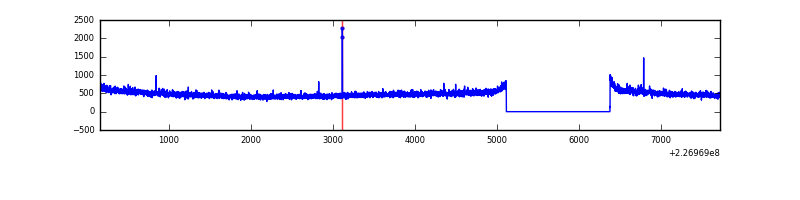 |
| B | 7561 | 6297 | 76 | 76 | 1.01% | 1.21% | 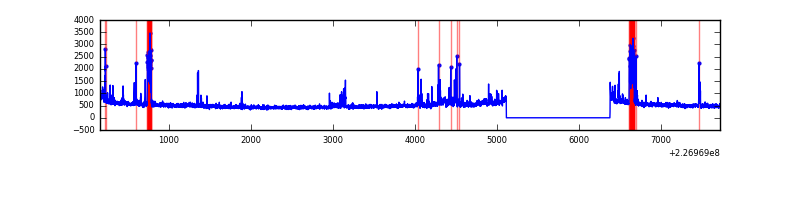 |
| C | 7561 | 6297 | 0 | 0 | 0.00% | 0.00% | 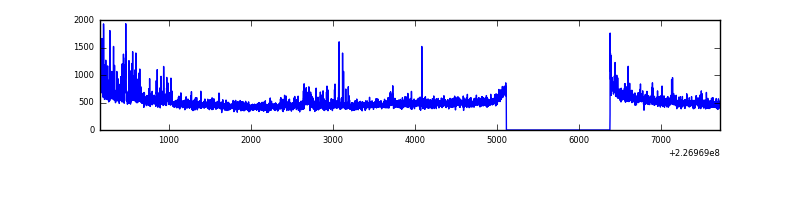 |
| D | 7561 | 6297 | 18 | 18 | 0.24% | 0.29% | 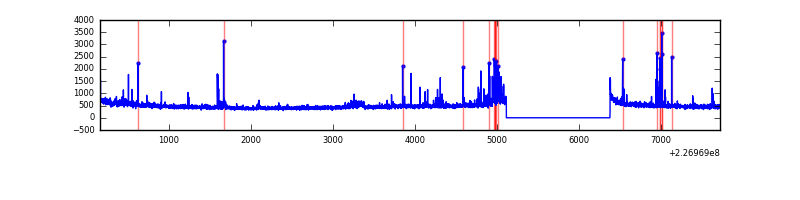 |
Top three noisy pixels from each quadrant. If the there are fewer than three noisy pixels in the level2.evt file, extra rows are filled as -1
| Pixel properties | Quadrant properties | ||||||
|---|---|---|---|---|---|---|---|
| Quadrant | DetID | PixID | Counts | Sigma | Mean | Median | Sigma |
| A | 0 | 226 | 7293 | 41.55 | 781 | 766 | 157.1 |
| A | 12 | 194 | 6637 | 37.37 | 781 | 766 | 157.1 |
| A | 15 | 239 | 6633 | 37.35 | 781 | 766 | 157.1 |
| B | 4 | 239 | 265119 | 1790.5 | 793 | 777 | 147.6 |
| B | 4 | 173 | 108162 | 727.37 | 793 | 777 | 147.6 |
| B | 0 | 219 | 37972 | 251.94 | 793 | 777 | 147.6 |
| C | 1 | 16 | 183390 | 1017.2 | 779 | 786 | 179.5 |
| C | 8 | 229 | 37057 | 202.05 | 779 | 786 | 179.5 |
| C | 10 | 22 | 6778 | 33.38 | 779 | 786 | 179.5 |
| D | 13 | 104 | 124916 | 675.3 | 762 | 742 | 183.9 |
| D | 1 | 52 | 52625 | 282.16 | 762 | 742 | 183.9 |
| D | 2 | 152 | 44382 | 237.33 | 762 | 742 | 183.9 |
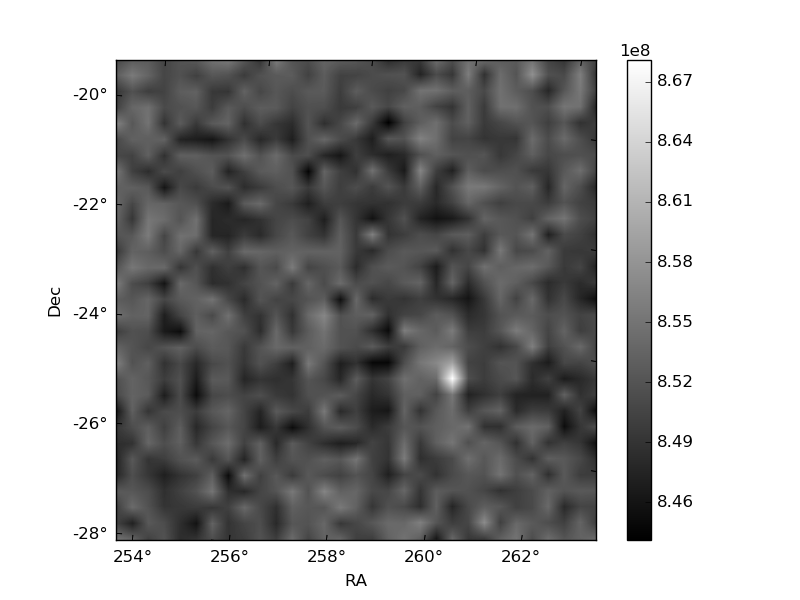
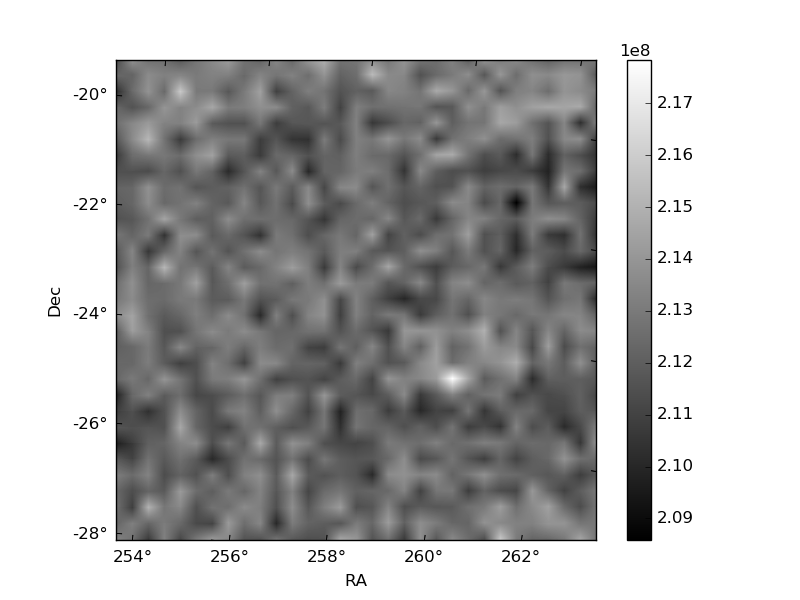
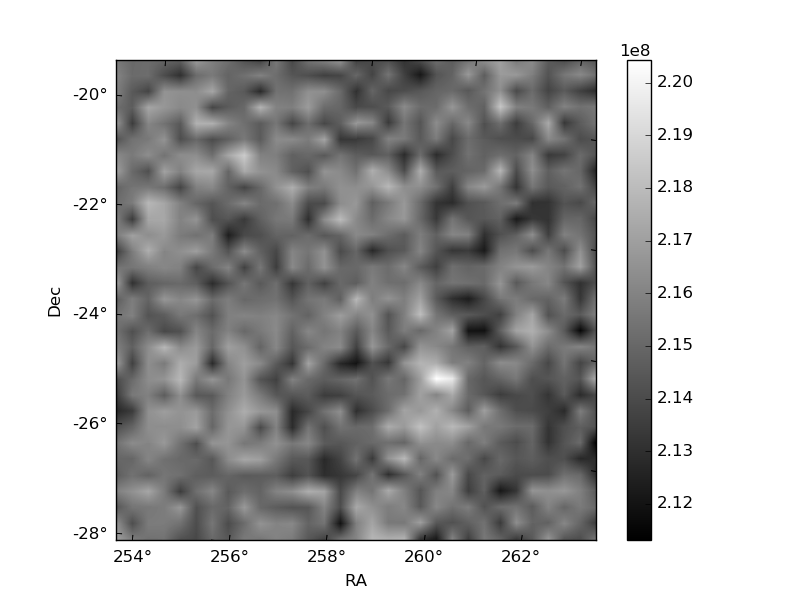
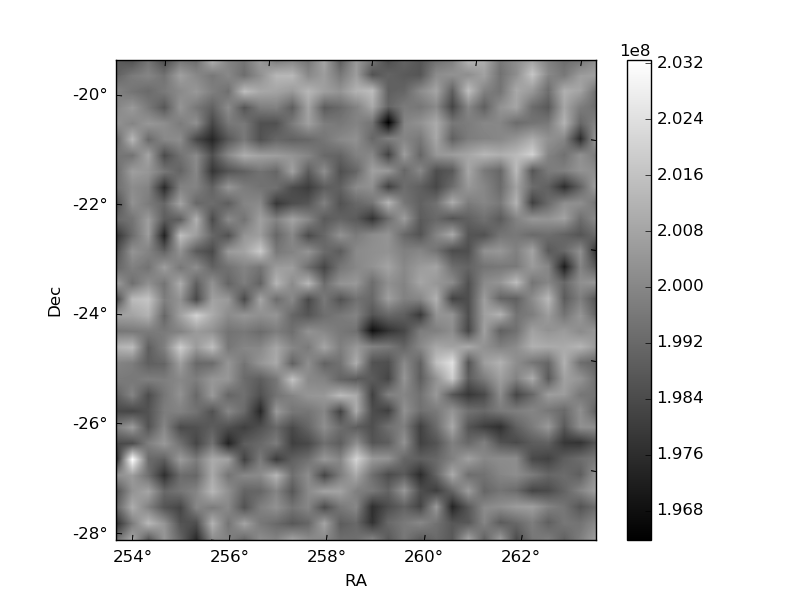
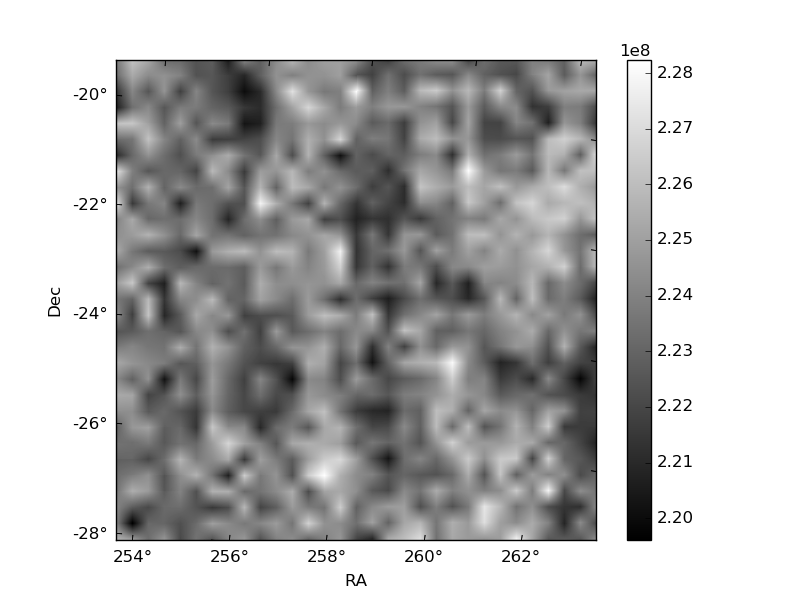
Histogram calculated using DETX and DETY for each event in the final _common_clean file
| Quadrant A | 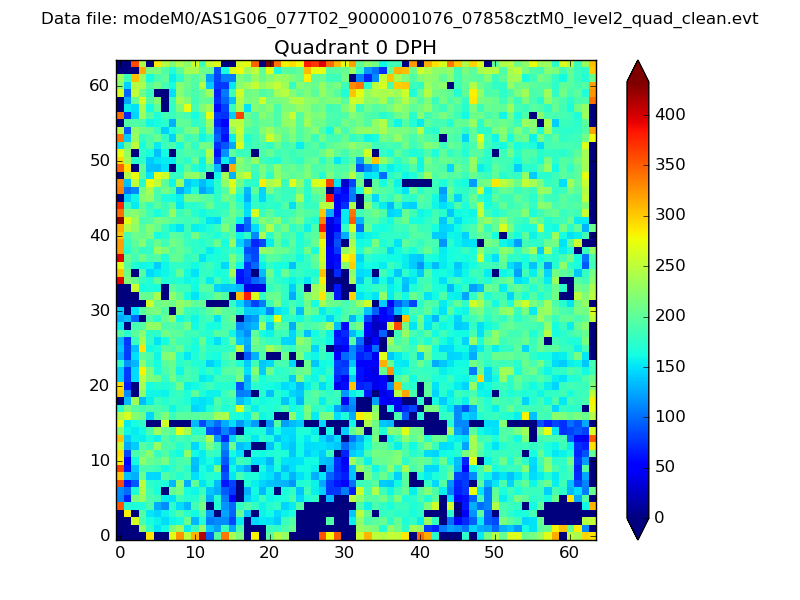 |
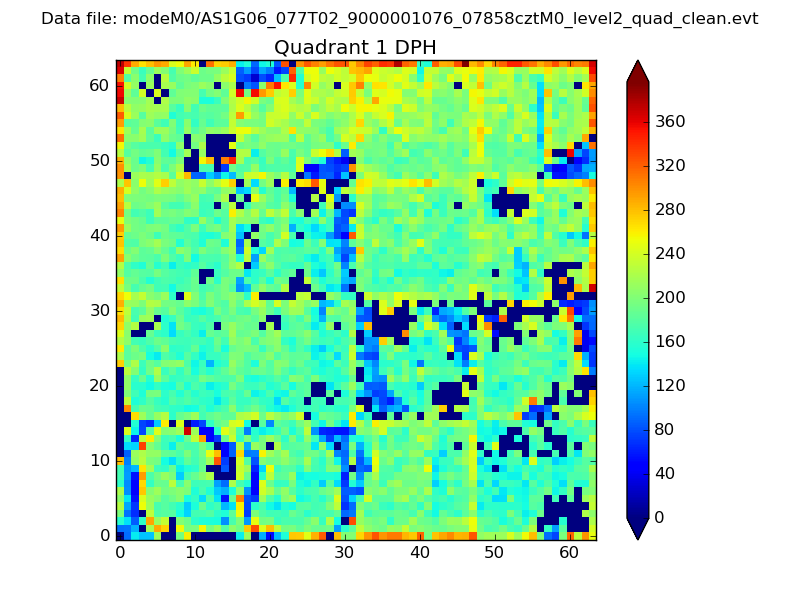 |
Quadrant B |
|---|---|---|---|
| Quadrant D | 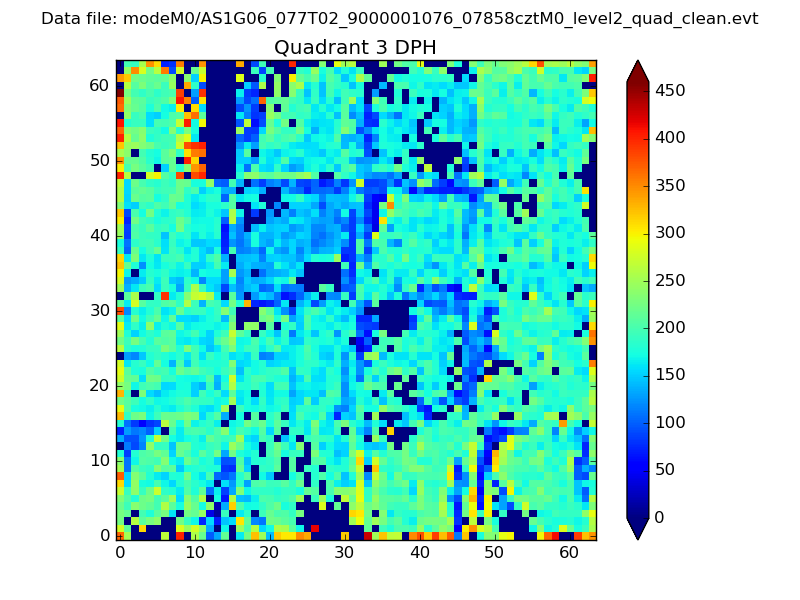 |
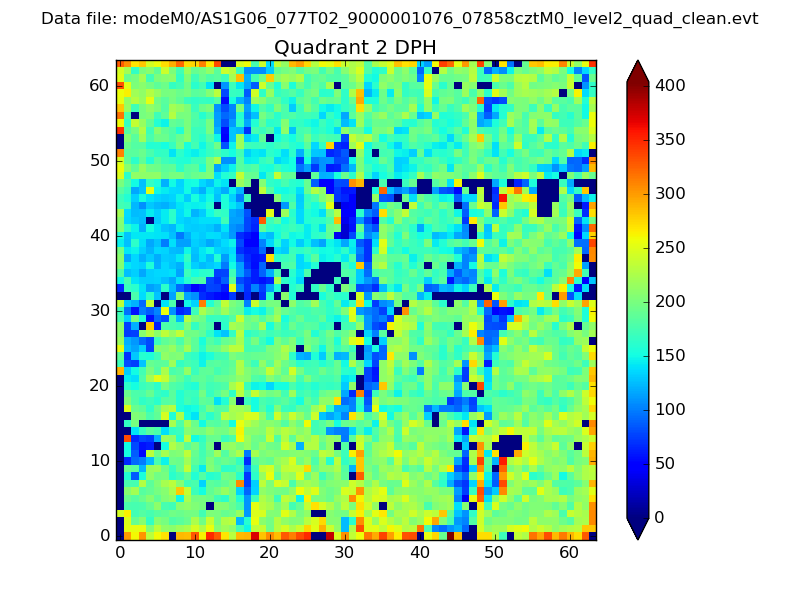 |
Quadrant C |
| Plot type | Count rate plots | Images |
|---|---|---|
| Comparison with Poisson distribution Blue bars denote a histogram of data divided into 1 sec bins. Red curve is a Poisson curve with rate = median count rate of data. |
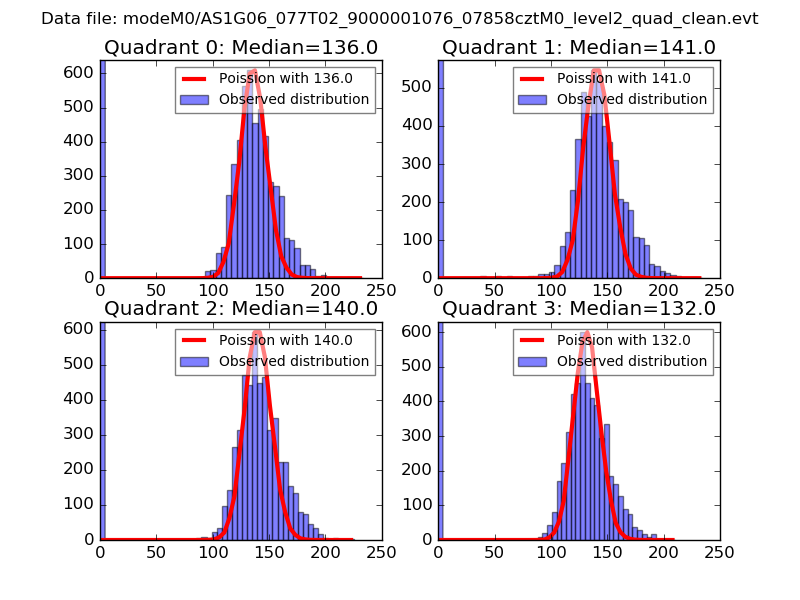 |
 |
| Quadrant-wise count rates Data is divided into 100 sec bins |
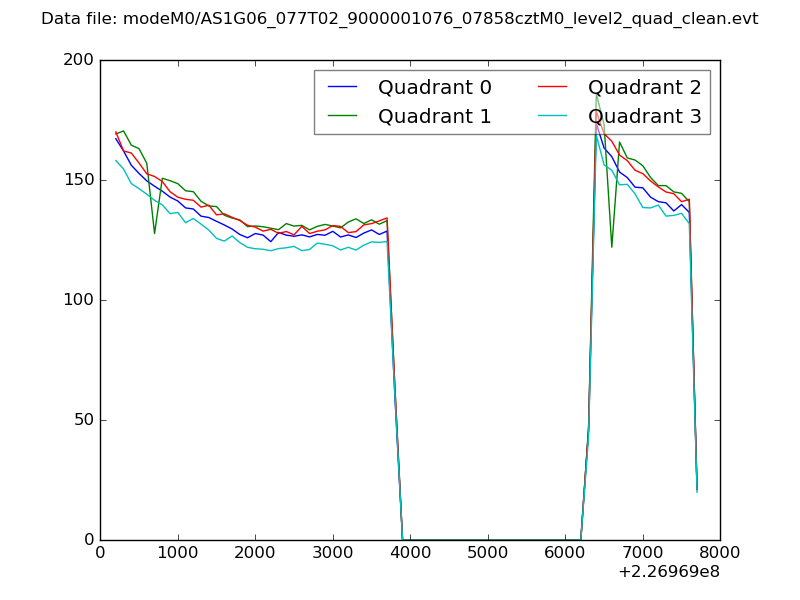 |
|
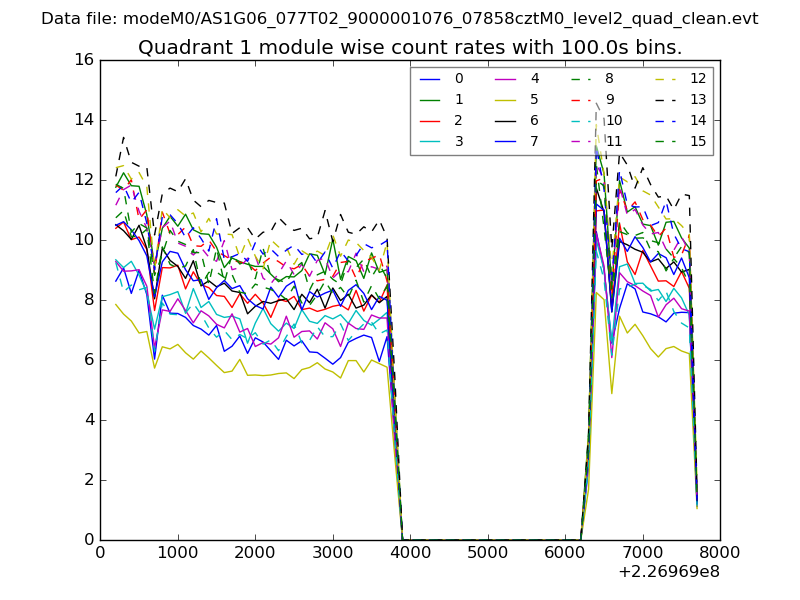
| Module-wise count rates for Quadrant A Data is divided into 100 sec bins |
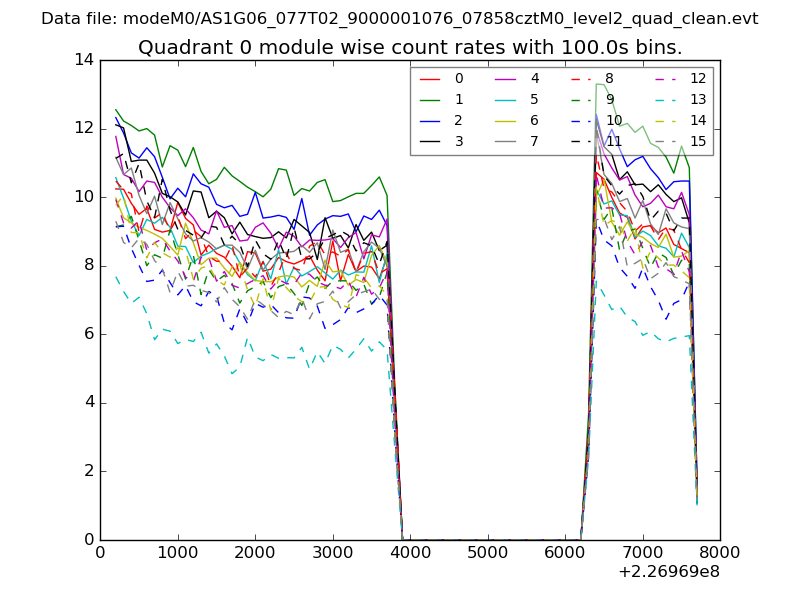 |
 |
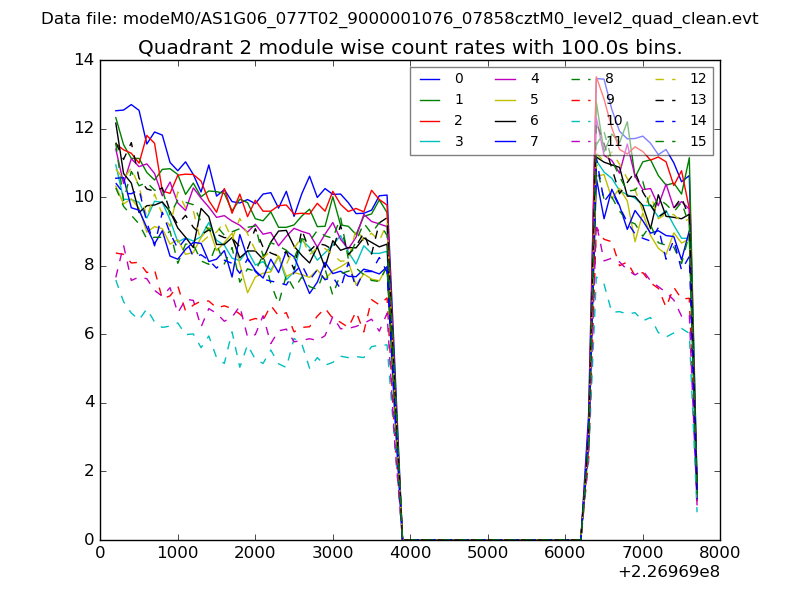
| Module-wise count rates for Quadrant B Data is divided into 100 sec bins |
 |
 |
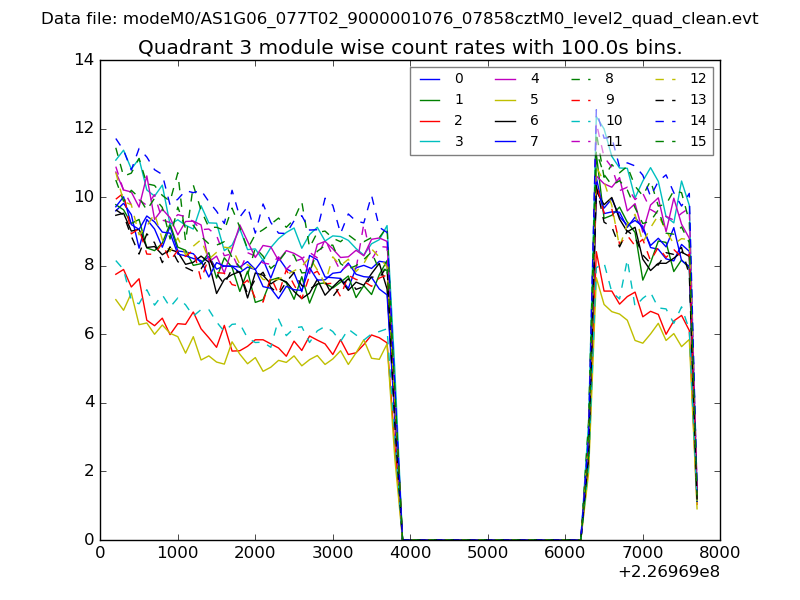
| Module-wise count rates for Quadrant C Data is divided into 100 sec bins |
 |
 |
| Module-wise count rates for Quadrant D Data is divided into 100 sec bins |
 |
 |
| Parameter | Plot |
|---|---|
| CZT HV Monitor | 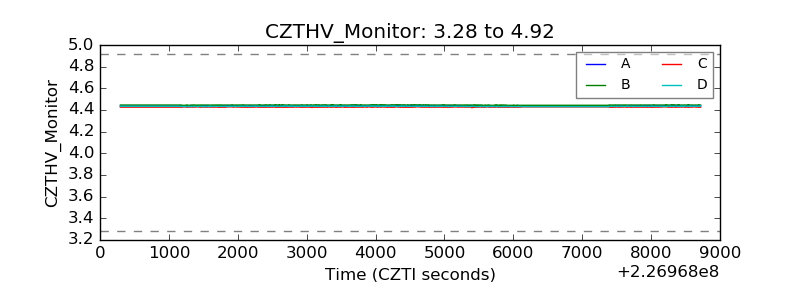 |
| D_VDD | 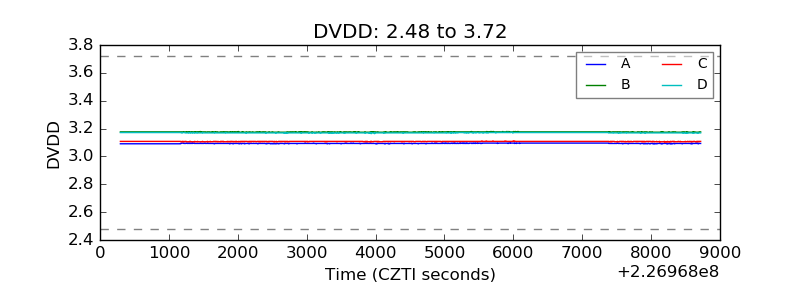 |
| Temperature 1 | 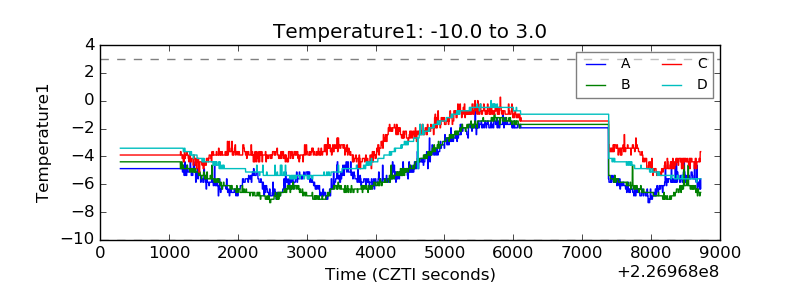 |
| Veto HV Monitor | 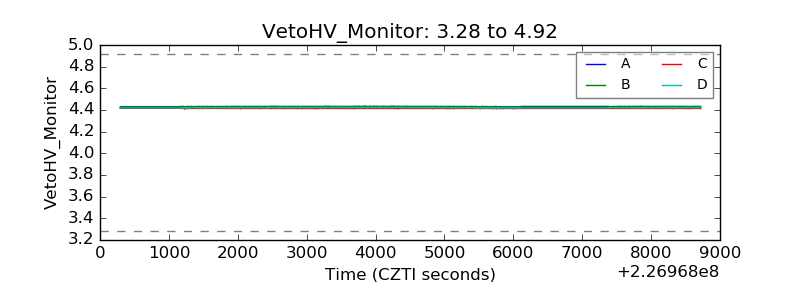 |
| Veto LLD | 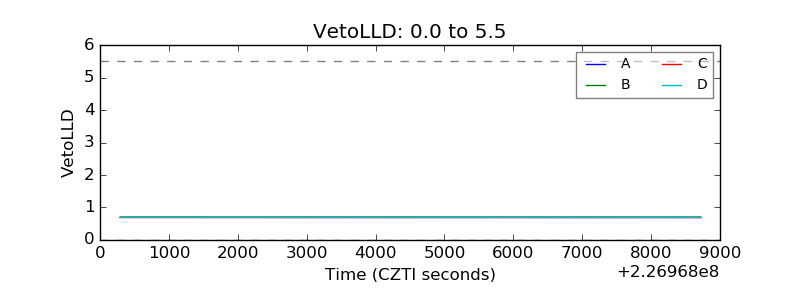 |
| Alpha Counter | 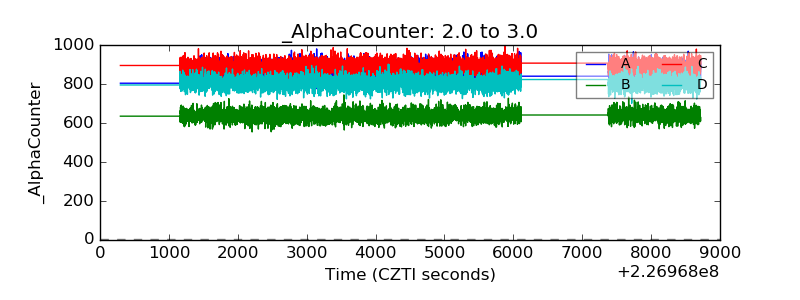 |
| _CPM_Rate | 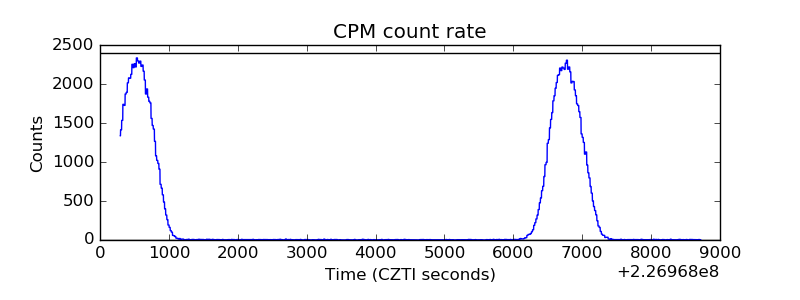 |
| CZT Counter | 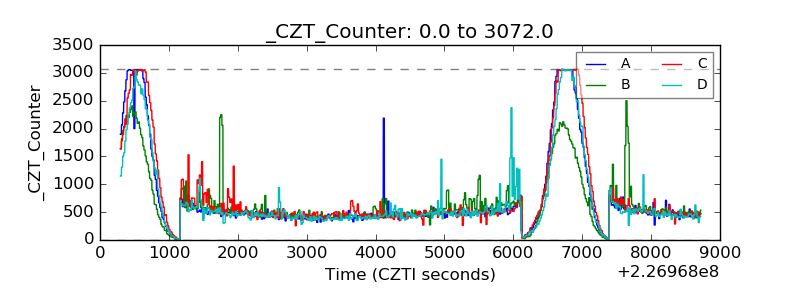 |
| +2.5 Volts monitor | 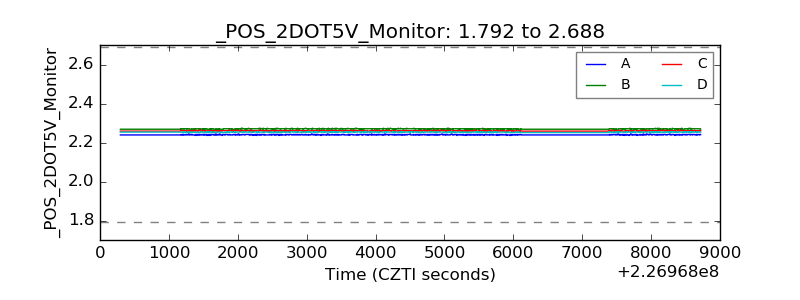 |
| +5 Volts monitor | 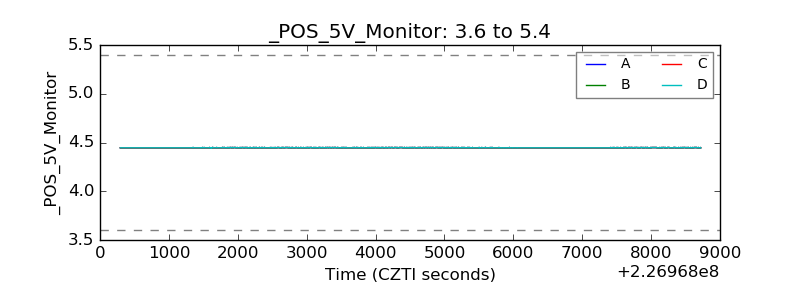 |
| _ROLL_ROT | 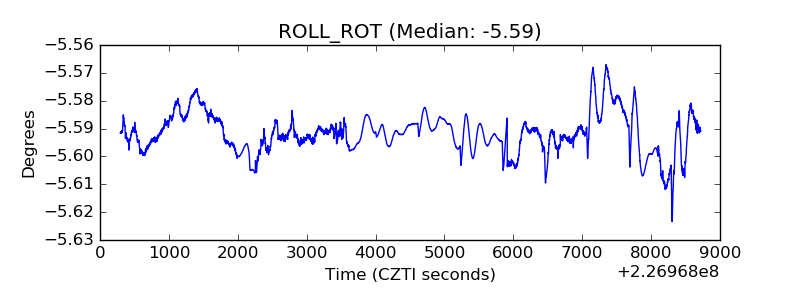 |
| _Roll_DEC | 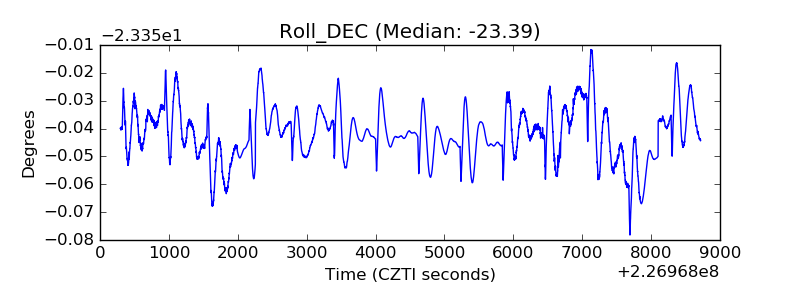 |
| _Roll_RA | 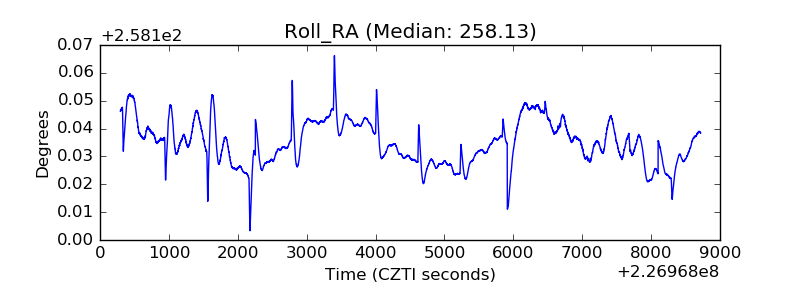 |
| Veto Counter | 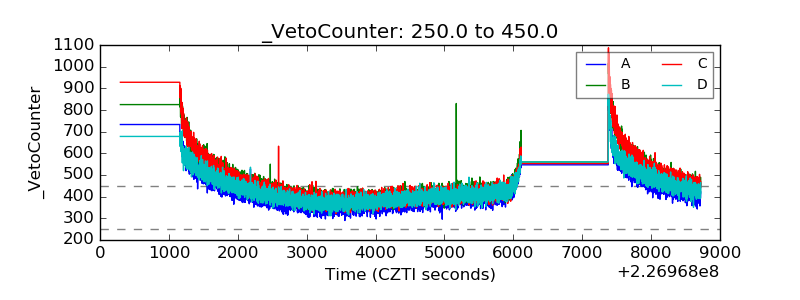 |