| Param | Original file | Final file |
|---|---|---|
| Filename | modeM0/AS1G06_077T02_9000001076_07859cztM0_level2.evt | modeM0/AS1G06_077T02_9000001076_07859cztM0_level2_quad_clean.evt |
| Size (bytes) | 475,525,440 | 108,429,120 |
| Size | 453.5 MB | 103.4 MB |
| Events in quadrant A | 3,207,303 | 699,117 |
| Events in quadrant B | 3,671,083 | 726,265 |
| Events in quadrant C | 3,421,916 | 718,387 |
| Events in quadrant D | 3,646,718 | 673,935 |
| Mode M9 | |||
|---|---|---|---|
| Quadrant | BADHDUFLAG | Total packets | Discarded packets |
| A | 0 | 25 | 0 |
| B | 0 | 25 | 0 |
| C | 0 | 25 | 0 |
| D | 0 | 25 | 0 |
| Mode M0 | |||
|---|---|---|---|
| Quadrant | BADHDUFLAG | Total packets | Discarded packets |
| A | 0 | 13867 | 3 |
| B | 0 | 15220 | 2 |
| C | 0 | 14405 | 2 |
| D | 0 | 15239 | 2 |
| Mode SS | |||
|---|---|---|---|
| Quadrant | BADHDUFLAG | Total packets | Discarded packets |
| A | 0 | 138 | 0 |
| B | 0 | 138 | 0 |
| C | 0 | 138 | 0 |
| D | 0 | 138 | 0 |
| Quadrant | Total seconds | Saturated seconds | Saturation percentage |
|---|---|---|---|
| A | 6687 | 25 | 0.373860% |
| B | 6687 | 153 | 2.288022% |
| C | 6687 | 57 | 0.852400% |
| D | 6687 | 58 | 0.867355% |
Noise dominated data is calculated using 1-second bins in cleaned event files. If a bin has >2000 counts, and if more than 50% of those come from <1% of pixels, then it is considered to be noise-dominated and hence unusable.
| Quadrant | # 1 sec bins | Bins with >0 counts | Bins with >2000 counts | High rate bins dominated by noise | Noise dominated (total time) | Noise dominated (detector-on time) | Marked lightcurve |
|---|---|---|---|---|---|---|---|
| A | 9237 | 6689 | 0 | 0 | 0.00% | 0.00% | 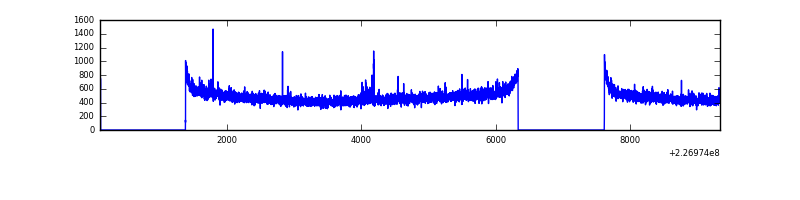 |
| B | 9237 | 6689 | 73 | 73 | 0.79% | 1.09% | 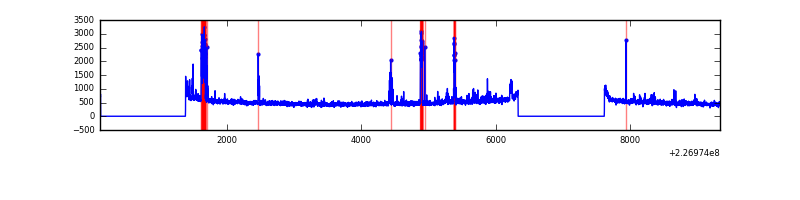 |
| C | 9237 | 6689 | 14 | 14 | 0.15% | 0.21% | 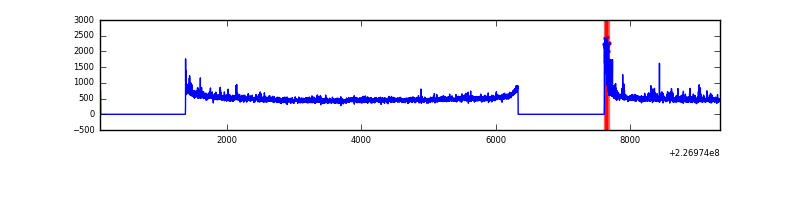 |
| D | 9237 | 6689 | 34 | 34 | 0.37% | 0.51% | 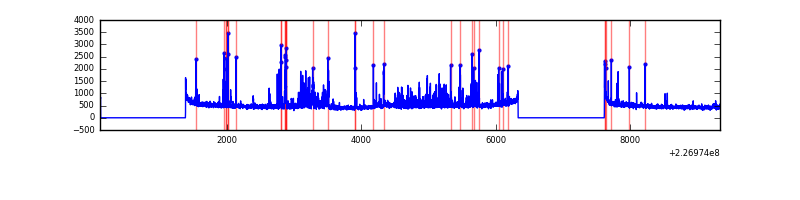 |
Top three noisy pixels from each quadrant. If the there are fewer than three noisy pixels in the level2.evt file, extra rows are filled as -1
| Pixel properties | Quadrant properties | ||||||
|---|---|---|---|---|---|---|---|
| Quadrant | DetID | PixID | Counts | Sigma | Mean | Median | Sigma |
| A | 3 | 1 | 20723 | 120.7 | 826 | 811 | 165.0 |
| A | 0 | 226 | 7795 | 42.34 | 826 | 811 | 165.0 |
| A | 12 | 194 | 6929 | 37.09 | 826 | 811 | 165.0 |
| B | 4 | 239 | 235408 | 1498.56 | 841 | 822 | 156.5 |
| B | 4 | 81 | 46422 | 291.3 | 841 | 822 | 156.5 |
| B | 4 | 173 | 44021 | 275.96 | 841 | 822 | 156.5 |
| C | 1 | 16 | 192651 | 1016.16 | 824 | 830 | 188.8 |
| C | 8 | 229 | 7416 | 34.89 | 824 | 830 | 188.8 |
| C | 13 | 61 | 6416 | 29.59 | 824 | 830 | 188.8 |
| D | 1 | 52 | 214238 | 1095.85 | 809 | 788 | 194.8 |
| D | 14 | 34 | 192629 | 984.91 | 809 | 788 | 194.8 |
| D | 13 | 104 | 47895 | 241.84 | 809 | 788 | 194.8 |
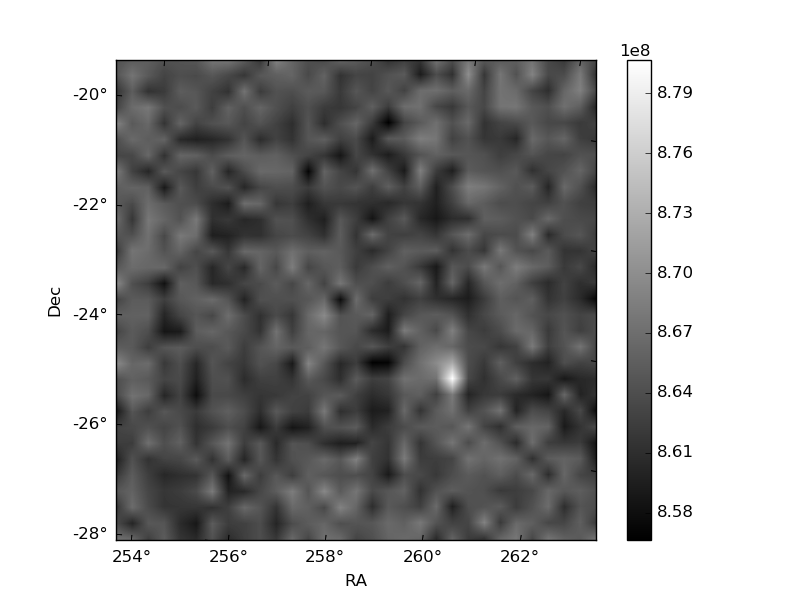
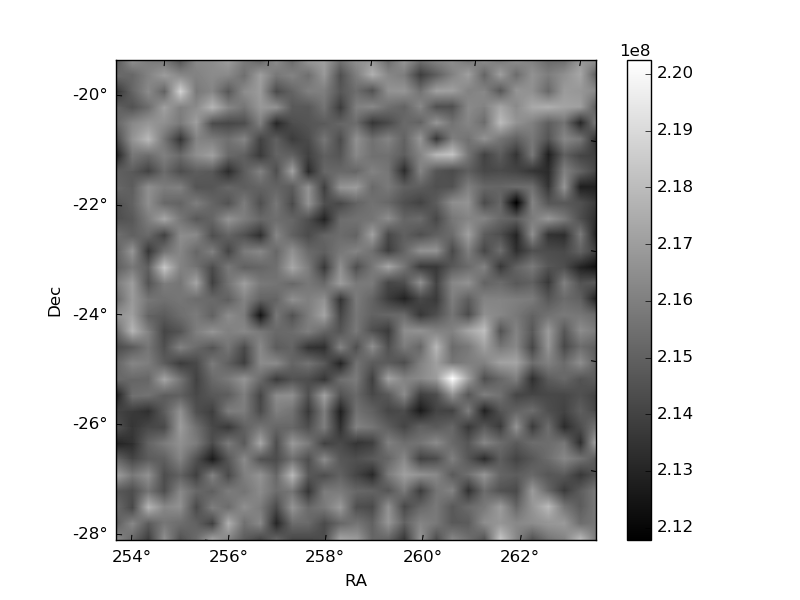
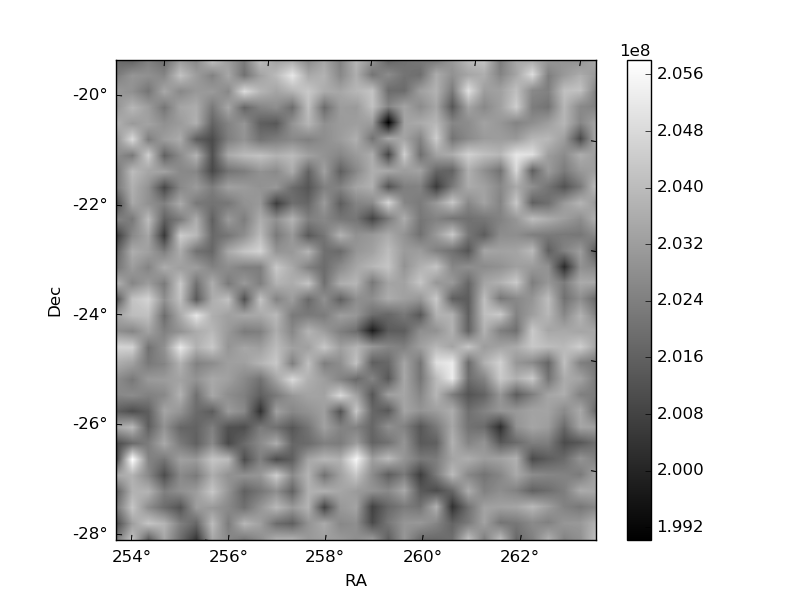
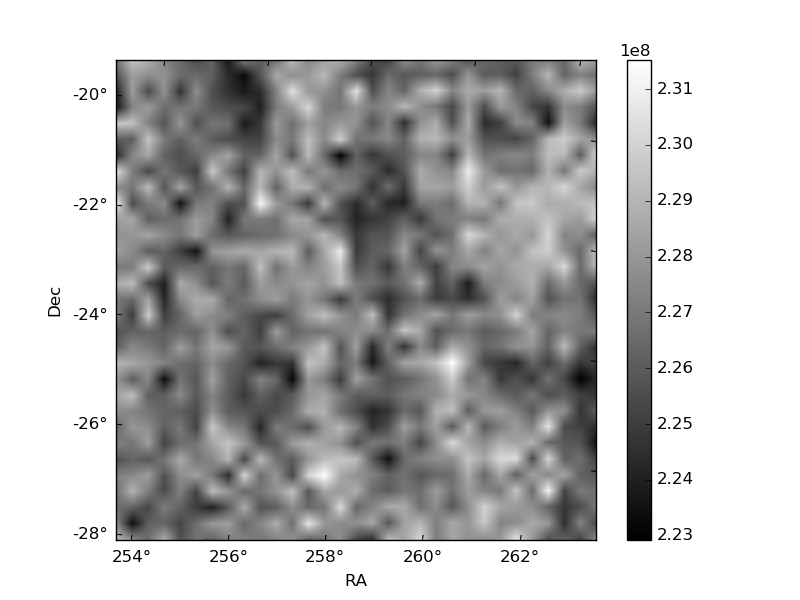
Histogram calculated using DETX and DETY for each event in the final _common_clean file
| Quadrant A | 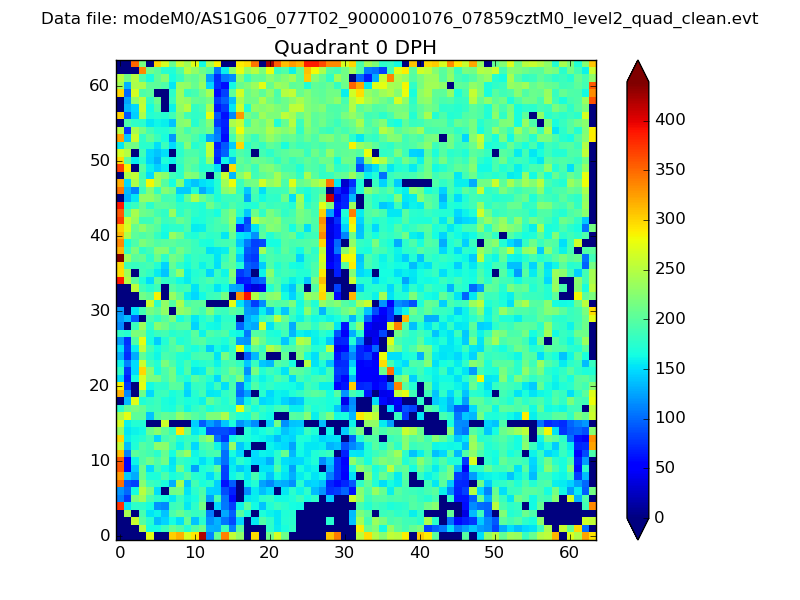 |
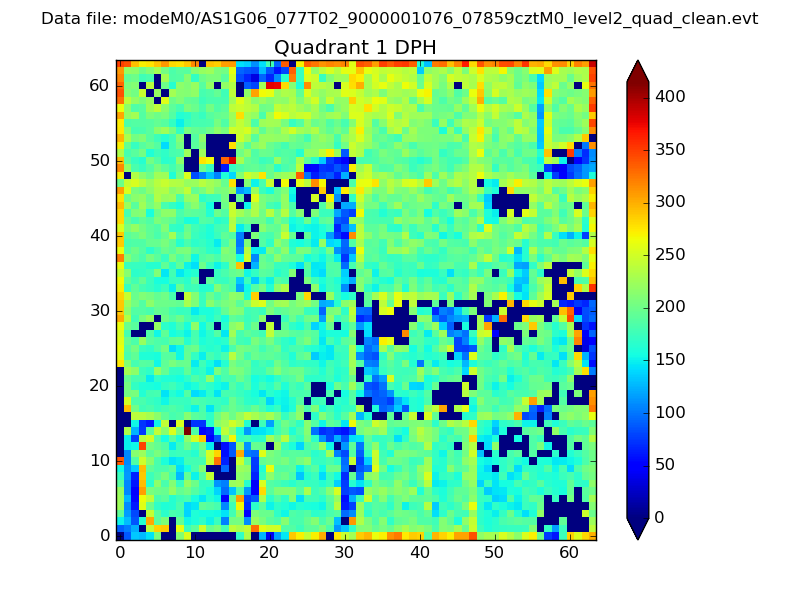 |
Quadrant B |
|---|---|---|---|
| Quadrant D | 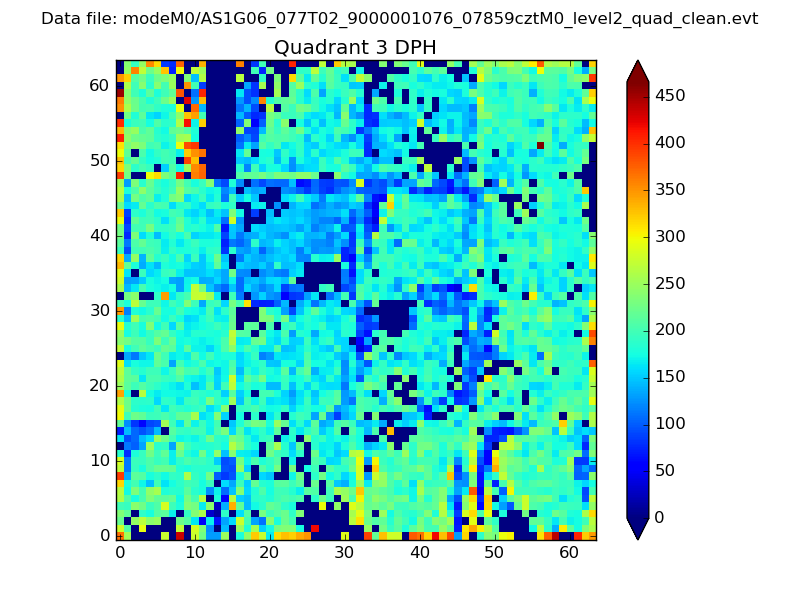 |
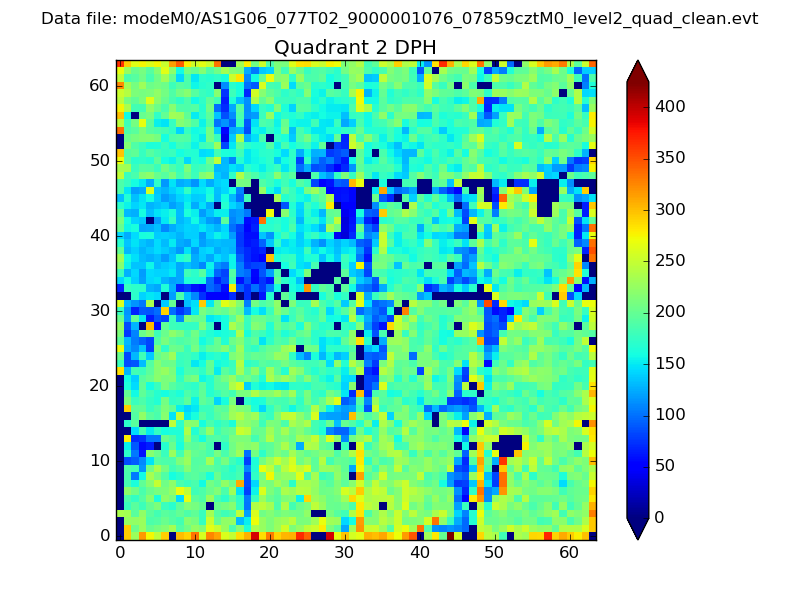 |
Quadrant C |
| Plot type | Count rate plots | Images |
|---|---|---|
| Comparison with Poisson distribution Blue bars denote a histogram of data divided into 1 sec bins. Red curve is a Poisson curve with rate = median count rate of data. |
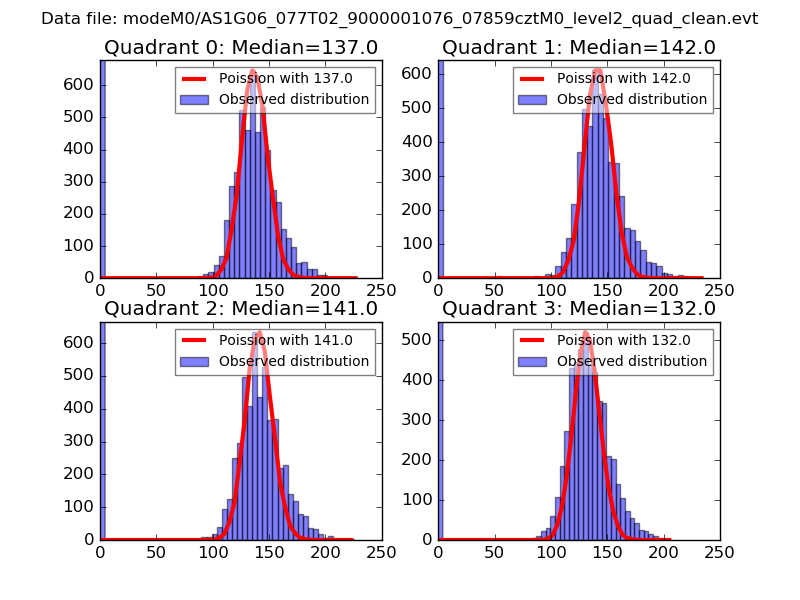 |
 |
| Quadrant-wise count rates Data is divided into 100 sec bins |
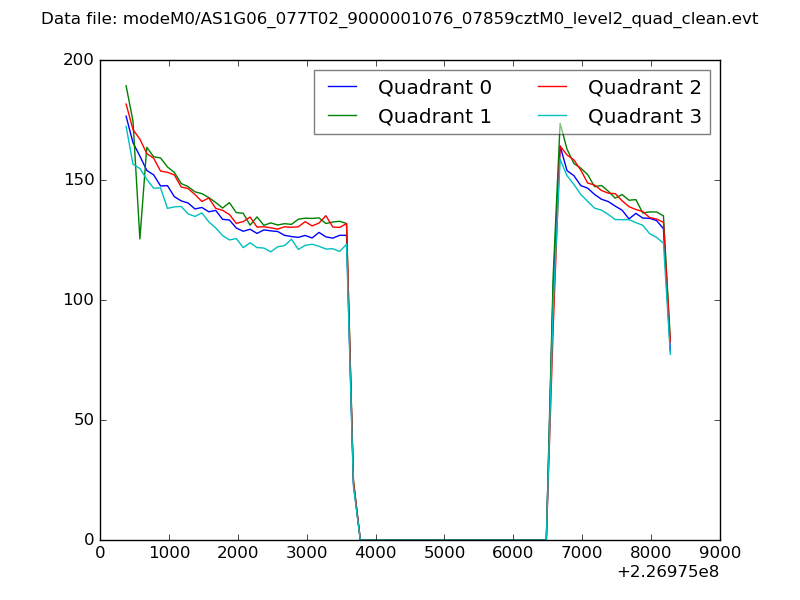 |
|
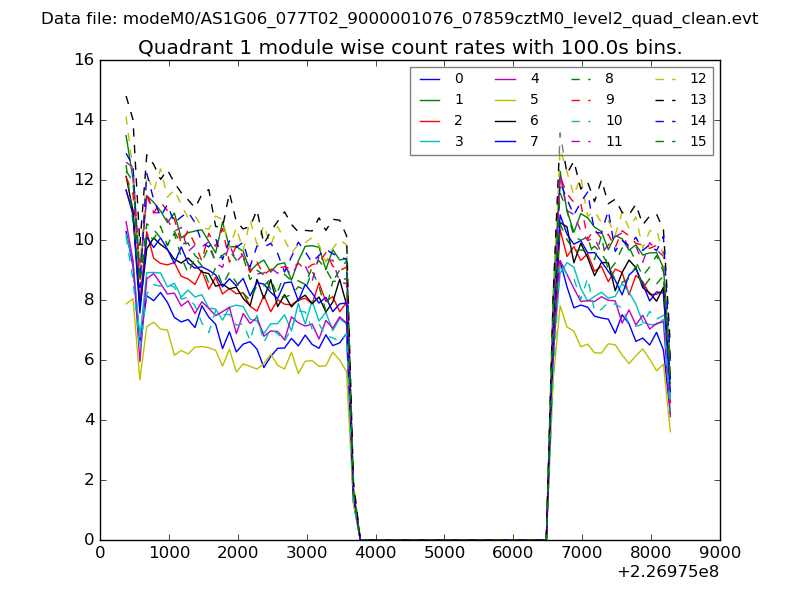
| Module-wise count rates for Quadrant A Data is divided into 100 sec bins |
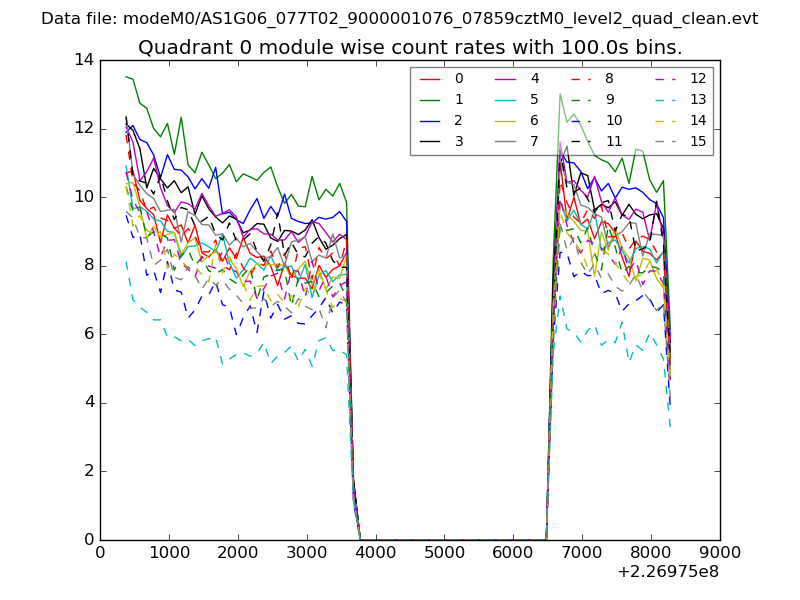 |
 |
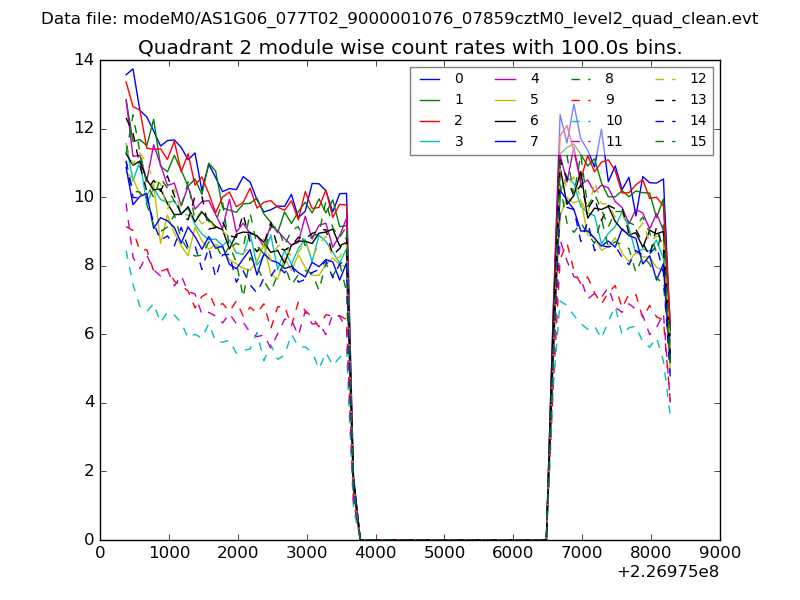
| Module-wise count rates for Quadrant B Data is divided into 100 sec bins |
 |
 |
| Module-wise count rates for Quadrant C Data is divided into 100 sec bins |
 |
 |
| Module-wise count rates for Quadrant D Data is divided into 100 sec bins |
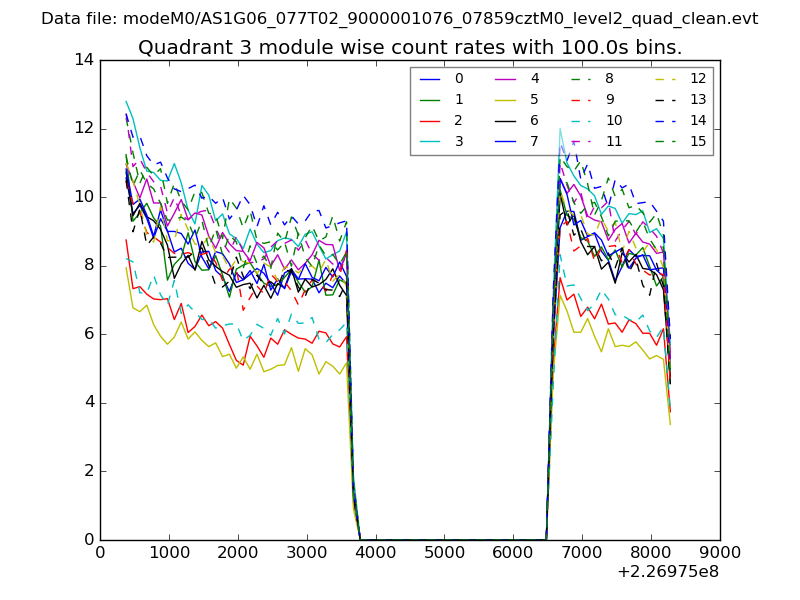 |
 |
| Parameter | Plot |
|---|---|
| CZT HV Monitor | 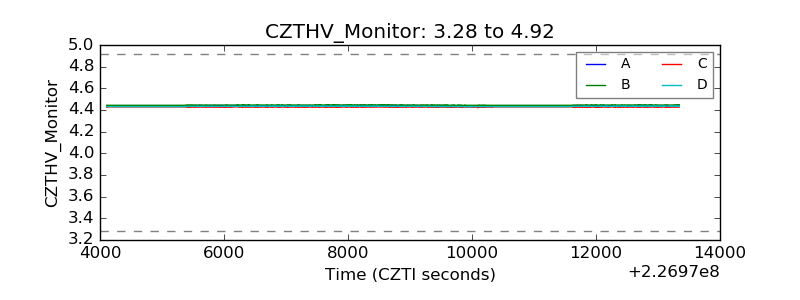 |
| D_VDD |  |
| Temperature 1 | 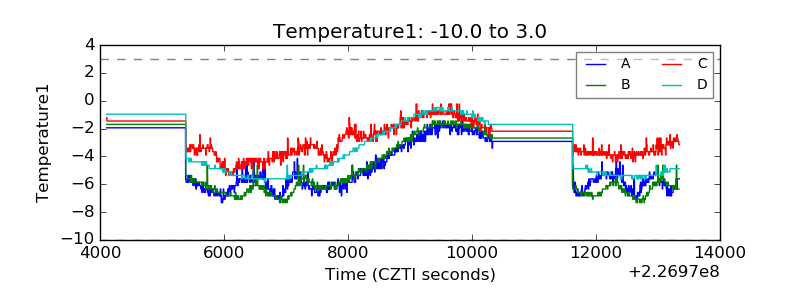 |
| Veto HV Monitor |  |
| Veto LLD | 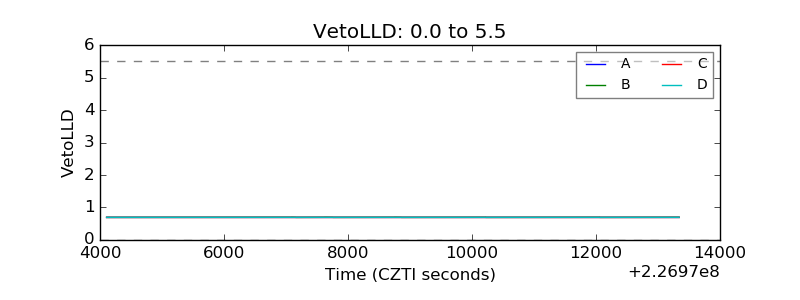 |
| Alpha Counter | 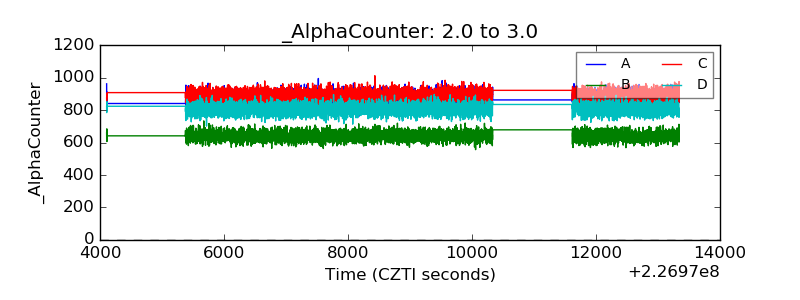 |
| _CPM_Rate | 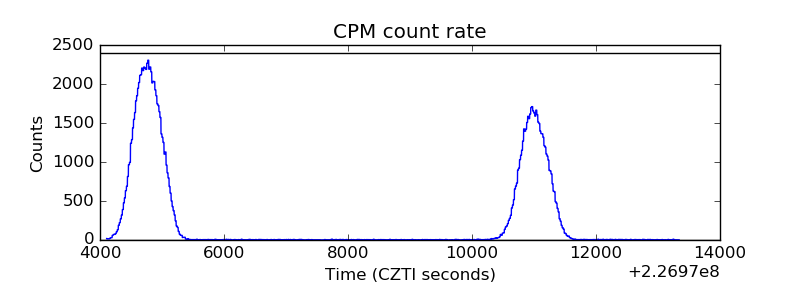 |
| CZT Counter | 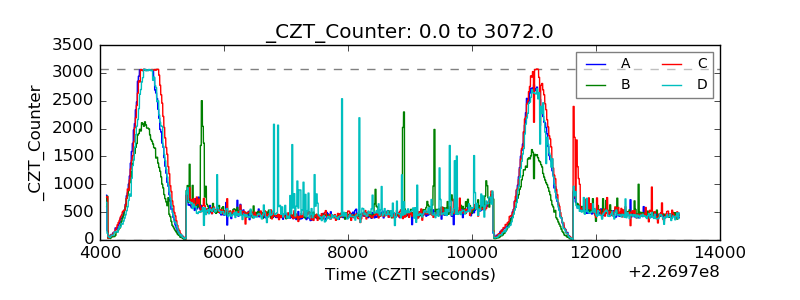 |
| +2.5 Volts monitor |  |
| +5 Volts monitor |  |
| _ROLL_ROT | 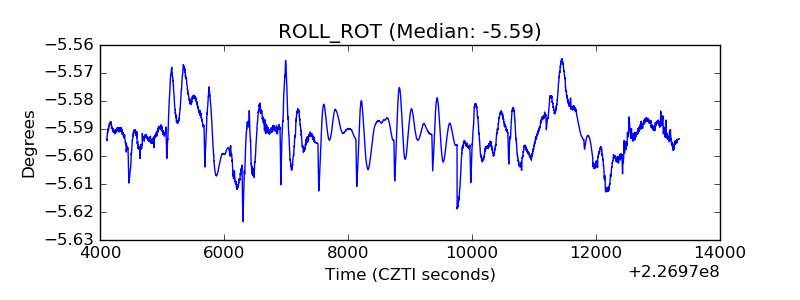 |
| _Roll_DEC | 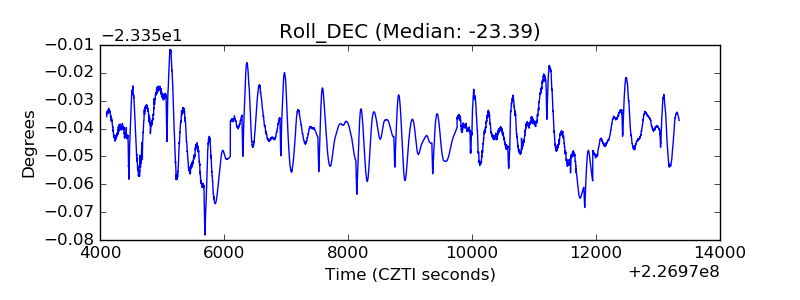 |
| _Roll_RA | 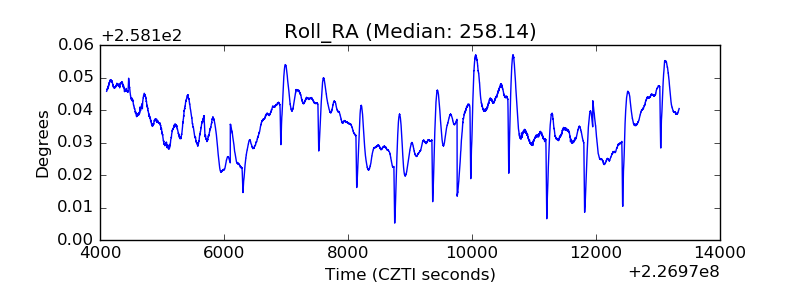 |
| Veto Counter | 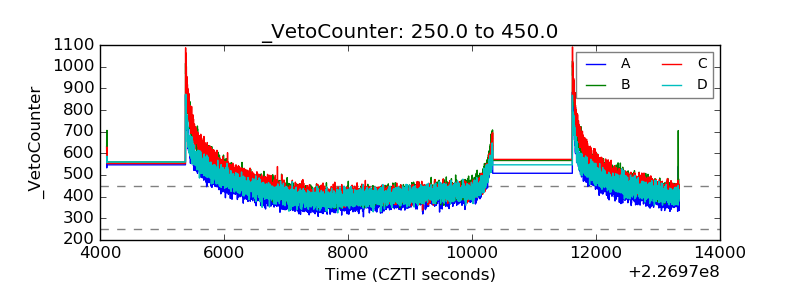 |