| Param | Original file | Final file |
|---|---|---|
| Filename | modeM0/AS1G06_077T02_9000001076_07860cztM0_level2.evt | modeM0/AS1G06_077T02_9000001076_07860cztM0_level2_quad_clean.evt |
| Size (bytes) | 465,134,400 | 97,548,480 |
| Size | 443.6 MB | 93.0 MB |
| Events in quadrant A | 3,220,284 | 617,434 |
| Events in quadrant B | 3,435,634 | 643,442 |
| Events in quadrant C | 3,652,793 | 632,153 |
| Events in quadrant D | 3,325,768 | 597,151 |
| Mode M9 | |||
|---|---|---|---|
| Quadrant | BADHDUFLAG | Total packets | Discarded packets |
| A | 0 | 19 | 0 |
| B | 0 | 19 | 0 |
| C | 0 | 19 | 0 |
| D | 0 | 20 | 0 |
| Mode M0 | |||
|---|---|---|---|
| Quadrant | BADHDUFLAG | Total packets | Discarded packets |
| A | 0 | 13961 | 3 |
| B | 0 | 14513 | 2 |
| C | 0 | 15085 | 2 |
| D | 0 | 14359 | 2 |
| Mode SS | |||
|---|---|---|---|
| Quadrant | BADHDUFLAG | Total packets | Discarded packets |
| A | 0 | 136 | 0 |
| B | 0 | 136 | 0 |
| C | 0 | 136 | 0 |
| D | 0 | 136 | 0 |
| Quadrant | Total seconds | Saturated seconds | Saturation percentage |
|---|---|---|---|
| A | 6661 | 41 | 0.615523% |
| B | 6661 | 85 | 1.276085% |
| C | 6661 | 86 | 1.291097% |
| D | 6661 | 71 | 1.065906% |
Noise dominated data is calculated using 1-second bins in cleaned event files. If a bin has >2000 counts, and if more than 50% of those come from <1% of pixels, then it is considered to be noise-dominated and hence unusable.
| Quadrant | # 1 sec bins | Bins with >0 counts | Bins with >2000 counts | High rate bins dominated by noise | Noise dominated (total time) | Noise dominated (detector-on time) | Marked lightcurve |
|---|---|---|---|---|---|---|---|
| A | 7921 | 6663 | 2 | 2 | 0.03% | 0.03% | 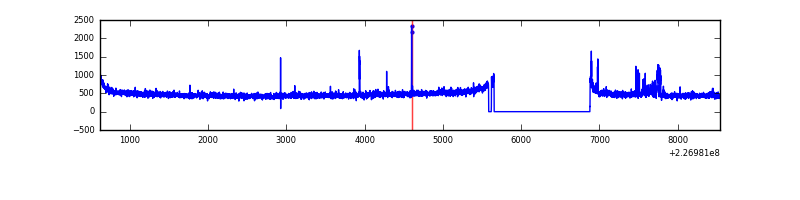 |
| B | 7921 | 6663 | 29 | 29 | 0.37% | 0.44% | 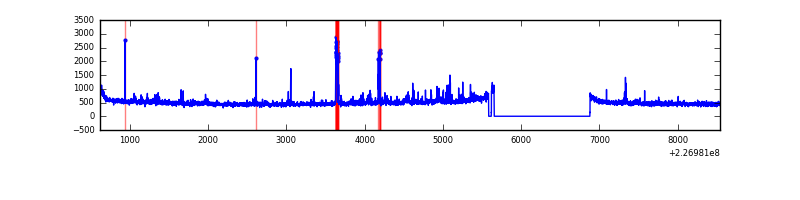 |
| C | 7921 | 6663 | 14 | 14 | 0.18% | 0.21% | 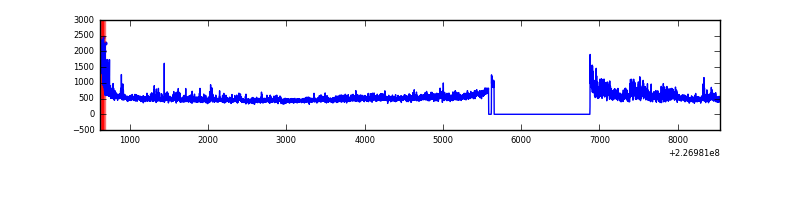 |
| D | 7921 | 6663 | 37 | 37 | 0.47% | 0.56% | 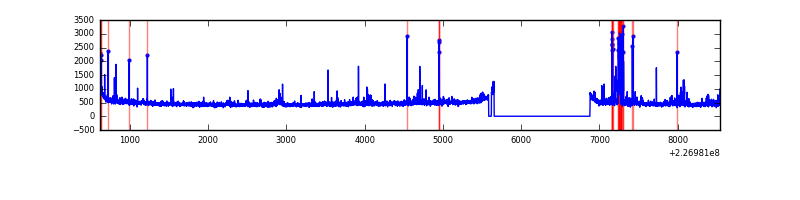 |
Top three noisy pixels from each quadrant. If the there are fewer than three noisy pixels in the level2.evt file, extra rows are filled as -1
| Pixel properties | Quadrant properties | ||||||
|---|---|---|---|---|---|---|---|
| Quadrant | DetID | PixID | Counts | Sigma | Mean | Median | Sigma |
| A | 15 | 234 | 67058 | 408.3 | 812 | 795 | 162.3 |
| A | 15 | 174 | 16127 | 94.47 | 812 | 795 | 162.3 |
| A | 0 | 226 | 7797 | 43.15 | 812 | 795 | 162.3 |
| B | 4 | 239 | 107246 | 687.98 | 825 | 806 | 154.7 |
| B | 4 | 173 | 74898 | 478.9 | 825 | 806 | 154.7 |
| B | 15 | 204 | 19439 | 120.44 | 825 | 806 | 154.7 |
| C | 1 | 16 | 498420 | 2690.22 | 804 | 809 | 185.0 |
| C | 8 | 229 | 11938 | 60.17 | 804 | 809 | 185.0 |
| C | 13 | 61 | 6202 | 29.16 | 804 | 809 | 185.0 |
| D | 1 | 52 | 182321 | 937.48 | 796 | 773 | 193.7 |
| D | 2 | 152 | 79417 | 406.1 | 796 | 773 | 193.7 |
| D | 13 | 104 | 32091 | 161.72 | 796 | 773 | 193.7 |
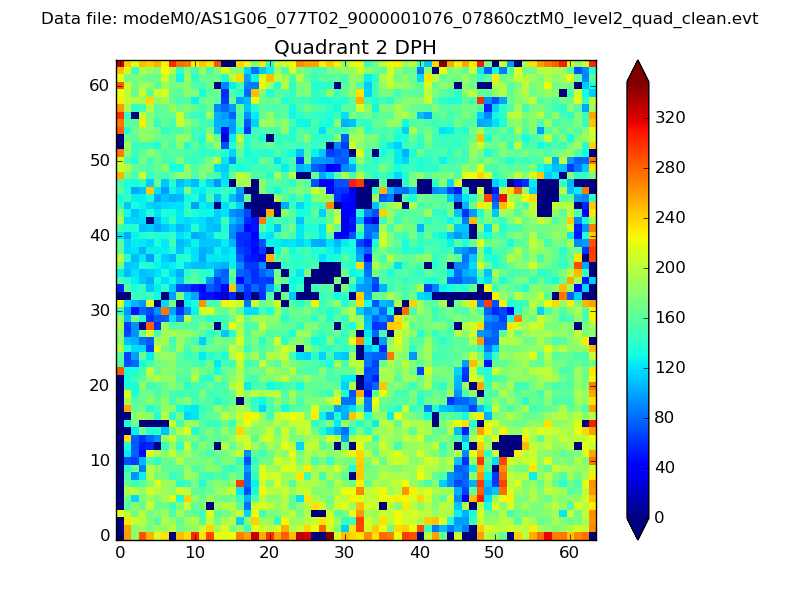
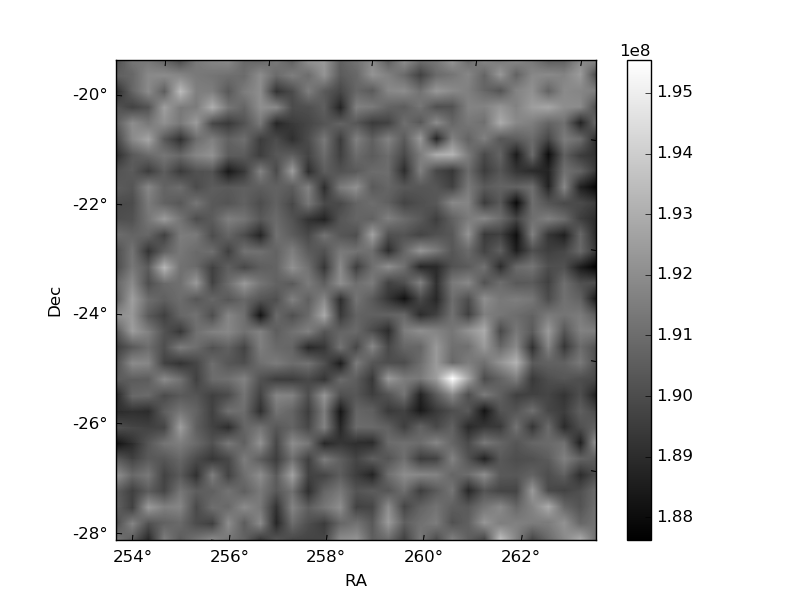
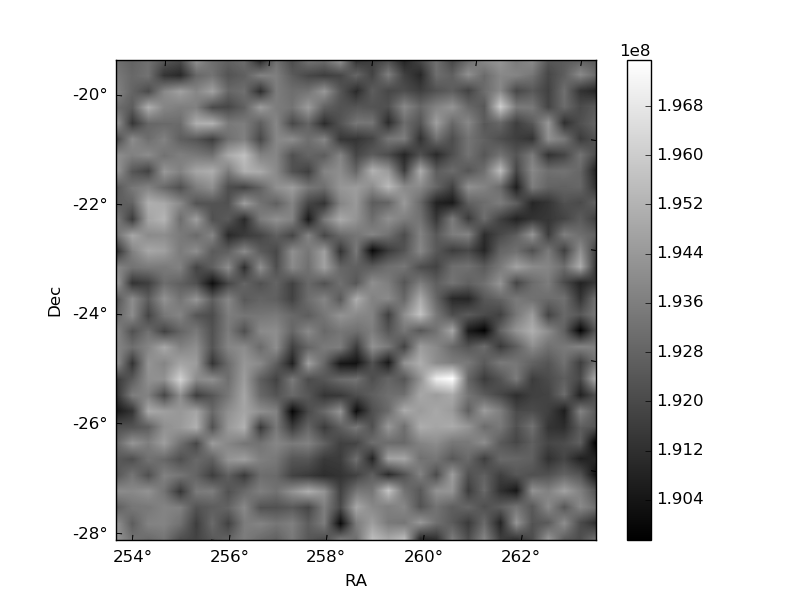
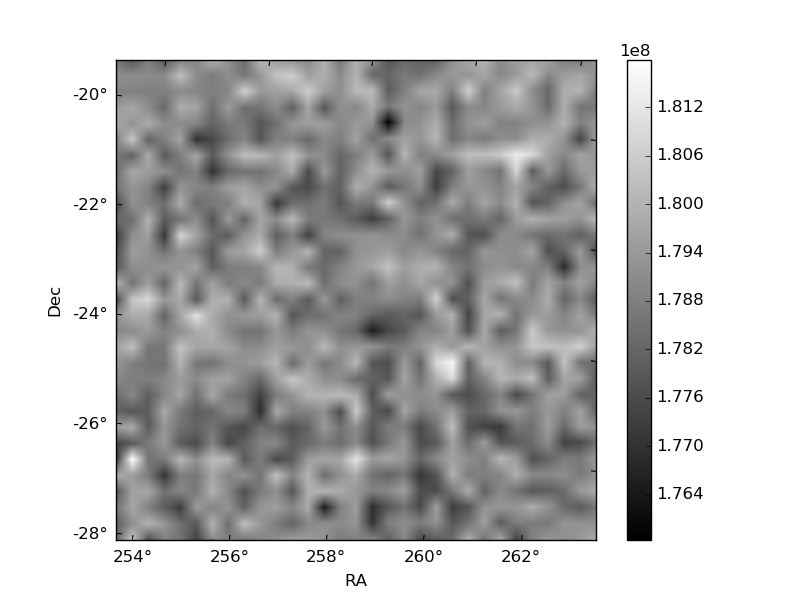
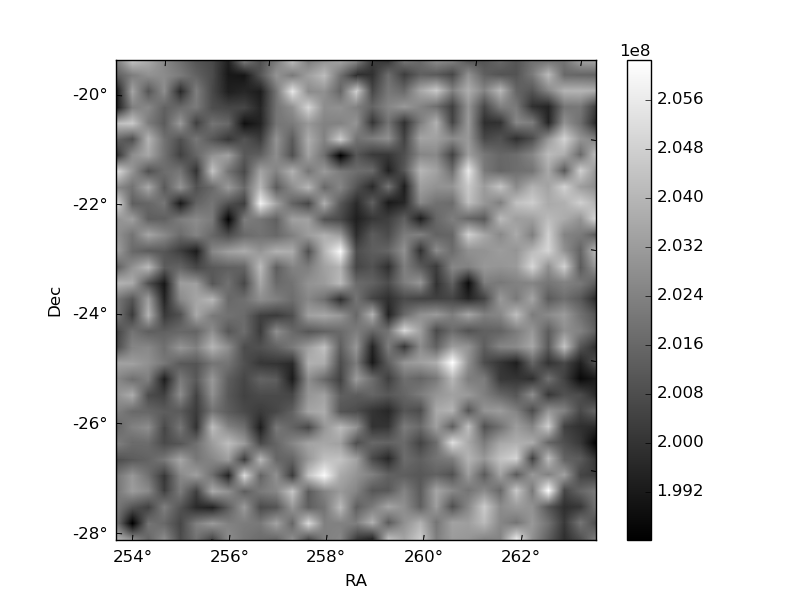
Histogram calculated using DETX and DETY for each event in the final _common_clean file
| Quadrant A | 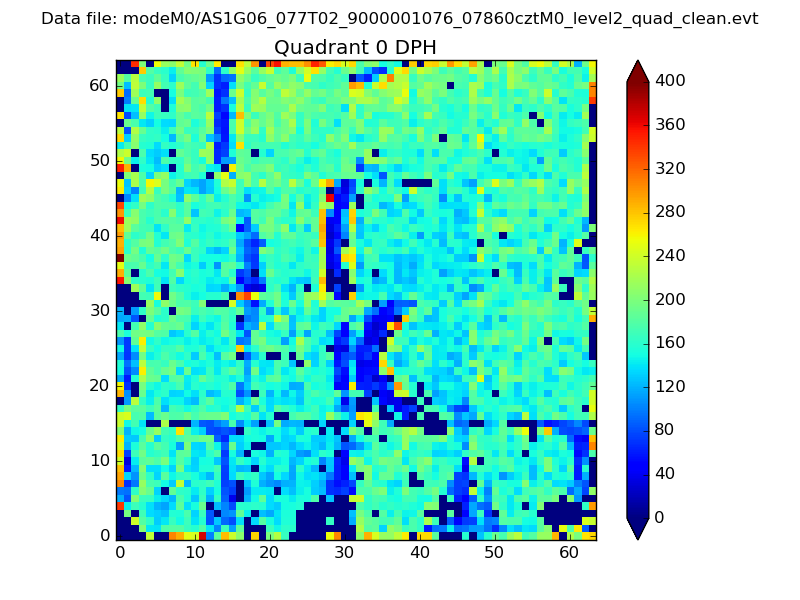 |
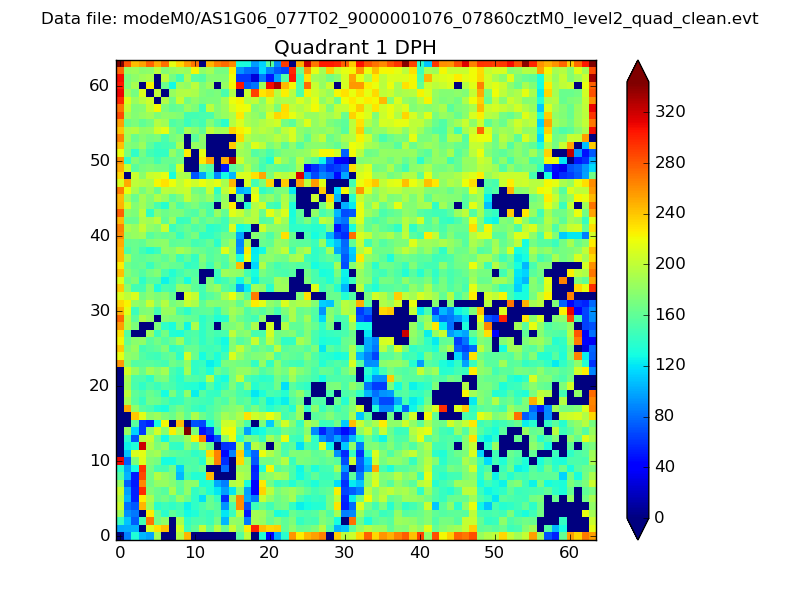 |
Quadrant B |
|---|---|---|---|
| Quadrant D | 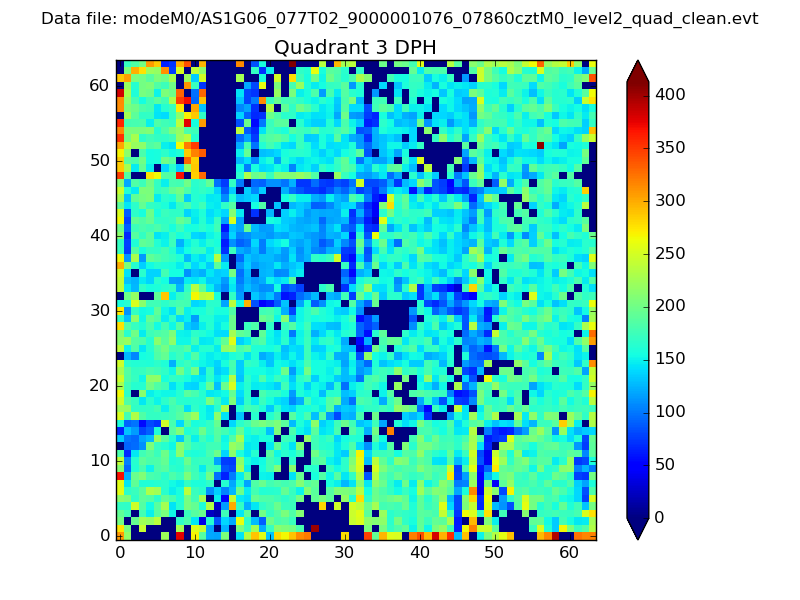 |
 |
Quadrant C |
| Plot type | Count rate plots | Images |
|---|---|---|
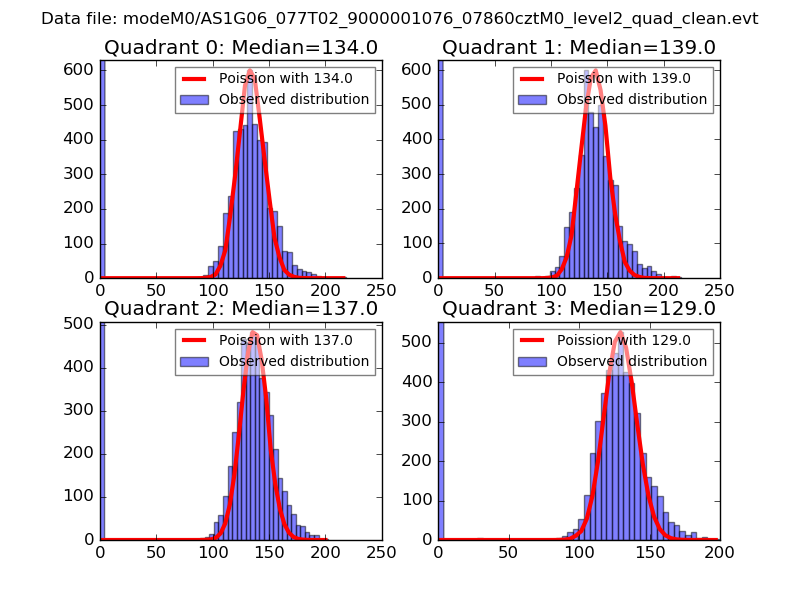
| Comparison with Poisson distribution Blue bars denote a histogram of data divided into 1 sec bins. Red curve is a Poisson curve with rate = median count rate of data. |
 |
 |
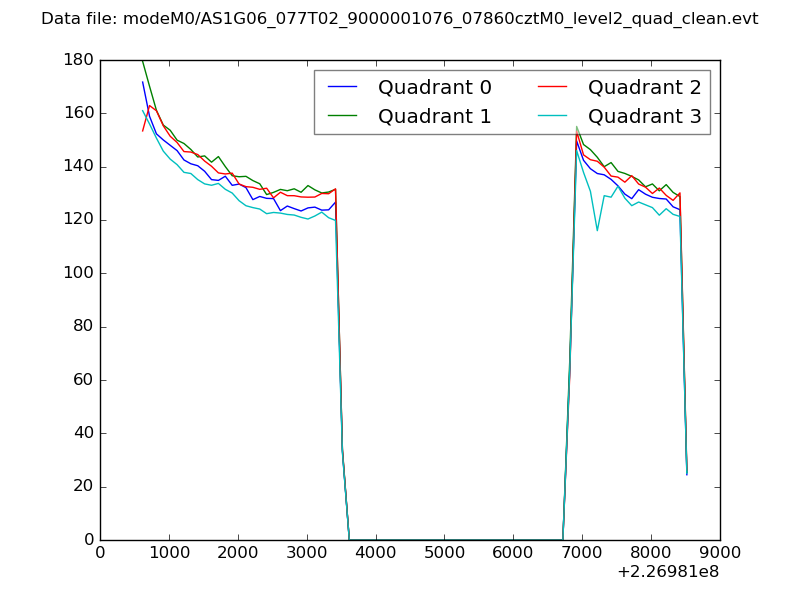
| Quadrant-wise count rates Data is divided into 100 sec bins |
 |
|
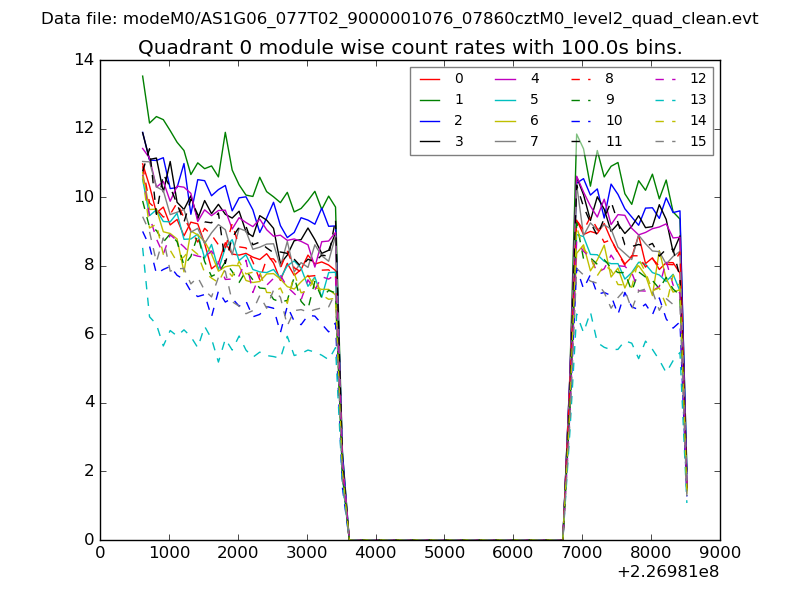
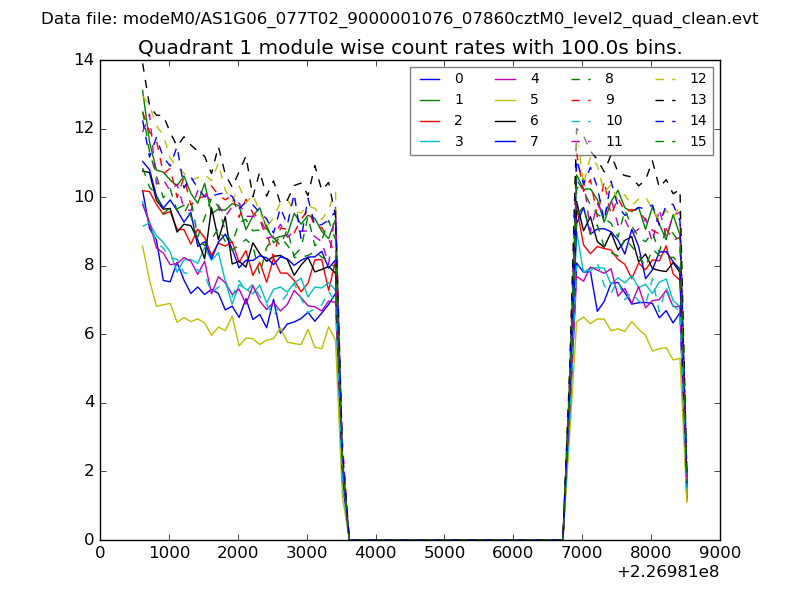
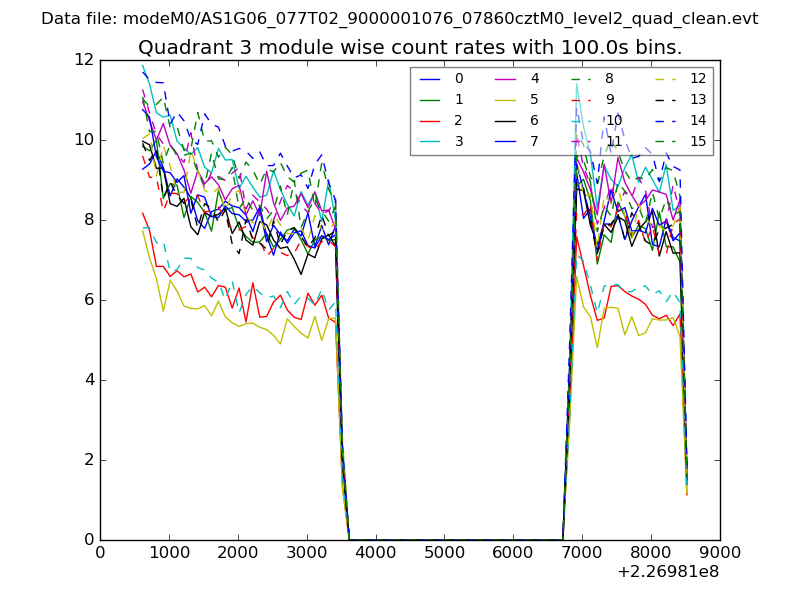
| Module-wise count rates for Quadrant A Data is divided into 100 sec bins |
 |
 |
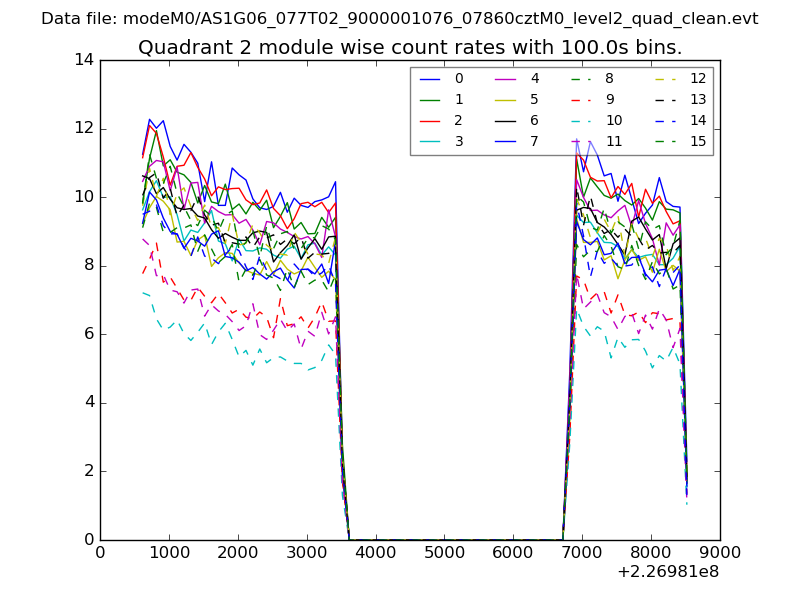
| Module-wise count rates for Quadrant B Data is divided into 100 sec bins |
 |
 |
| Module-wise count rates for Quadrant C Data is divided into 100 sec bins |
 |
 |
| Module-wise count rates for Quadrant D Data is divided into 100 sec bins |
 |
 |
| Parameter | Plot |
|---|---|
| CZT HV Monitor | 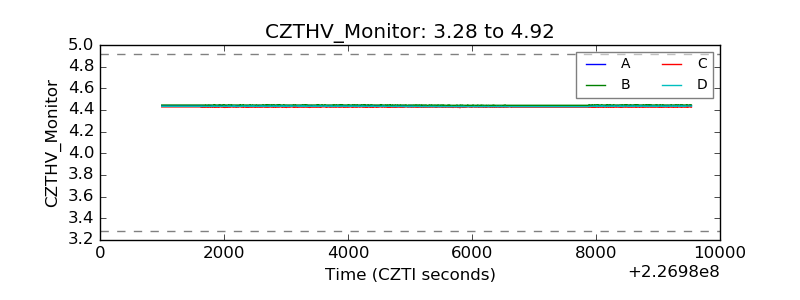 |
| D_VDD | 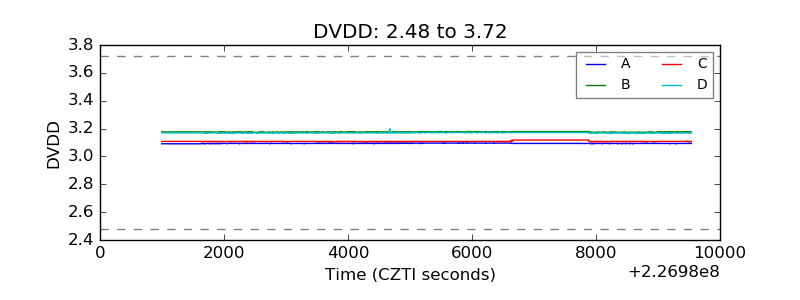 |
| Temperature 1 | 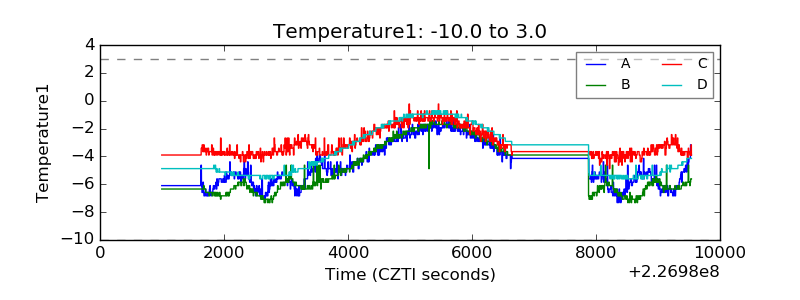 |
| Veto HV Monitor | 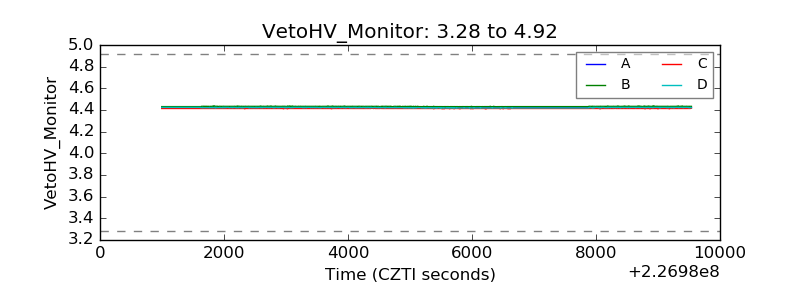 |
| Veto LLD | 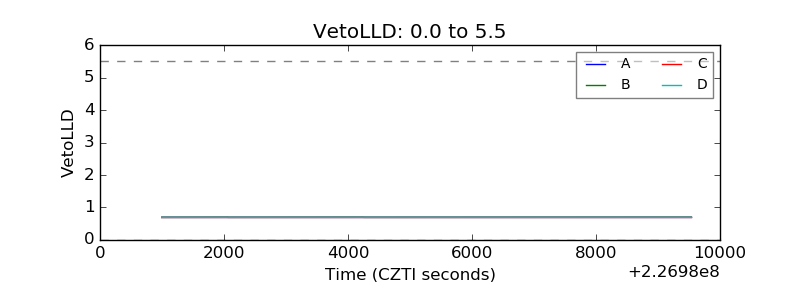 |
| Alpha Counter | 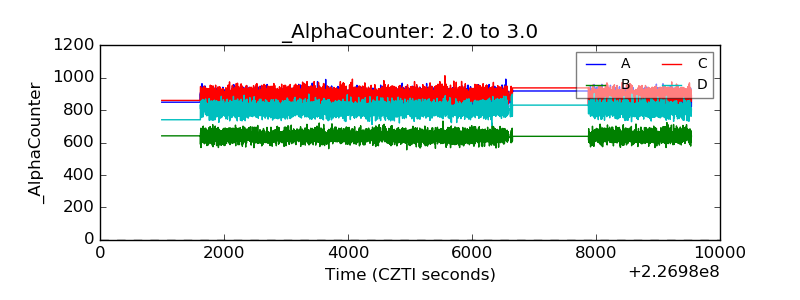 |
| _CPM_Rate | 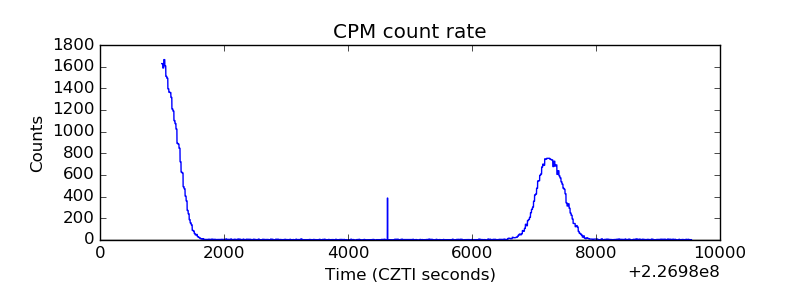 |
| CZT Counter | 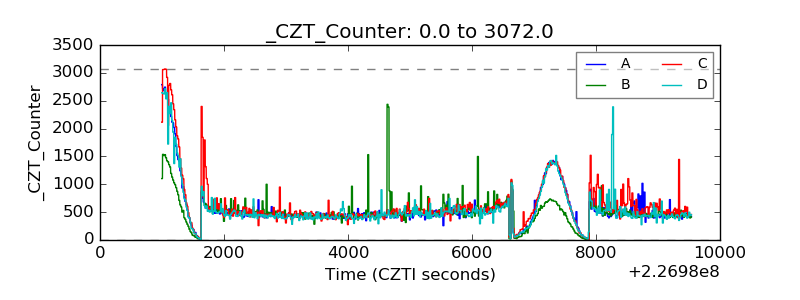 |
| +2.5 Volts monitor | 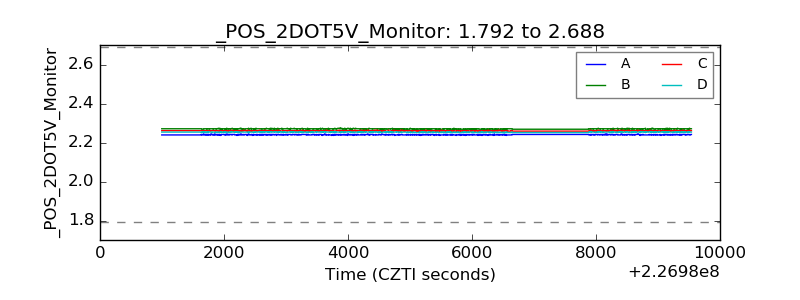 |
| +5 Volts monitor |  |
| _ROLL_ROT |  |
| _Roll_DEC |  |
| _Roll_RA | 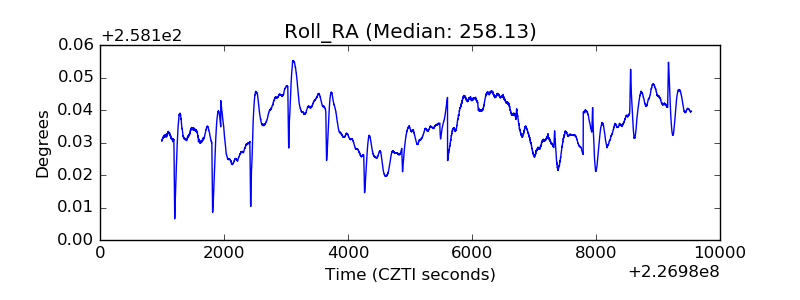 |
| Veto Counter | 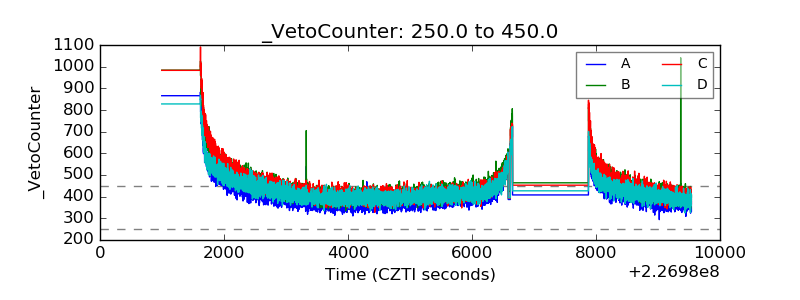 |