| Param | Original file | Final file |
|---|---|---|
| Filename | modeM0/AS1G06_077T02_9000001076_07861cztM0_level2.evt | modeM0/AS1G06_077T02_9000001076_07861cztM0_level2_quad_clean.evt |
| Size (bytes) | 298,609,920 | 49,150,080 |
| Size | 284.8 MB | 46.9 MB |
| Events in quadrant A | 2,078,992 | 290,063 |
| Events in quadrant B | 2,267,358 | 301,092 |
| Events in quadrant C | 2,205,025 | 299,099 |
| Events in quadrant D | 2,186,112 | 282,357 |
| Mode M0 | |||
|---|---|---|---|
| Quadrant | BADHDUFLAG | Total packets | Discarded packets |
| A | 0 | 9150 | 1 |
| B | 0 | 9629 | 0 |
| C | 0 | 9442 | 0 |
| D | 0 | 9518 | 0 |
| Mode SS | |||
|---|---|---|---|
| Quadrant | BADHDUFLAG | Total packets | Discarded packets |
| A | 0 | 90 | 0 |
| B | 0 | 90 | 0 |
| C | 0 | 90 | 0 |
| D | 0 | 90 | 0 |
| Quadrant | Total seconds | Saturated seconds | Saturation percentage |
|---|---|---|---|
| A | 4480 | 4 | 0.089286% |
| B | 4480 | 49 | 1.093750% |
| C | 4480 | 2 | 0.044643% |
| D | 4480 | 24 | 0.535714% |
Noise dominated data is calculated using 1-second bins in cleaned event files. If a bin has >2000 counts, and if more than 50% of those come from <1% of pixels, then it is considered to be noise-dominated and hence unusable.
| Quadrant | # 1 sec bins | Bins with >0 counts | Bins with >2000 counts | High rate bins dominated by noise | Noise dominated (total time) | Noise dominated (detector-on time) | Marked lightcurve |
|---|---|---|---|---|---|---|---|
| A | 4480 | 4480 | 0 | 0 | 0.00% | 0.00% |  |
| B | 4480 | 4480 | 31 | 31 | 0.69% | 0.69% |  |
| C | 4480 | 4480 | 0 | 0 | 0.00% | 0.00% | 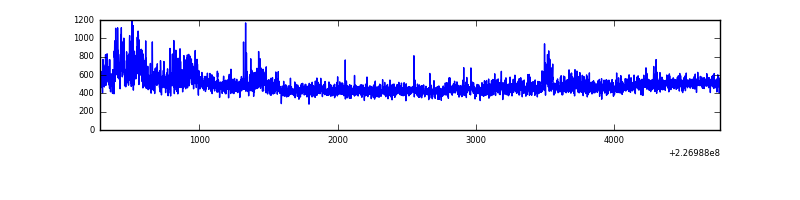 |
| D | 4480 | 4480 | 15 | 15 | 0.33% | 0.33% | 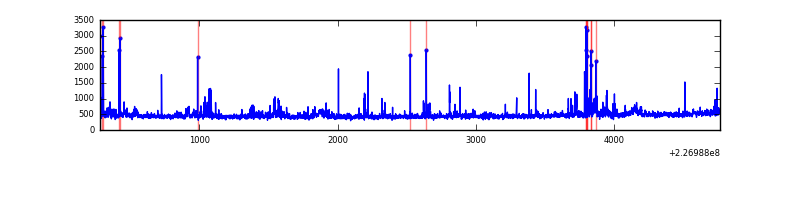 |
Top three noisy pixels from each quadrant. If the there are fewer than three noisy pixels in the level2.evt file, extra rows are filled as -1
| Pixel properties | Quadrant properties | ||||||
|---|---|---|---|---|---|---|---|
| Quadrant | DetID | PixID | Counts | Sigma | Mean | Median | Sigma |
| A | 15 | 234 | 66339 | 617.37 | 521 | 510 | 106.6 |
| A | 0 | 226 | 4854 | 40.74 | 521 | 510 | 106.6 |
| A | 12 | 194 | 4591 | 38.27 | 521 | 510 | 106.6 |
| B | 4 | 239 | 133316 | 1339.13 | 522 | 512 | 99.2 |
| B | 4 | 173 | 48965 | 488.58 | 522 | 512 | 99.2 |
| B | 0 | 219 | 19485 | 191.31 | 522 | 512 | 99.2 |
| C | 1 | 16 | 199386 | 1663.21 | 512 | 516 | 119.6 |
| C | 8 | 229 | 4794 | 35.78 | 512 | 516 | 119.6 |
| C | 13 | 61 | 3890 | 28.22 | 512 | 516 | 119.6 |
| D | 1 | 52 | 84860 | 676.42 | 511 | 496 | 124.7 |
| D | 2 | 136 | 62590 | 497.86 | 511 | 496 | 124.7 |
| D | 2 | 152 | 42674 | 338.18 | 511 | 496 | 124.7 |
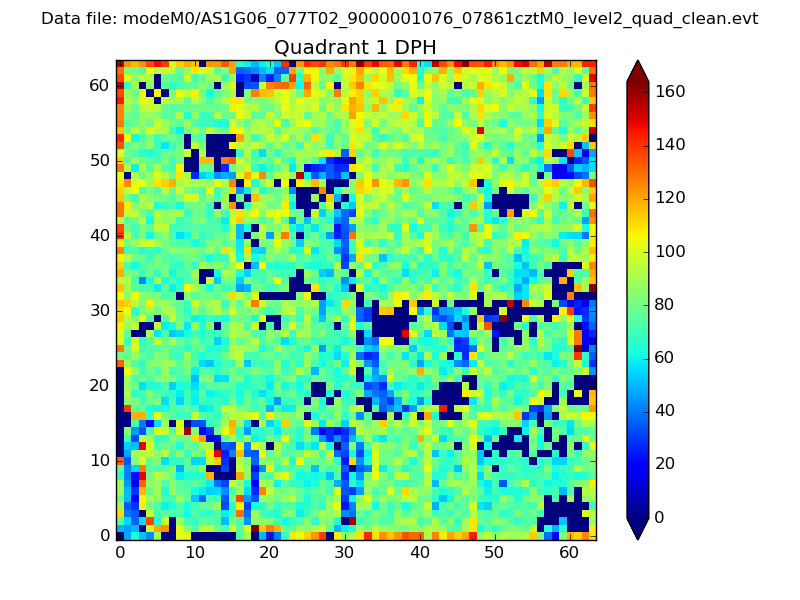
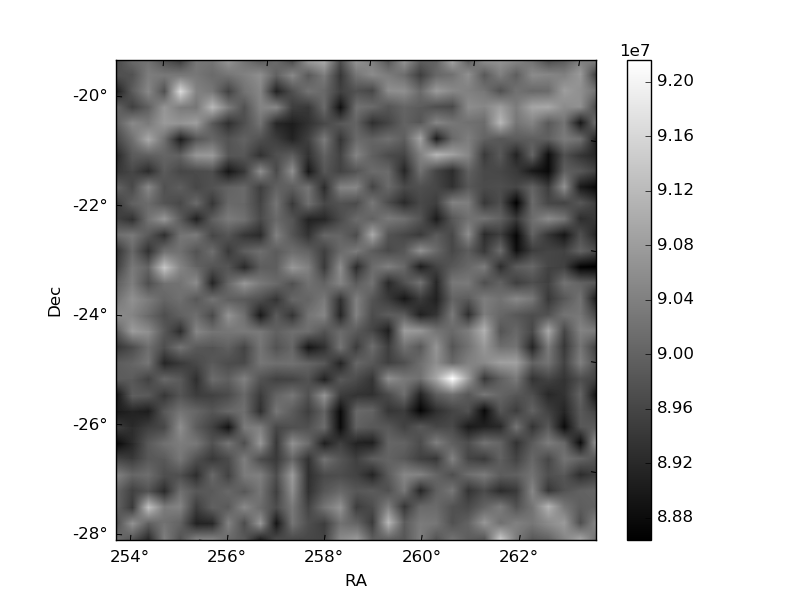
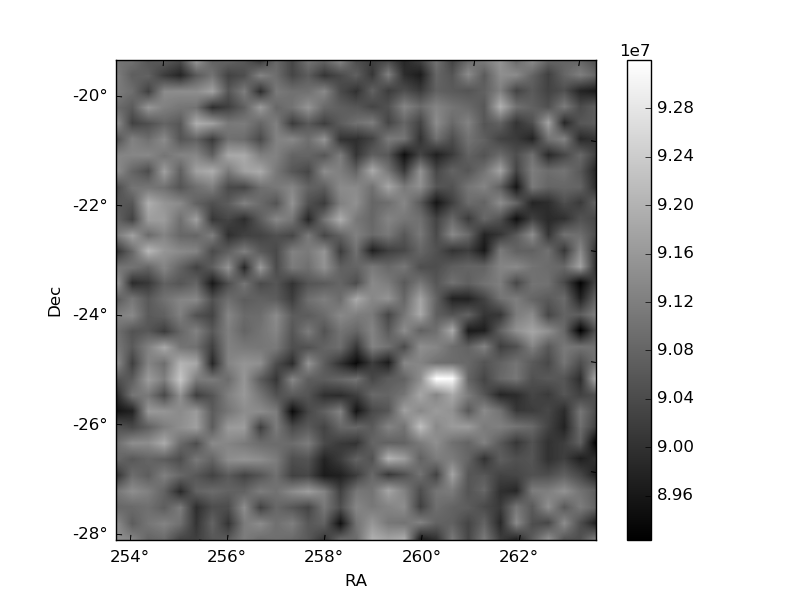
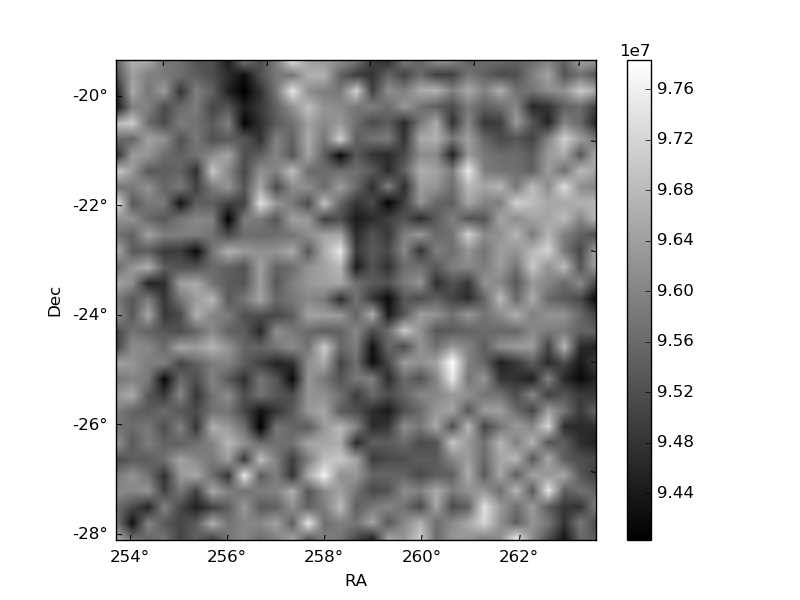
Histogram calculated using DETX and DETY for each event in the final _common_clean file
| Quadrant A |  |
 |
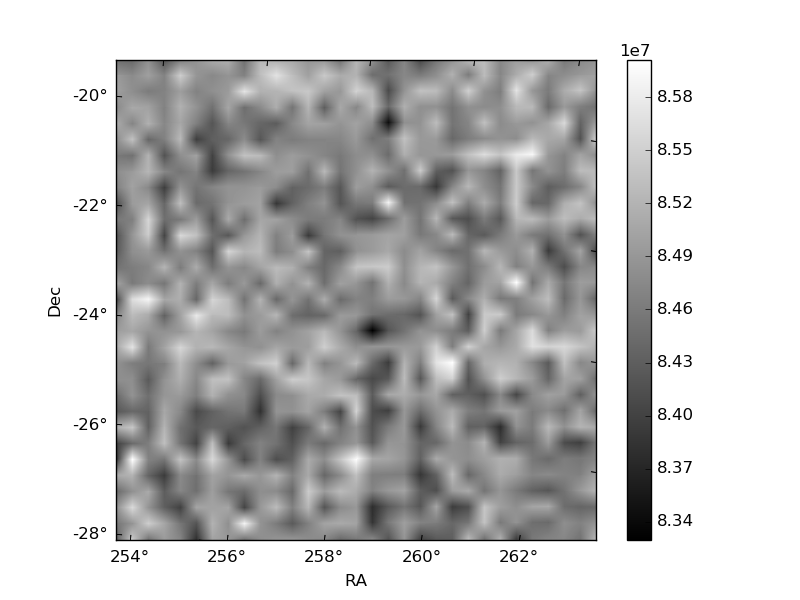
Quadrant B |
|---|---|---|---|
| Quadrant D | 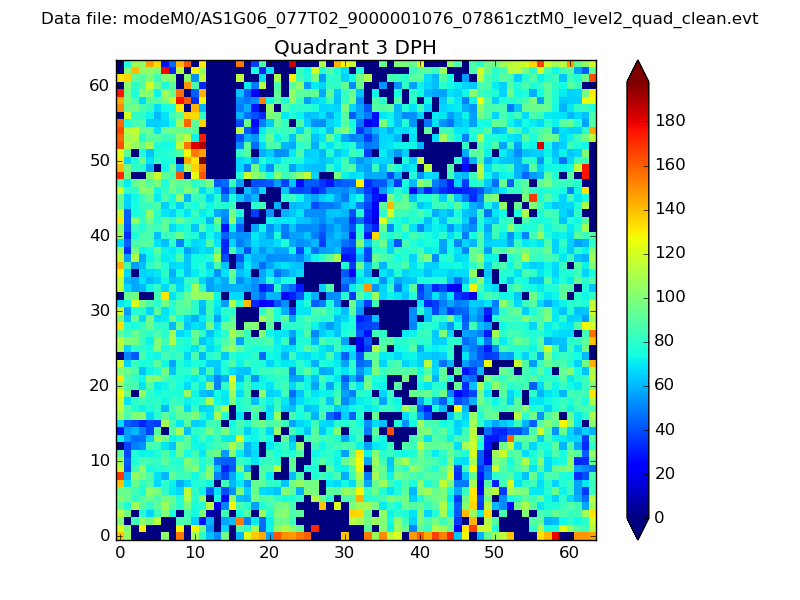 |
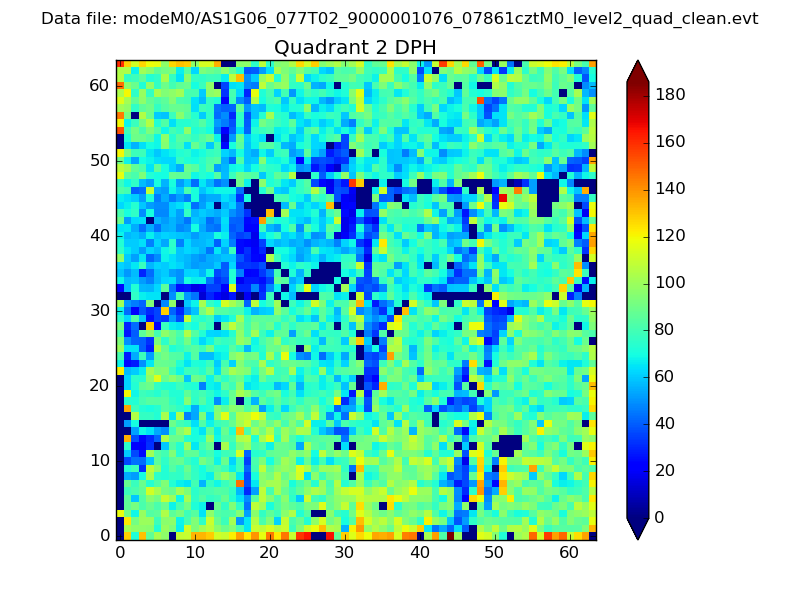 |
Quadrant C |
| Plot type | Count rate plots | Images |
|---|---|---|
| Comparison with Poisson distribution Blue bars denote a histogram of data divided into 1 sec bins. Red curve is a Poisson curve with rate = median count rate of data. |
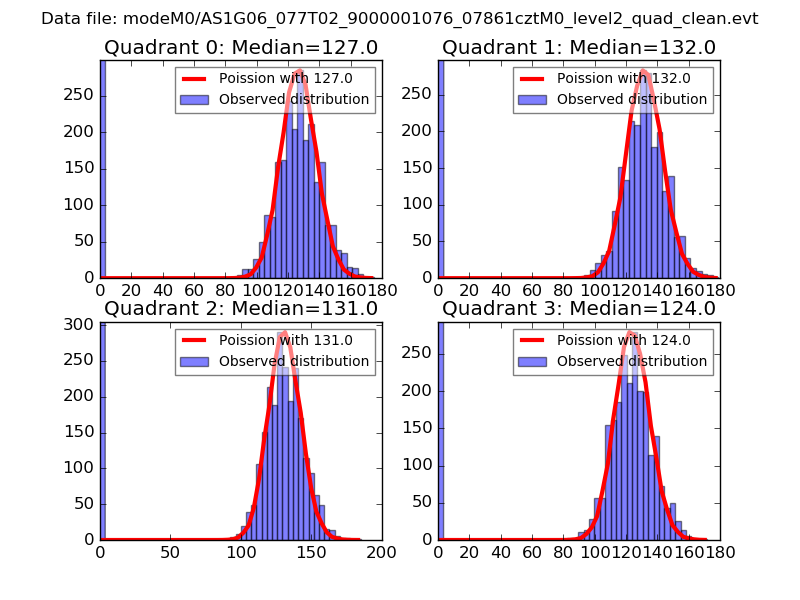 |
 |
| Quadrant-wise count rates Data is divided into 100 sec bins |
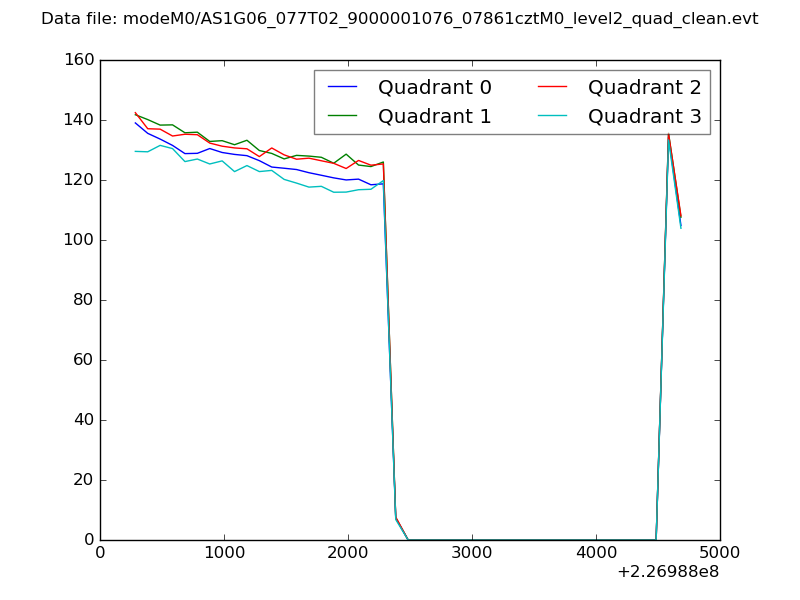 |
|
| Module-wise count rates for Quadrant A Data is divided into 100 sec bins |
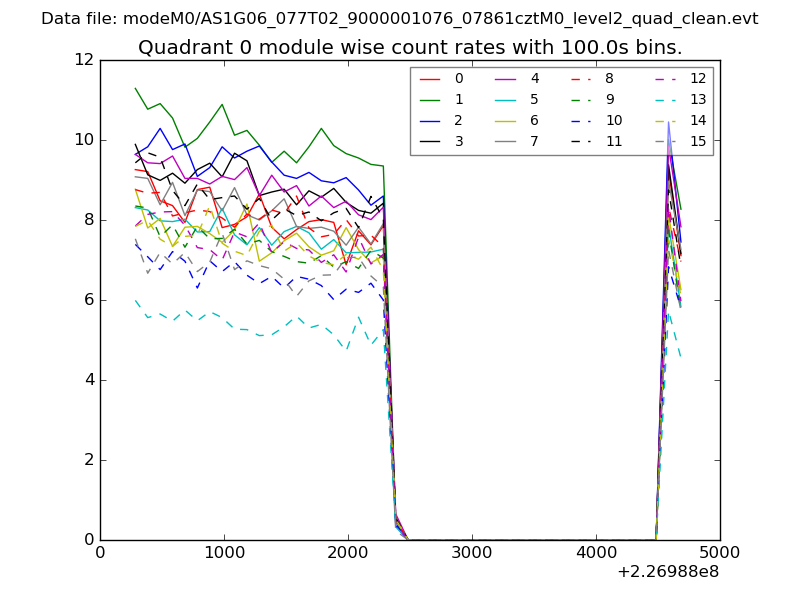 |
 |
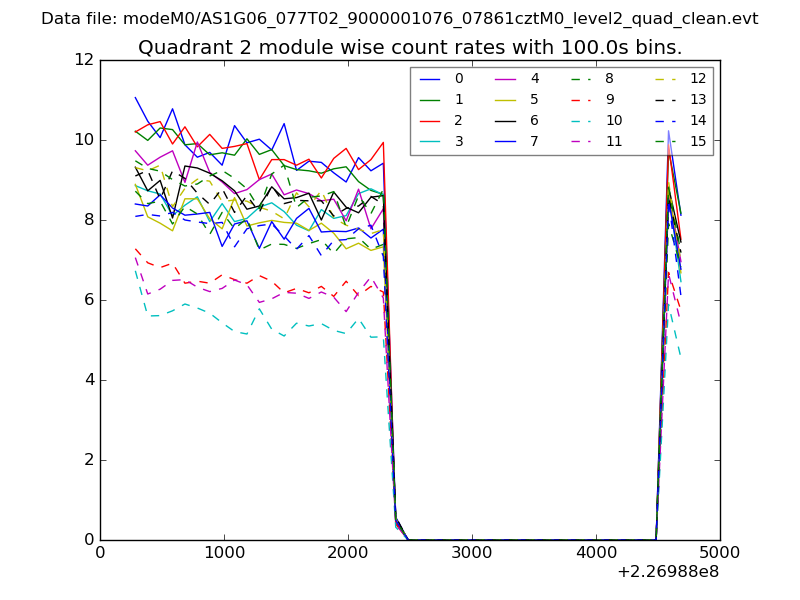
| Module-wise count rates for Quadrant B Data is divided into 100 sec bins |
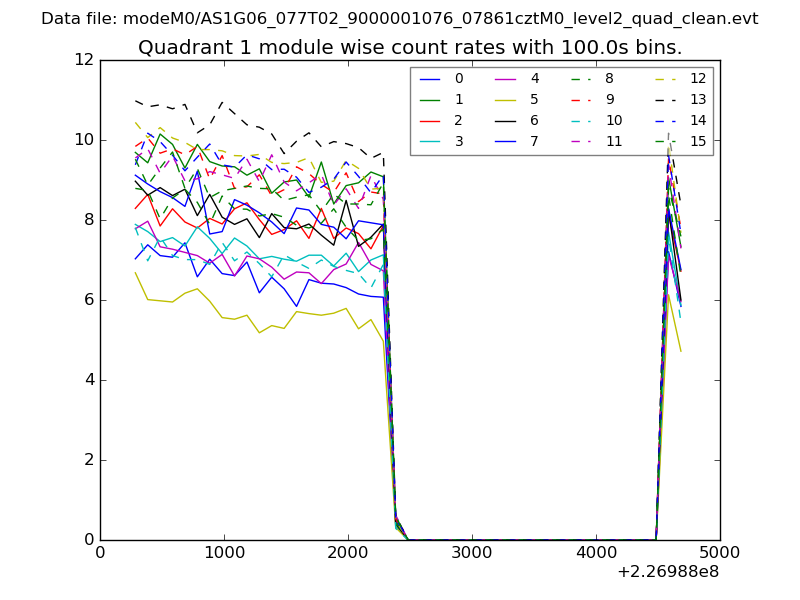 |
 |
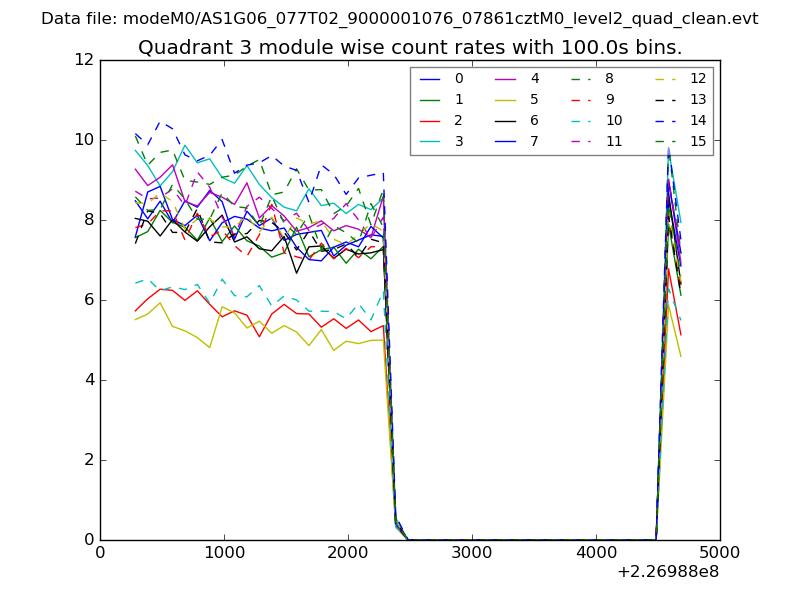
| Module-wise count rates for Quadrant C Data is divided into 100 sec bins |
 |
 |
| Module-wise count rates for Quadrant D Data is divided into 100 sec bins |
 |
 |
| Parameter | Plot |
|---|---|
| CZT HV Monitor | 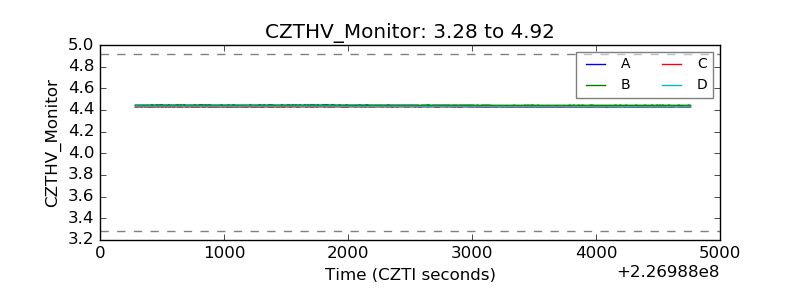 |
| D_VDD | 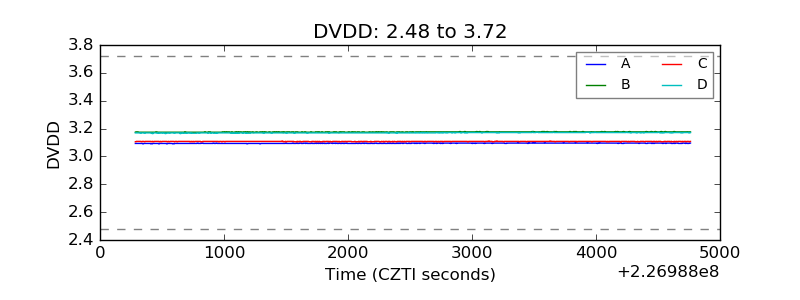 |
| Temperature 1 | 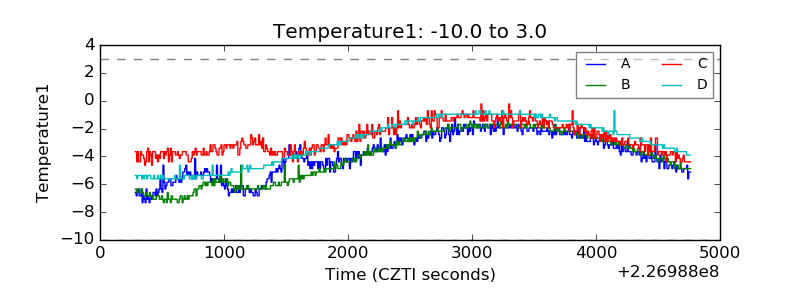 |
| Veto HV Monitor | 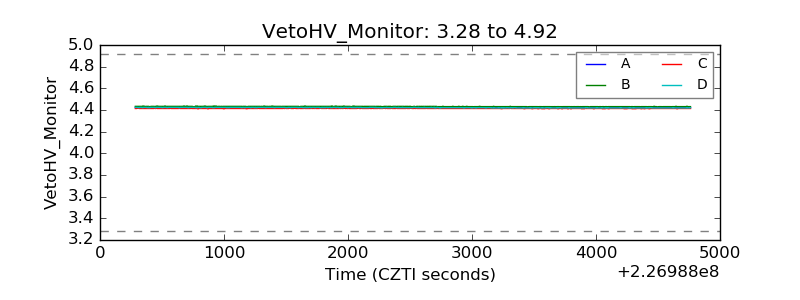 |
| Veto LLD | 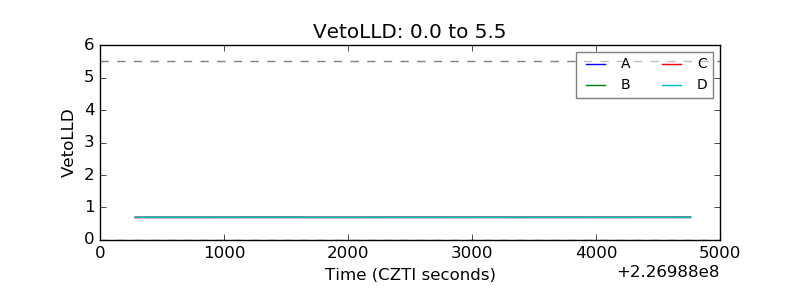 |
| Alpha Counter | 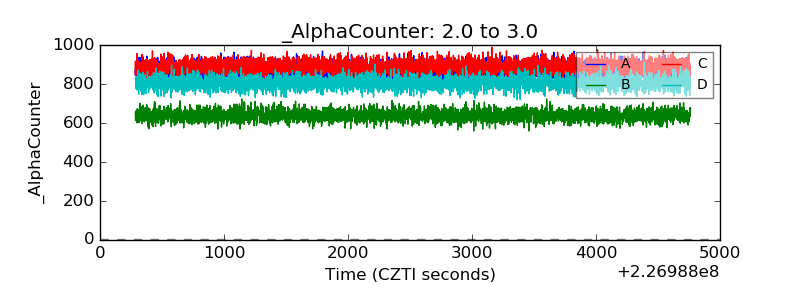 |
| _CPM_Rate | 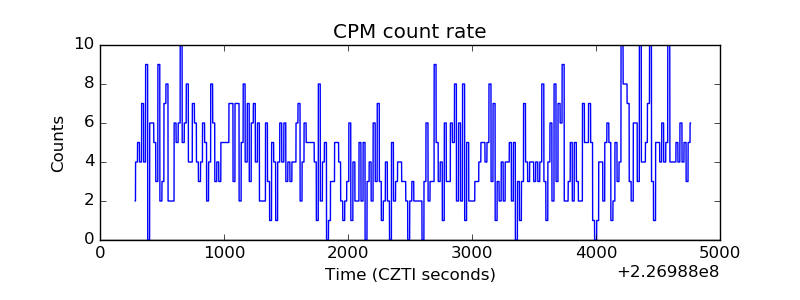 |
| CZT Counter | 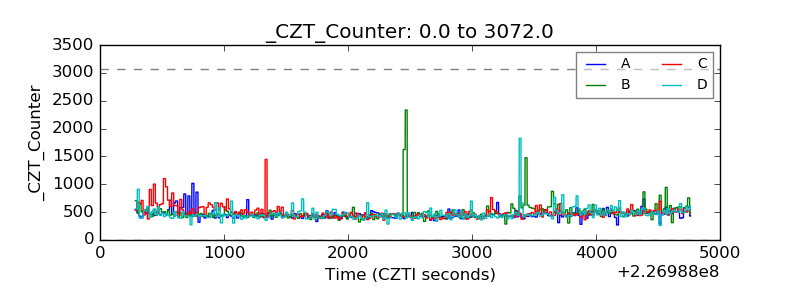 |
| +2.5 Volts monitor |  |
| +5 Volts monitor |  |
| _ROLL_ROT | 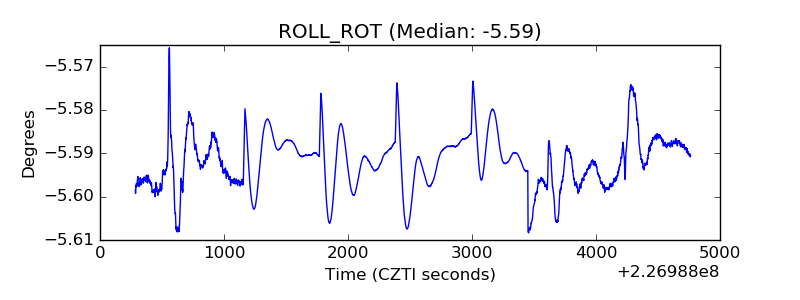 |
| _Roll_DEC | 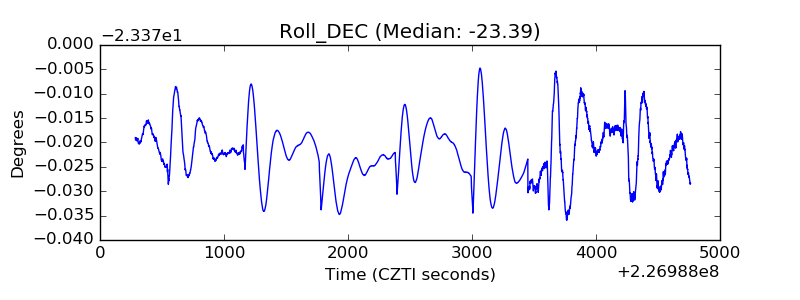 |
| _Roll_RA | 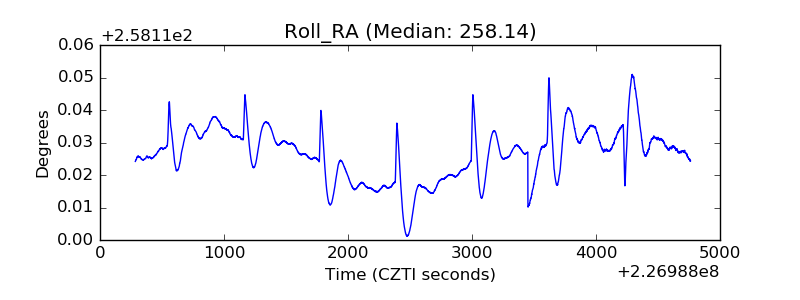 |
| Veto Counter | 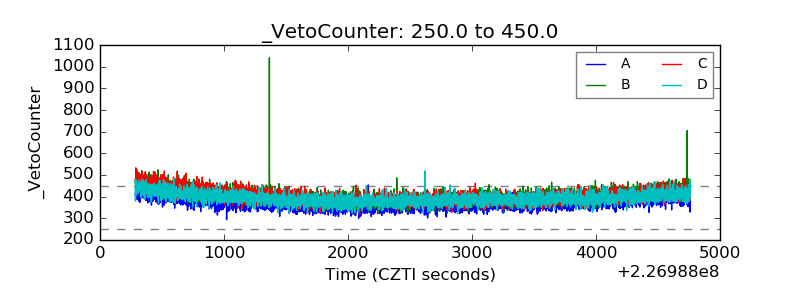 |