| Param | Original file | Final file |
|---|---|---|
| Filename | modeM0/AS1G06_077T02_9000001076_07862cztM0_level2.evt | modeM0/AS1G06_077T02_9000001076_07862cztM0_level2_quad_clean.evt |
| Size (bytes) | 263,730,240 | 58,806,720 |
| Size | 251.5 MB | 56.1 MB |
| Events in quadrant A | 1,712,255 | 385,351 |
| Events in quadrant B | 1,969,351 | 388,436 |
| Events in quadrant C | 1,808,481 | 391,005 |
| Events in quadrant D | 2,253,436 | 363,975 |
| Mode M9 | |||
|---|---|---|---|
| Quadrant | BADHDUFLAG | Total packets | Discarded packets |
| A | 0 | 7 | 0 |
| B | 0 | 7 | 0 |
| C | 0 | 7 | 0 |
| D | 0 | 8 | 1 |
| Mode M0 | |||
|---|---|---|---|
| Quadrant | BADHDUFLAG | Total packets | Discarded packets |
| A | 0 | 8962 | 1569 |
| B | 0 | 9782 | 1717 |
| C | 0 | 9247 | 1640 |
| D | 0 | 10754 | 1676 |
| Mode SS | |||
|---|---|---|---|
| Quadrant | BADHDUFLAG | Total packets | Discarded packets |
| A | 0 | 88 | 12 |
| B | 0 | 88 | 14 |
| C | 0 | 88 | 12 |
| D | 0 | 88 | 14 |
| Quadrant | Total seconds | Saturated seconds | Saturation percentage |
|---|---|---|---|
| A | 3551 | 86 | 2.421853% |
| B | 3534 | 139 | 3.933220% |
| C | 3555 | 82 | 2.306610% |
| D | 3549 | 141 | 3.972950% |
Noise dominated data is calculated using 1-second bins in cleaned event files. If a bin has >2000 counts, and if more than 50% of those come from <1% of pixels, then it is considered to be noise-dominated and hence unusable.
| Quadrant | # 1 sec bins | Bins with >0 counts | Bins with >2000 counts | High rate bins dominated by noise | Noise dominated (total time) | Noise dominated (detector-on time) | Marked lightcurve |
|---|---|---|---|---|---|---|---|
| A | 4858 | 3729 | 0 | 0 | 0.00% | 0.00% | 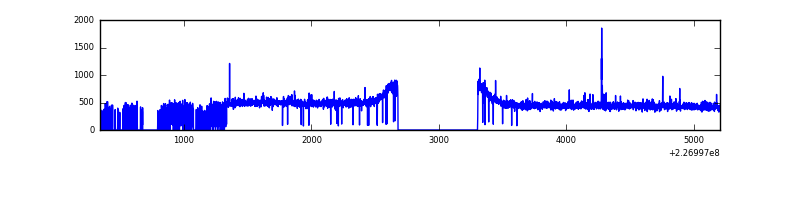 |
| B | 4862 | 3718 | 53 | 53 | 1.09% | 1.43% | 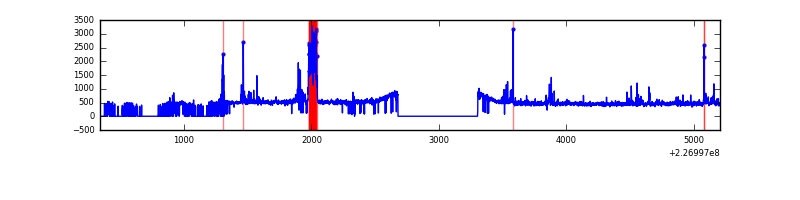 |
| C | 4854 | 3750 | 0 | 0 | 0.00% | 0.00% | 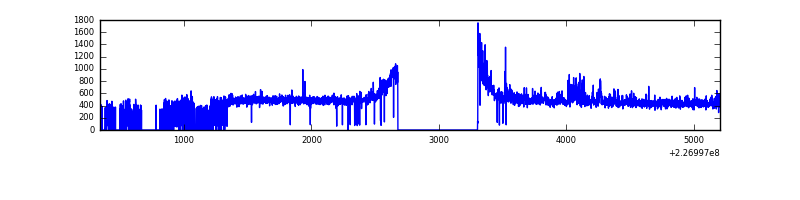 |
| D | 4855 | 3745 | 25 | 25 | 0.51% | 0.67% | 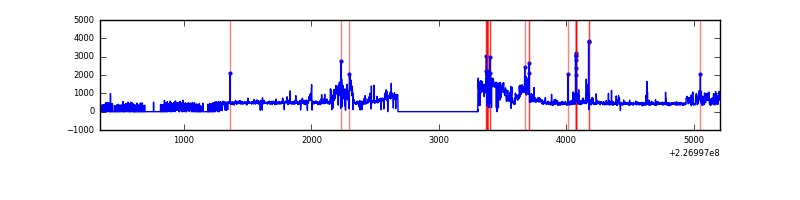 |
Top three noisy pixels from each quadrant. If the there are fewer than three noisy pixels in the level2.evt file, extra rows are filled as -1
| Pixel properties | Quadrant properties | ||||||
|---|---|---|---|---|---|---|---|
| Quadrant | DetID | PixID | Counts | Sigma | Mean | Median | Sigma |
| A | 15 | 234 | 9603 | 101.19 | 440 | 430 | 90.7 |
| A | 3 | 1 | 4706 | 47.17 | 440 | 430 | 90.7 |
| A | 0 | 226 | 4153 | 41.07 | 440 | 430 | 90.7 |
| B | 4 | 239 | 188586 | 2226.45 | 437 | 427 | 84.5 |
| B | 4 | 173 | 39913 | 467.23 | 437 | 427 | 84.5 |
| B | 15 | 204 | 20576 | 238.42 | 437 | 427 | 84.5 |
| C | 1 | 16 | 103993 | 1015.53 | 433 | 436 | 102.0 |
| C | 8 | 229 | 9862 | 92.44 | 433 | 436 | 102.0 |
| C | 13 | 61 | 3405 | 29.12 | 433 | 436 | 102.0 |
| D | 1 | 52 | 470398 | 4461.74 | 427 | 414 | 105.3 |
| D | 14 | 34 | 95522 | 902.9 | 427 | 414 | 105.3 |
| D | 2 | 152 | 46629 | 438.74 | 427 | 414 | 105.3 |
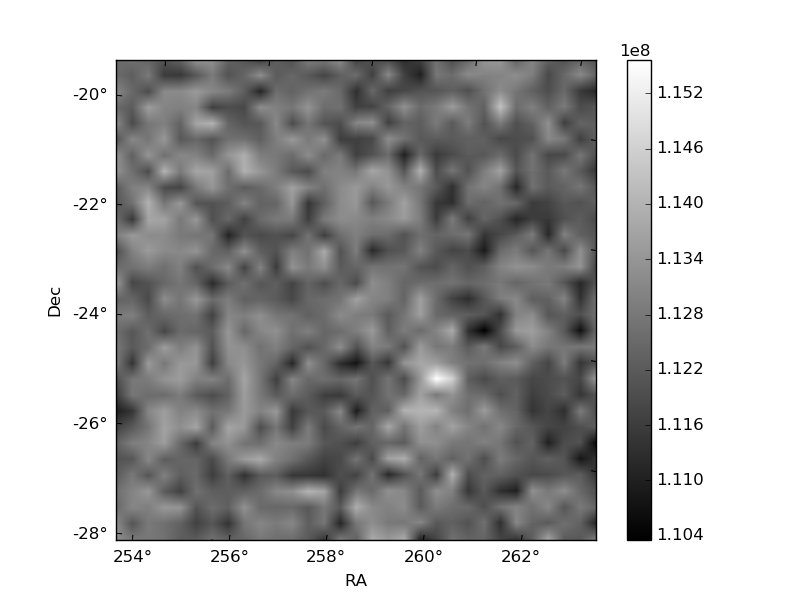
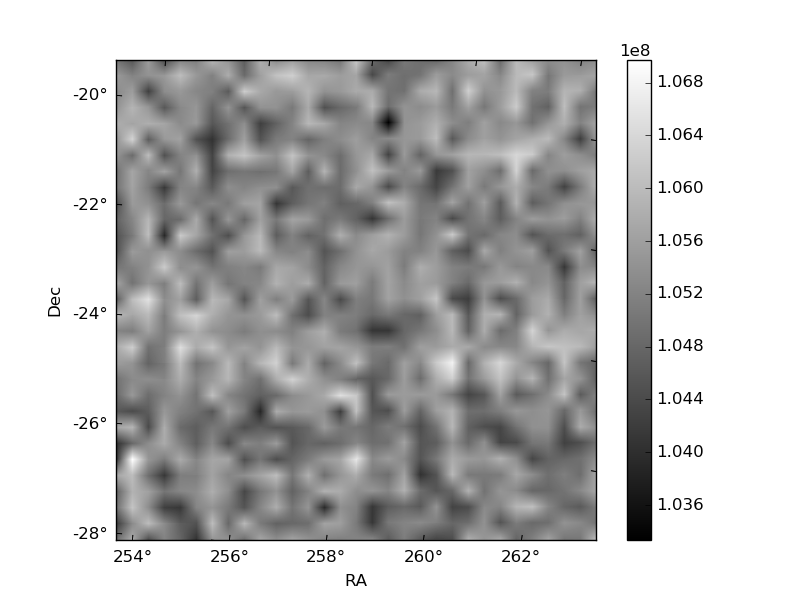
Histogram calculated using DETX and DETY for each event in the final _common_clean file
| Quadrant A | 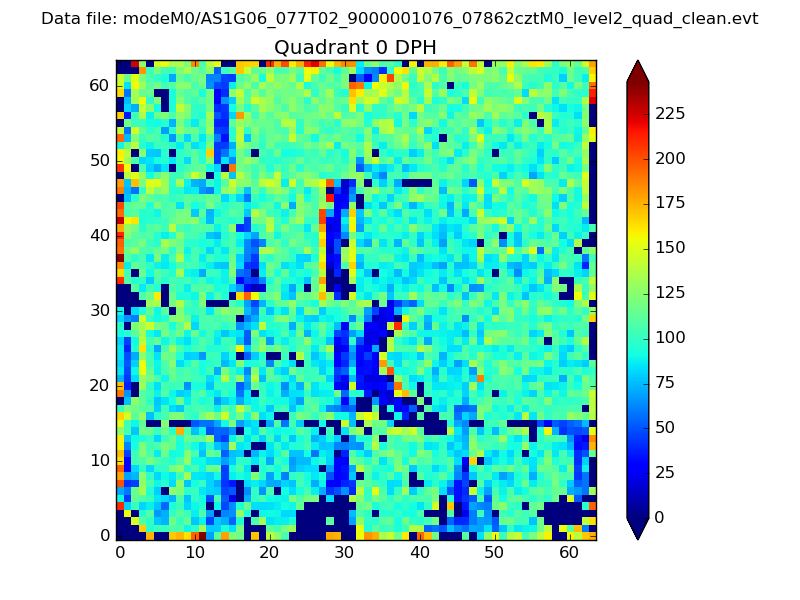 |
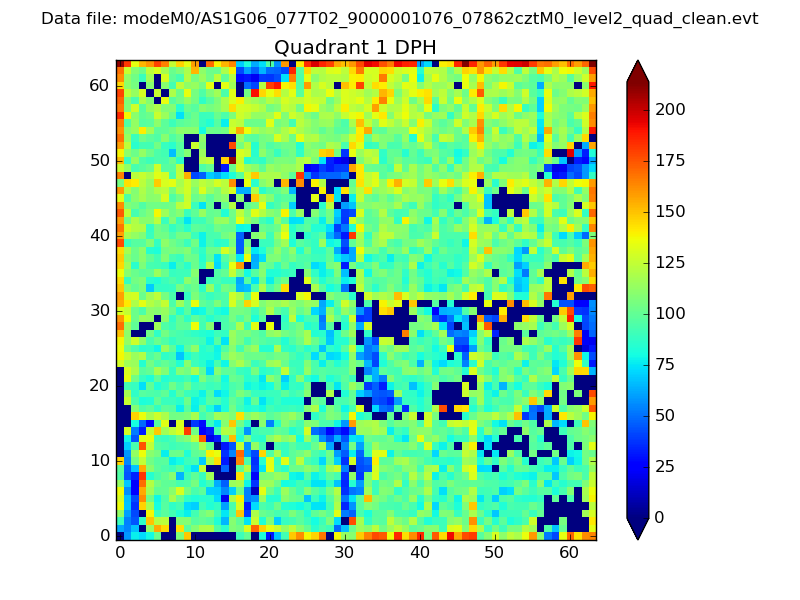 |
Quadrant B |
|---|---|---|---|
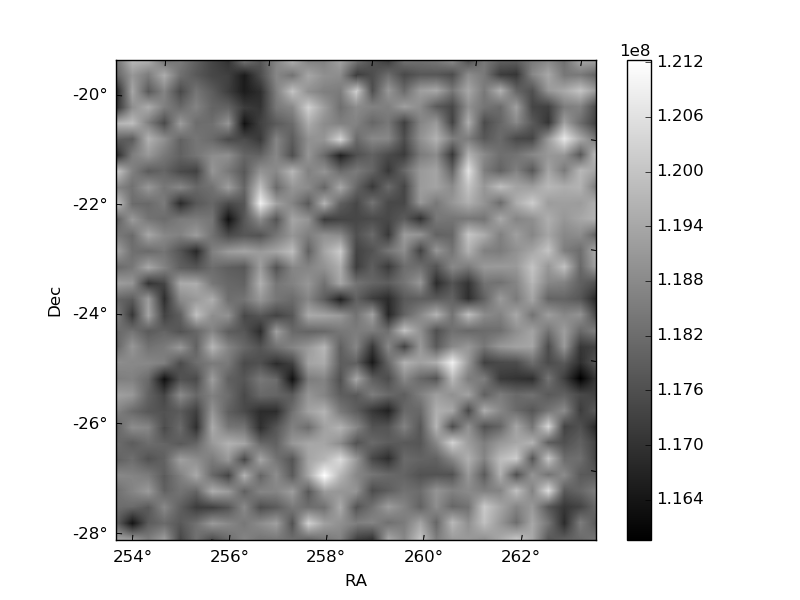
| Quadrant D | 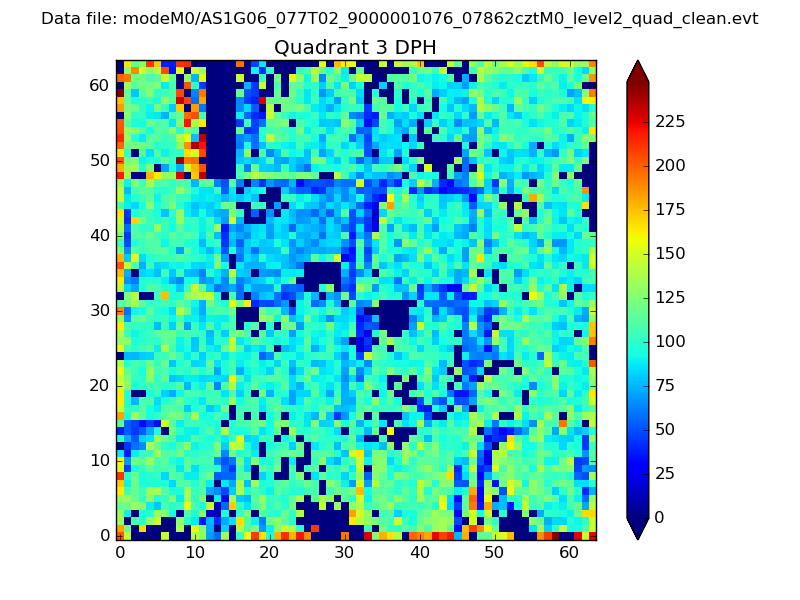 |
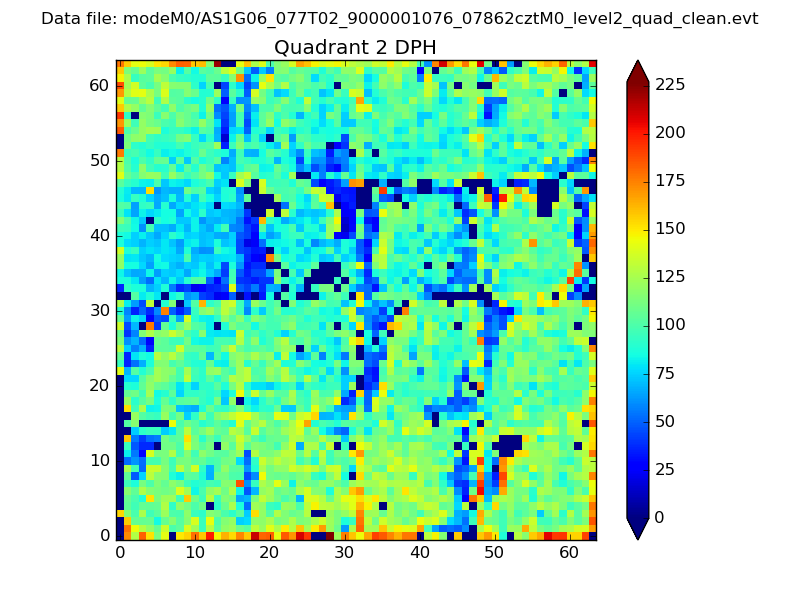 |
Quadrant C |
| Plot type | Count rate plots | Images |
|---|---|---|
| Comparison with Poisson distribution Blue bars denote a histogram of data divided into 1 sec bins. Red curve is a Poisson curve with rate = median count rate of data. |
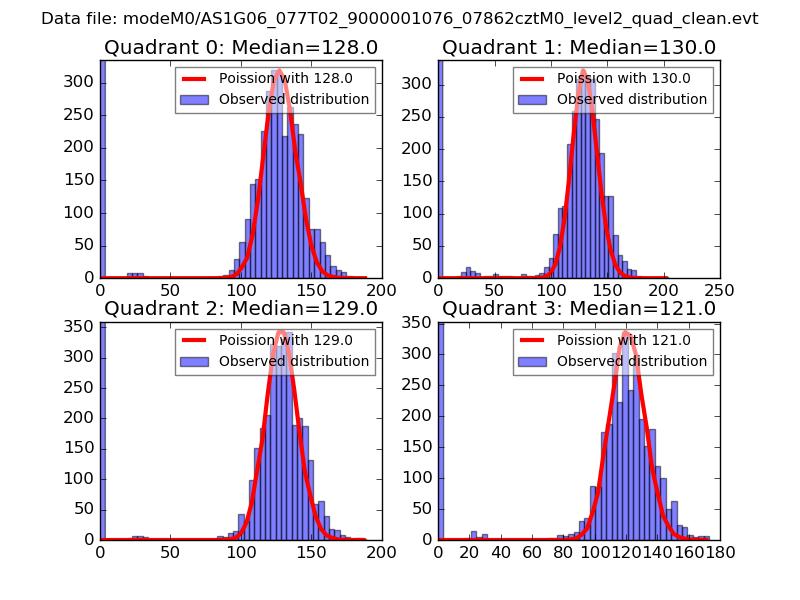 |
 |
| Quadrant-wise count rates Data is divided into 100 sec bins |
 |
|
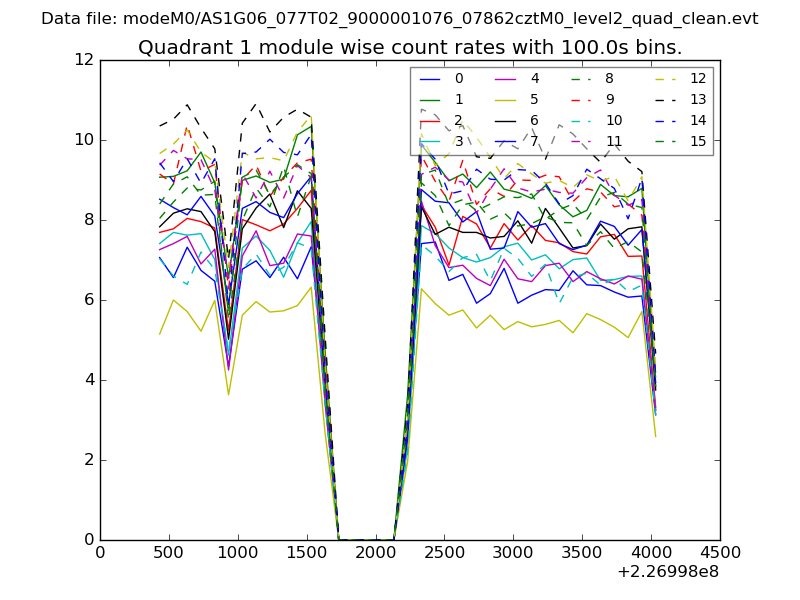
| Module-wise count rates for Quadrant A Data is divided into 100 sec bins |
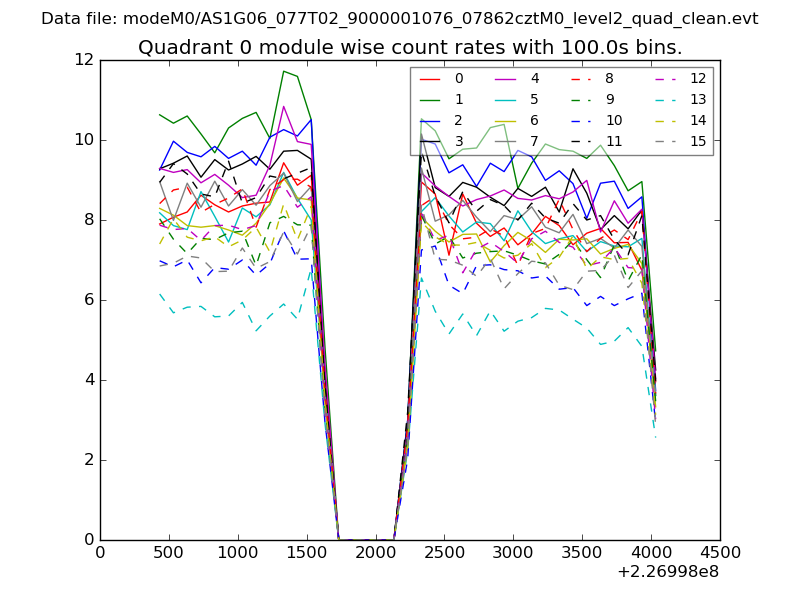 |
 |
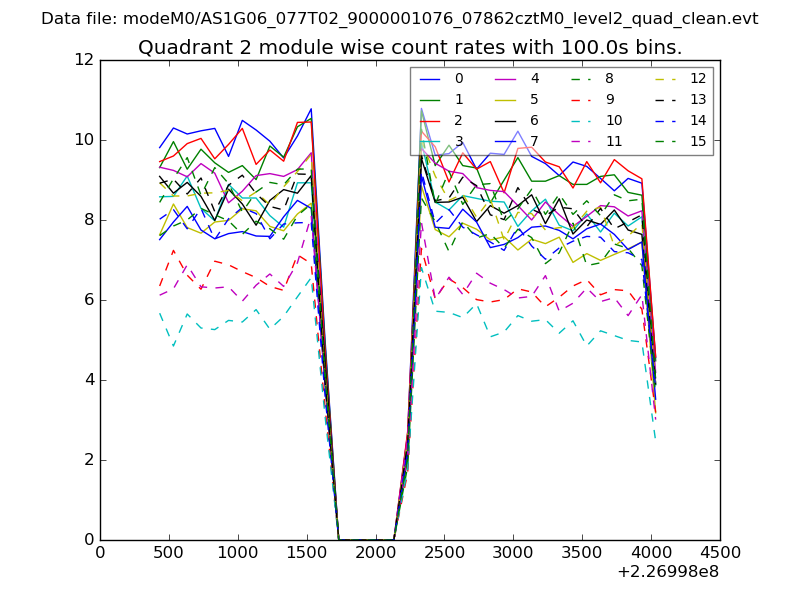
| Module-wise count rates for Quadrant B Data is divided into 100 sec bins |
 |
 |
| Module-wise count rates for Quadrant C Data is divided into 100 sec bins |
 |
 |
| Module-wise count rates for Quadrant D Data is divided into 100 sec bins |
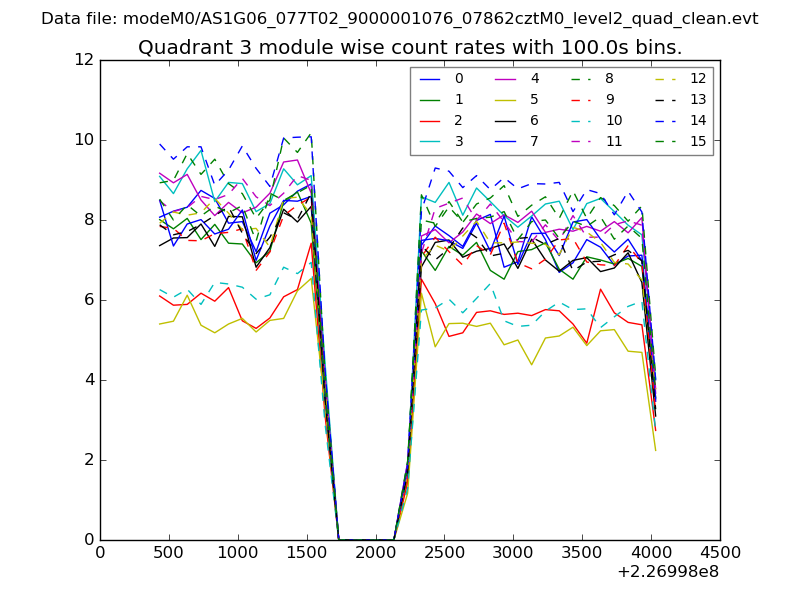 |
 |
| Parameter | Plot |
|---|---|
| CZT HV Monitor | 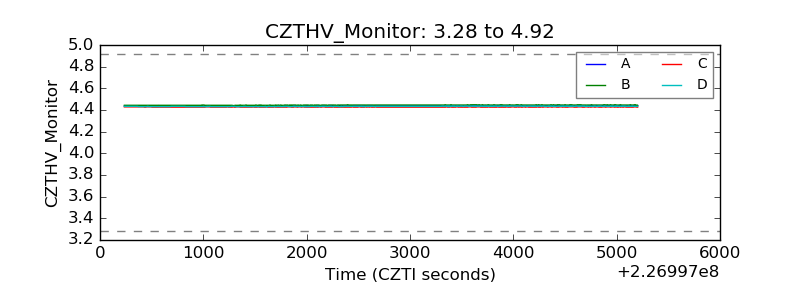 |
| D_VDD | 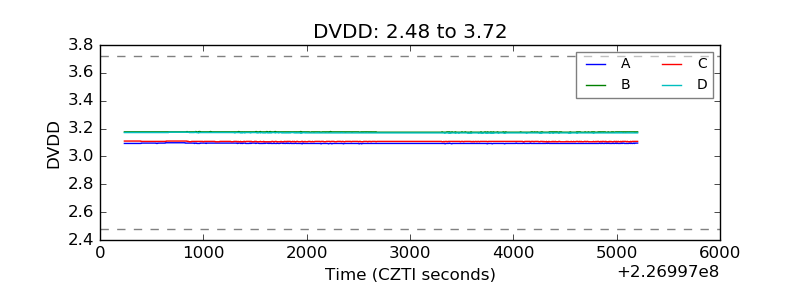 |
| Temperature 1 | 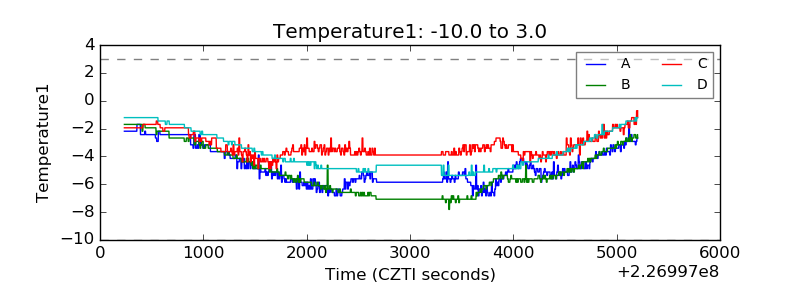 |
| Veto HV Monitor | 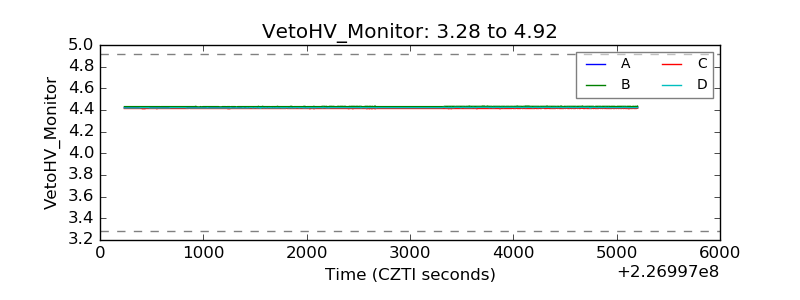 |
| Veto LLD | 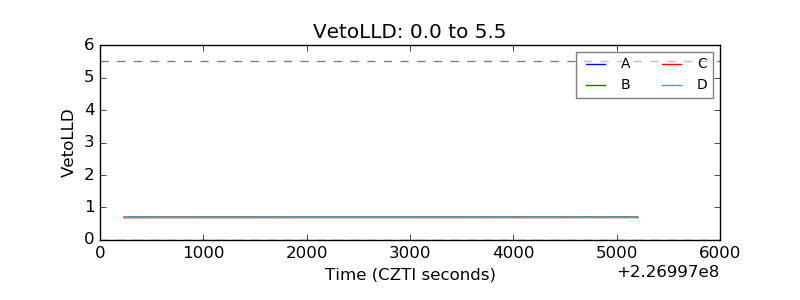 |
| Alpha Counter | 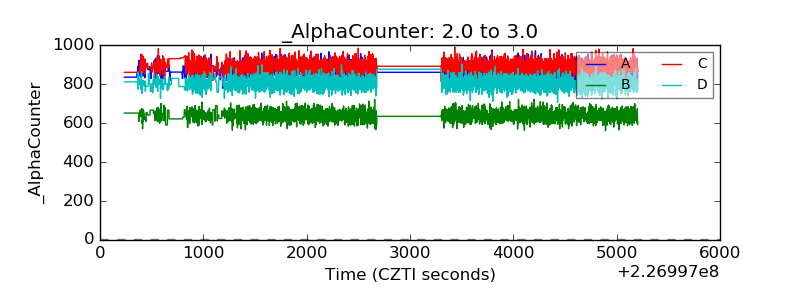 |
| _CPM_Rate | 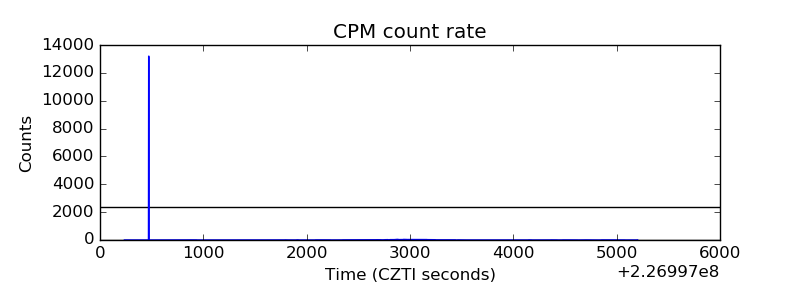 |
| CZT Counter | 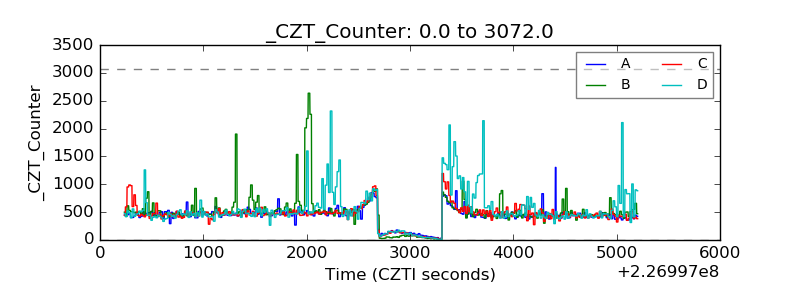 |
| +2.5 Volts monitor |  |
| +5 Volts monitor |  |
| _ROLL_ROT | 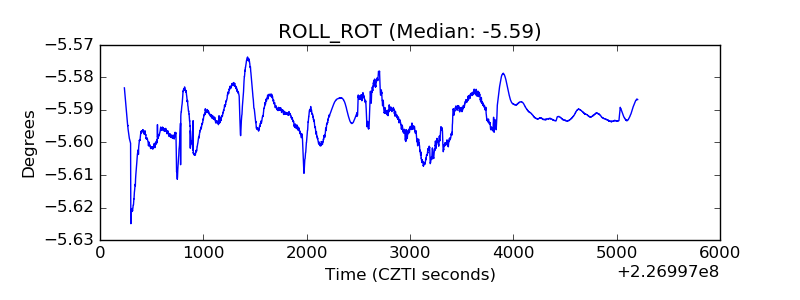 |
| _Roll_DEC | 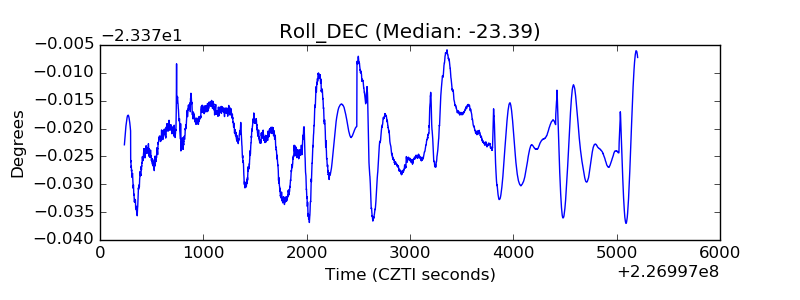 |
| _Roll_RA | 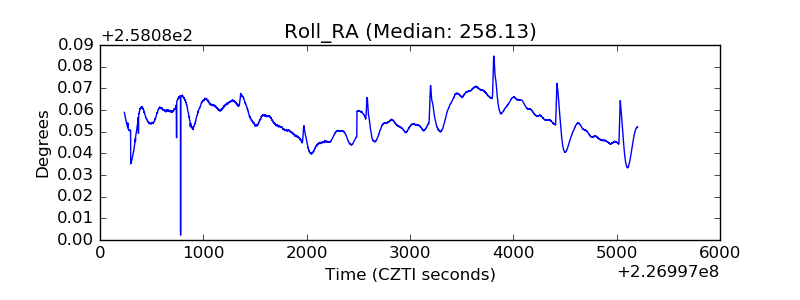 |
| Veto Counter | 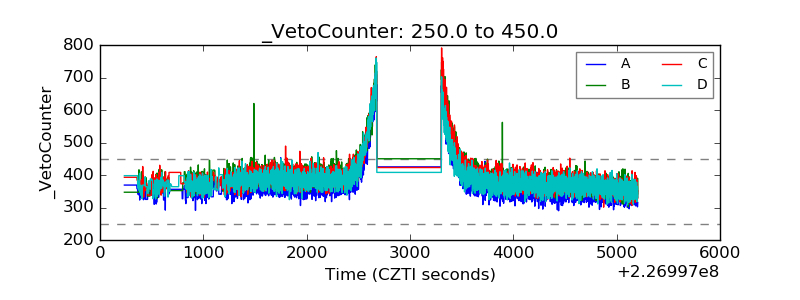 |