| Param | Original file | Final file |
|---|---|---|
| Filename | modeM0/AS1G06_077T02_9000001076_07863cztM0_level2.evt | modeM0/AS1G06_077T02_9000001076_07863cztM0_level2_quad_clean.evt |
| Size (bytes) | 246,035,520 | 49,063,680 |
| Size | 234.6 MB | 46.8 MB |
| Events in quadrant A | 1,819,475 | 311,602 |
| Events in quadrant B | 1,883,504 | 322,609 |
| Events in quadrant C | 1,944,990 | 320,813 |
| Events in quadrant D | 1,587,868 | 306,820 |
| Mode M0 | |||
|---|---|---|---|
| Quadrant | BADHDUFLAG | Total packets | Discarded packets |
| A | 0 | 7896 | 354 |
| B | 0 | 7958 | 318 |
| C | 0 | 8130 | 305 |
| D | 0 | 7117 | 286 |
| Mode SS | |||
|---|---|---|---|
| Quadrant | BADHDUFLAG | Total packets | Discarded packets |
| A | 0 | 66 | 4 |
| B | 0 | 66 | 4 |
| C | 0 | 66 | 4 |
| D | 0 | 66 | 0 |
| Quadrant | Total seconds | Saturated seconds | Saturation percentage |
|---|---|---|---|
| A | 3128 | 252 | 8.056266% |
| B | 3143 | 282 | 8.972319% |
| C | 3145 | 214 | 6.804452% |
| D | 3139 | 182 | 5.798025% |
Noise dominated data is calculated using 1-second bins in cleaned event files. If a bin has >2000 counts, and if more than 50% of those come from <1% of pixels, then it is considered to be noise-dominated and hence unusable.
| Quadrant | # 1 sec bins | Bins with >0 counts | Bins with >2000 counts | High rate bins dominated by noise | Noise dominated (total time) | Noise dominated (detector-on time) | Marked lightcurve |
|---|---|---|---|---|---|---|---|
| A | 4165 | 3159 | 4 | 4 | 0.10% | 0.13% | 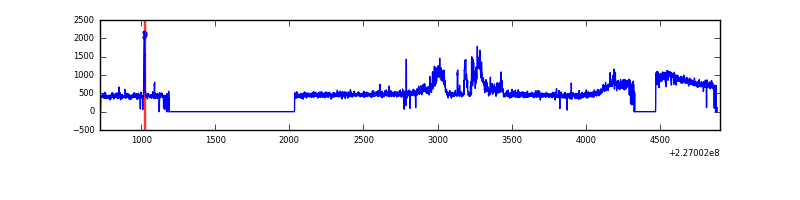 |
| B | 4170 | 3162 | 31 | 31 | 0.74% | 0.98% | 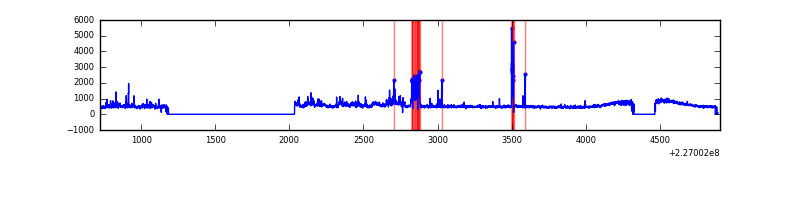 |
| C | 4181 | 3177 | 0 | 0 | 0.00% | 0.00% | 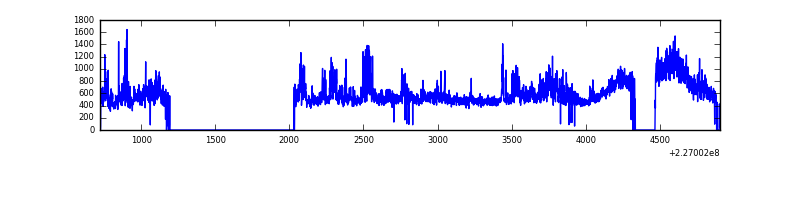 |
| D | 4182 | 3172 | 0 | 0 | 0.00% | 0.00% | 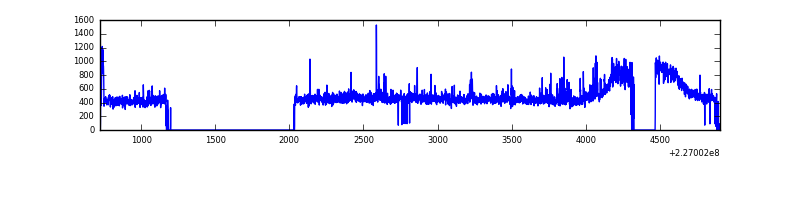 |
Top three noisy pixels from each quadrant. If the there are fewer than three noisy pixels in the level2.evt file, extra rows are filled as -1
| Pixel properties | Quadrant properties | ||||||
|---|---|---|---|---|---|---|---|
| Quadrant | DetID | PixID | Counts | Sigma | Mean | Median | Sigma |
| A | 15 | 234 | 262855 | 3184.38 | 398 | 388 | 82.4 |
| A | 15 | 174 | 16430 | 194.63 | 398 | 388 | 82.4 |
| A | 0 | 226 | 3767 | 41.0 | 398 | 388 | 82.4 |
| B | 4 | 239 | 98510 | 1222.84 | 405 | 394 | 80.2 |
| B | 0 | 219 | 62307 | 771.64 | 405 | 394 | 80.2 |
| B | 4 | 173 | 49976 | 617.95 | 405 | 394 | 80.2 |
| C | 1 | 16 | 378641 | 4038.96 | 397 | 398 | 93.6 |
| C | 8 | 229 | 9712 | 99.46 | 397 | 398 | 93.6 |
| C | 12 | 4 | 3353 | 31.55 | 397 | 398 | 93.6 |
| D | 2 | 152 | 46773 | 474.01 | 395 | 383 | 97.9 |
| D | 1 | 52 | 19902 | 199.44 | 395 | 383 | 97.9 |
| D | 2 | 234 | 11632 | 114.94 | 395 | 383 | 97.9 |
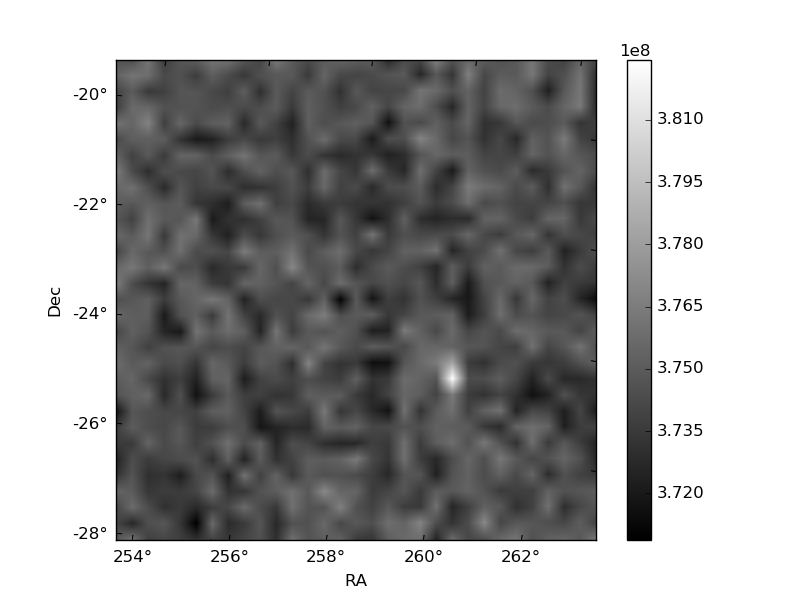
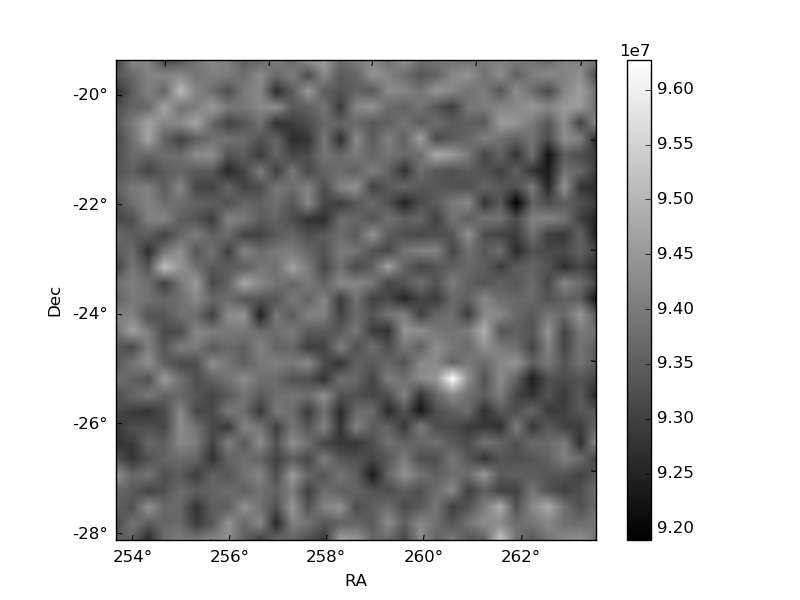
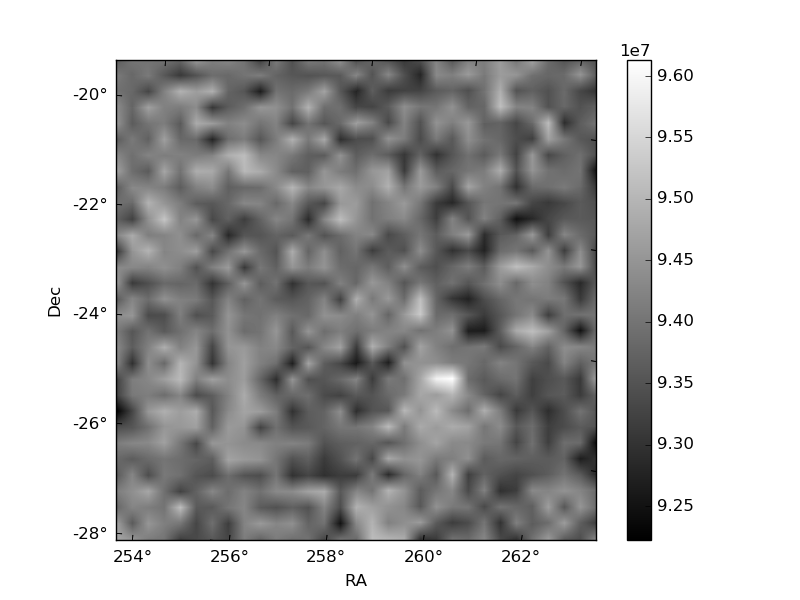
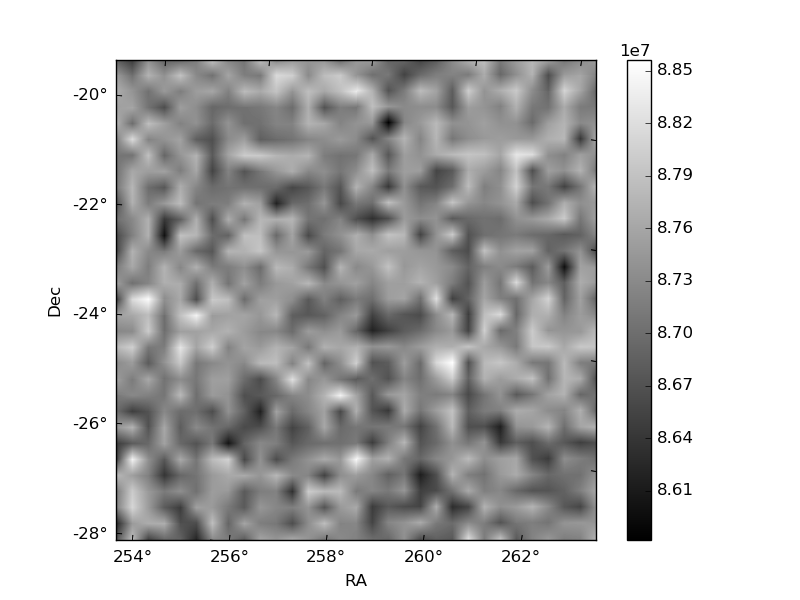
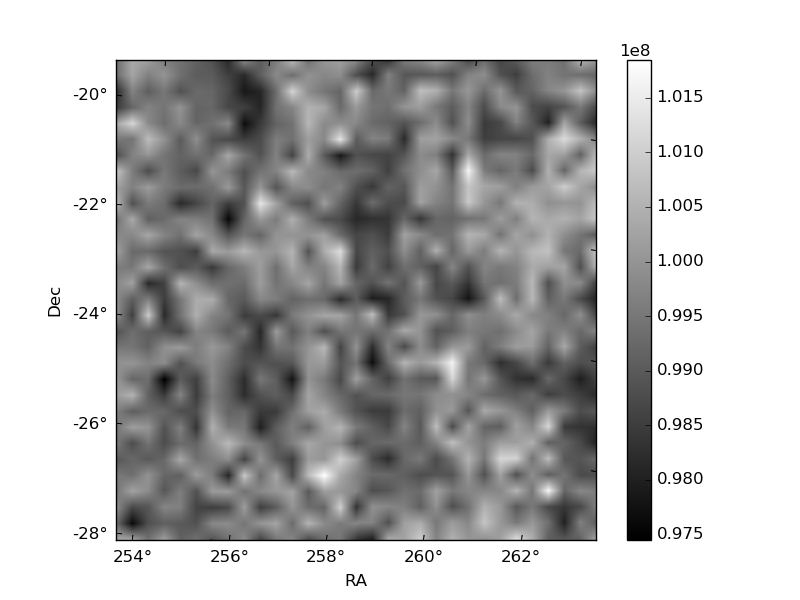
Histogram calculated using DETX and DETY for each event in the final _common_clean file
| Quadrant A | 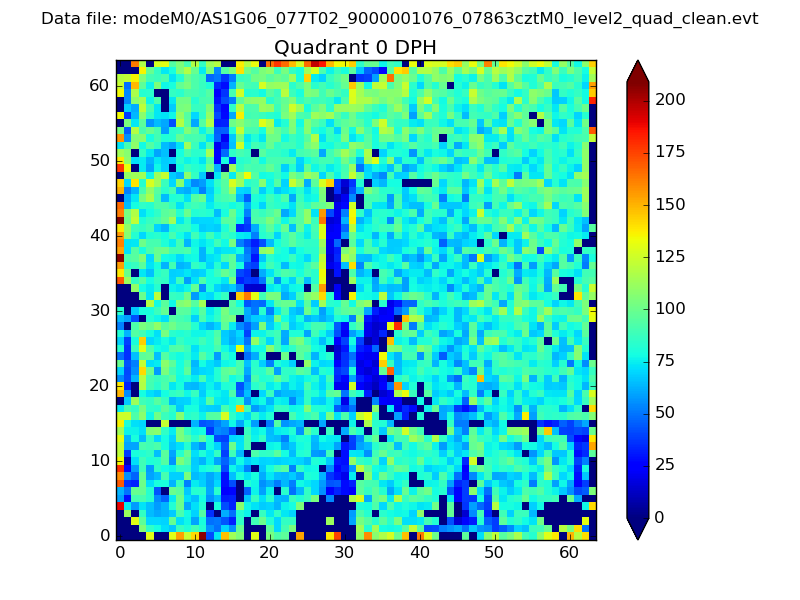 |
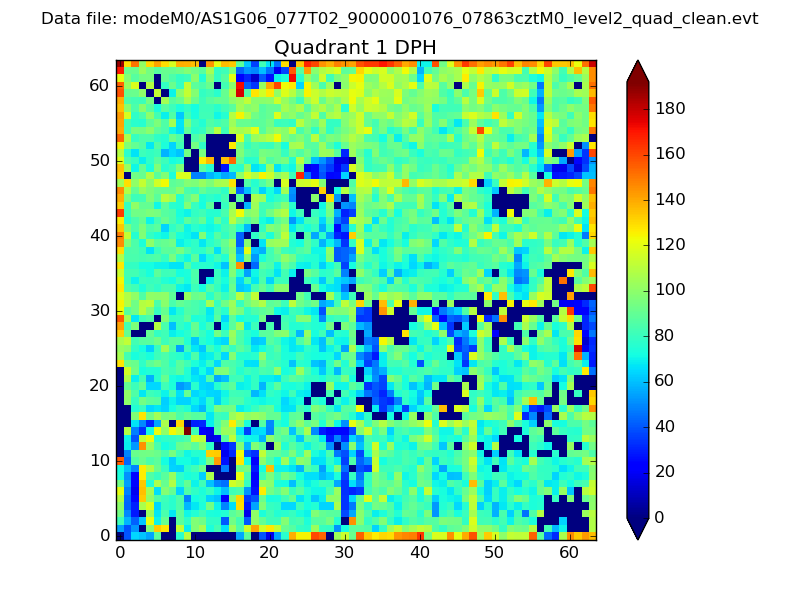 |
Quadrant B |
|---|---|---|---|
| Quadrant D | 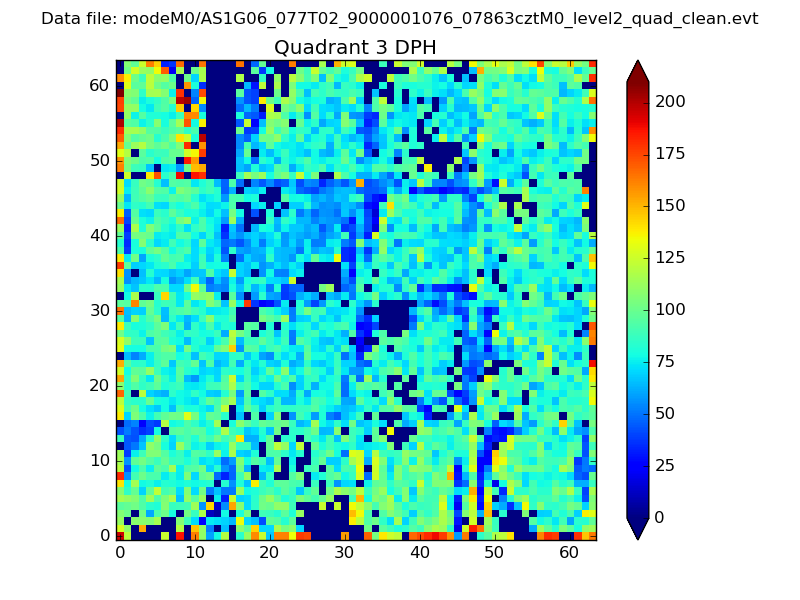 |
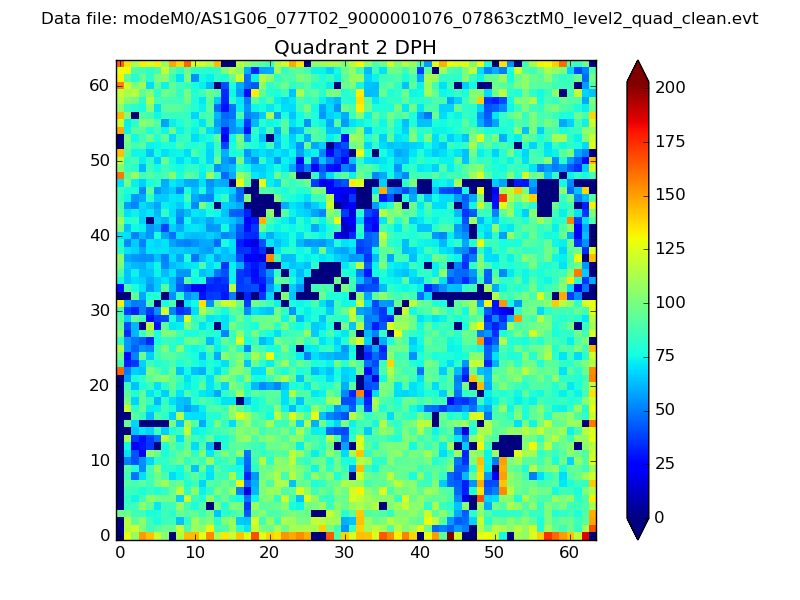 |
Quadrant C |
| Plot type | Count rate plots | Images |
|---|---|---|
| Comparison with Poisson distribution Blue bars denote a histogram of data divided into 1 sec bins. Red curve is a Poisson curve with rate = median count rate of data. |
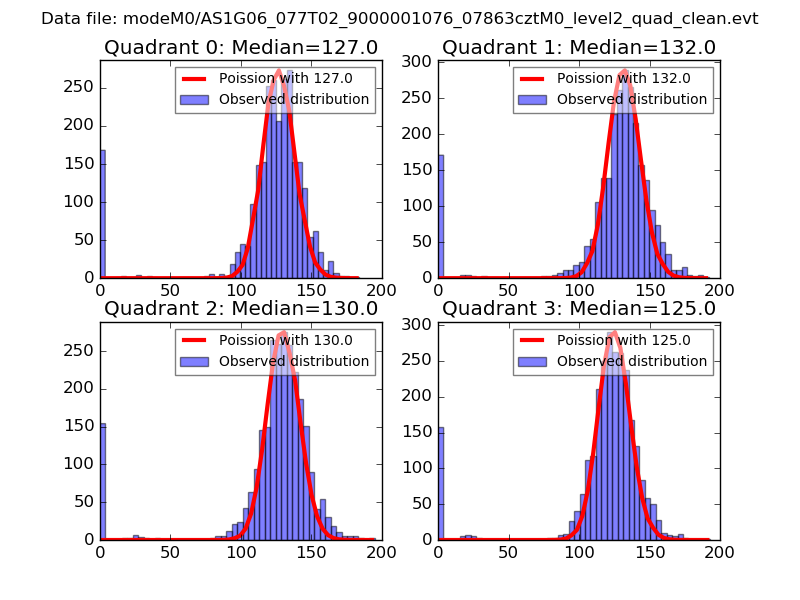 |
 |
| Quadrant-wise count rates Data is divided into 100 sec bins |
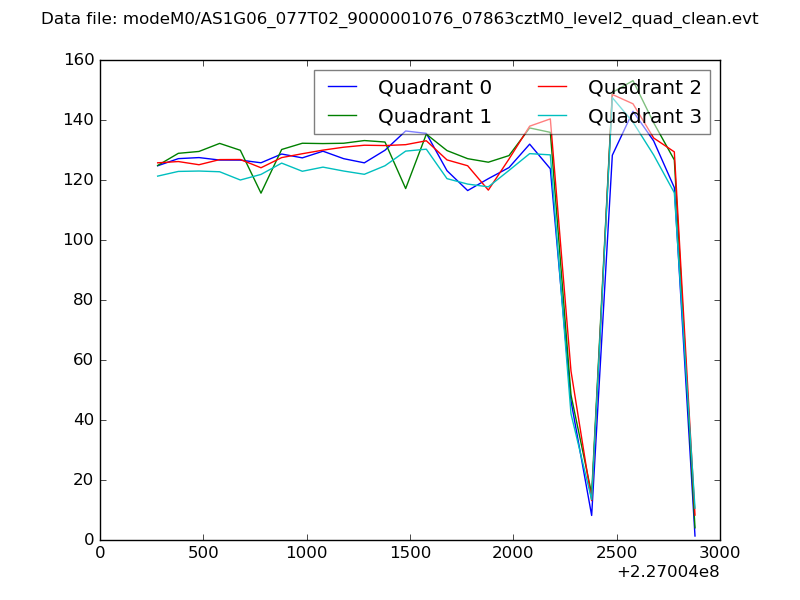 |
|
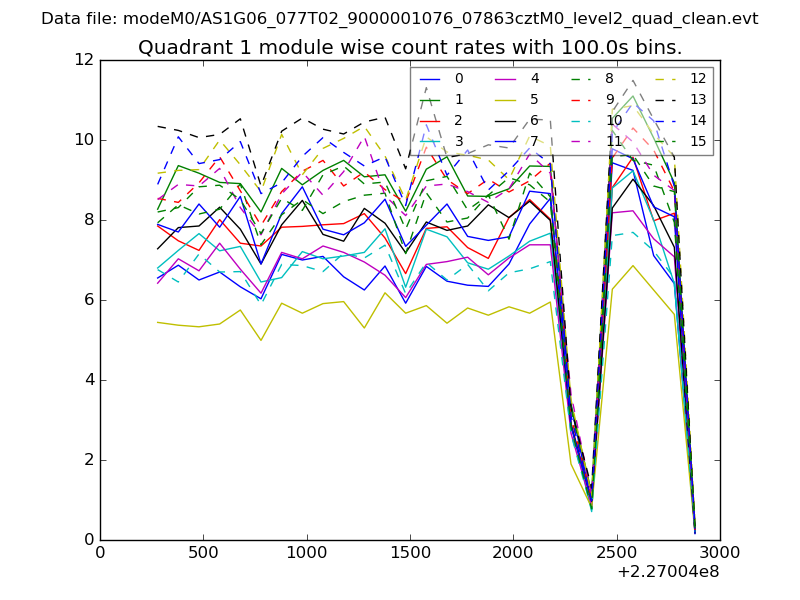
| Module-wise count rates for Quadrant A Data is divided into 100 sec bins |
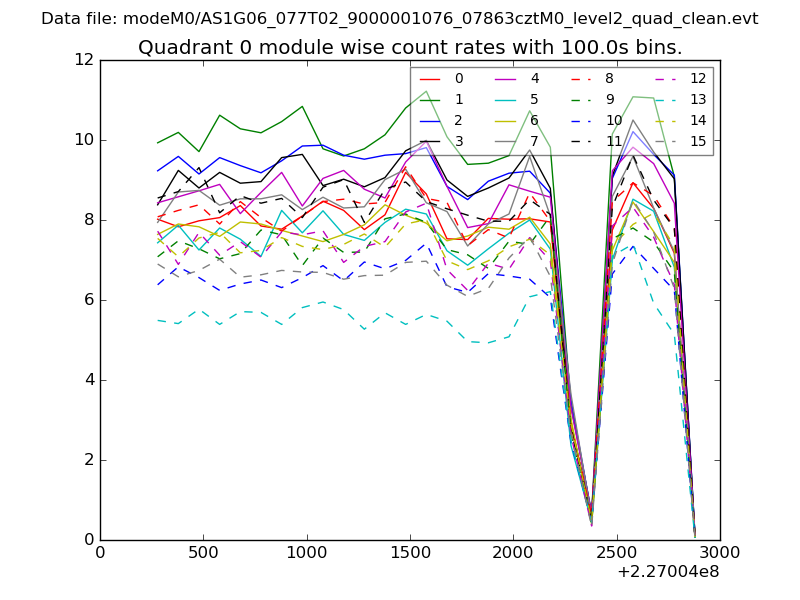 |
 |
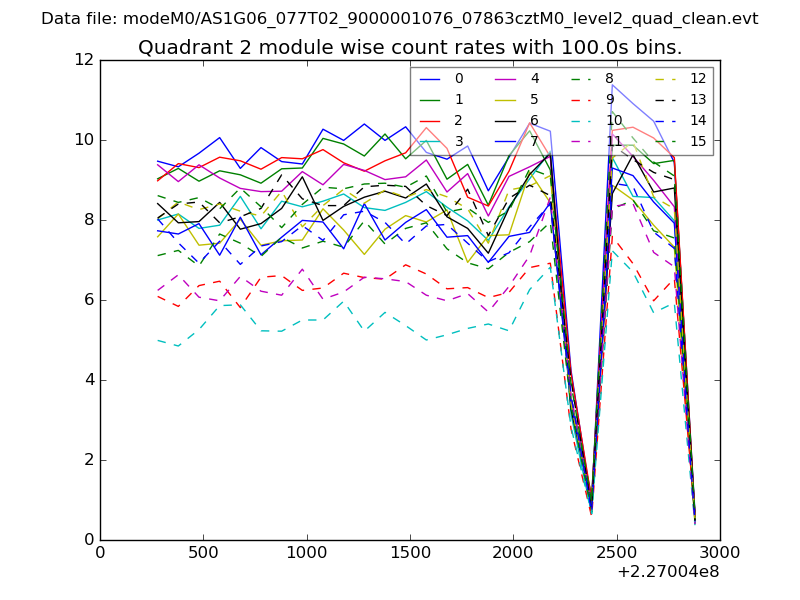
| Module-wise count rates for Quadrant B Data is divided into 100 sec bins |
 |
 |
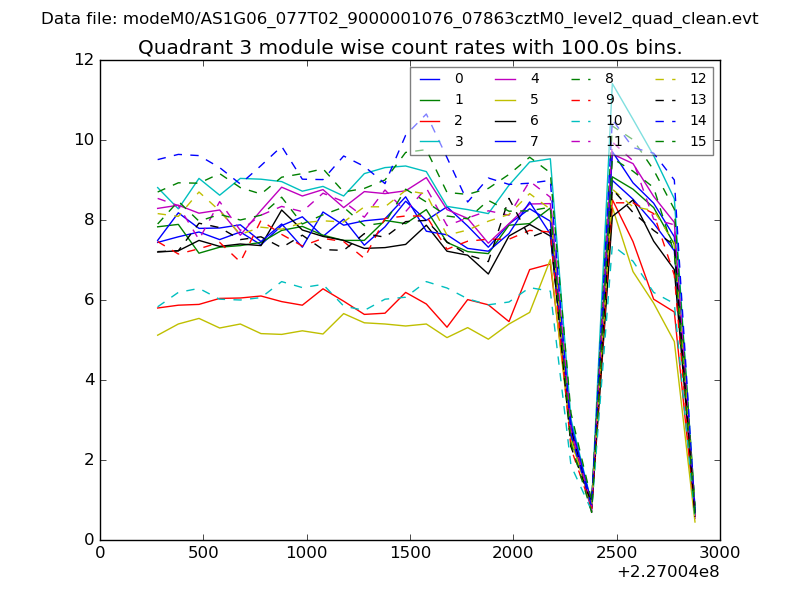
| Module-wise count rates for Quadrant C Data is divided into 100 sec bins |
 |
 |
| Module-wise count rates for Quadrant D Data is divided into 100 sec bins |
 |
 |
| Parameter | Plot |
|---|---|
| CZT HV Monitor |  |
| D_VDD | 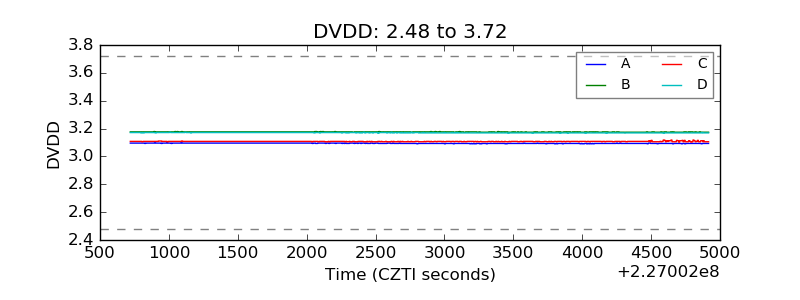 |
| Temperature 1 | 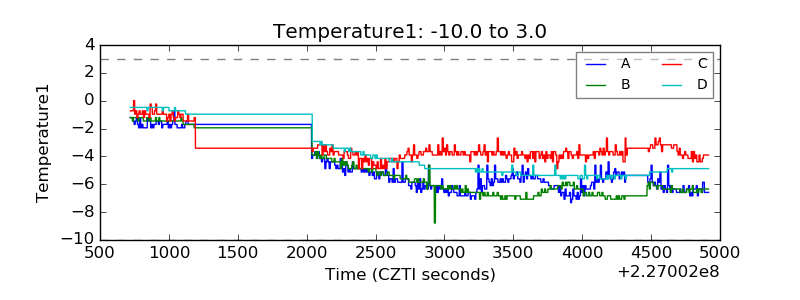 |
| Veto HV Monitor | 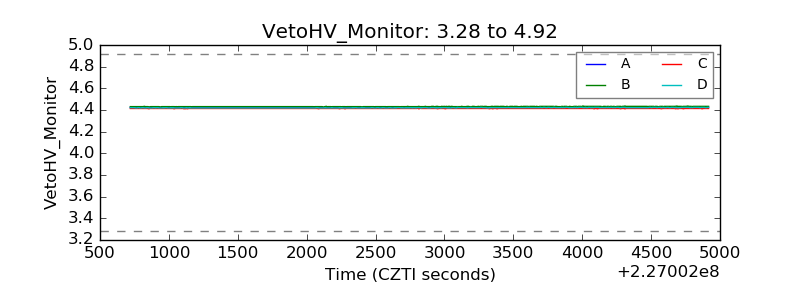 |
| Veto LLD | 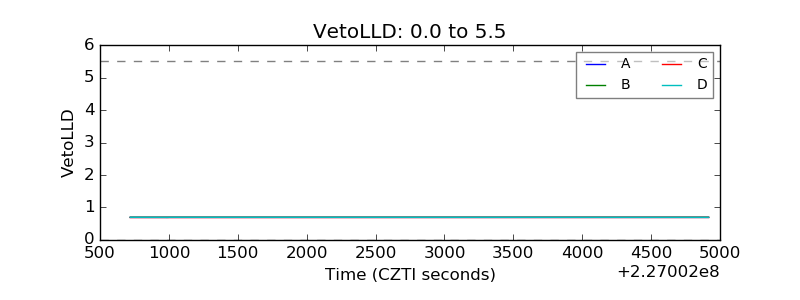 |
| Alpha Counter | 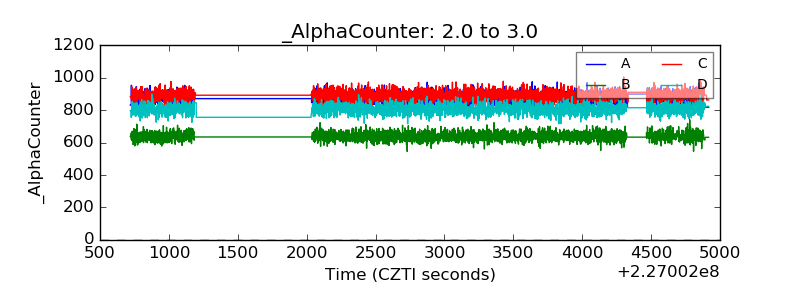 |
| _CPM_Rate | 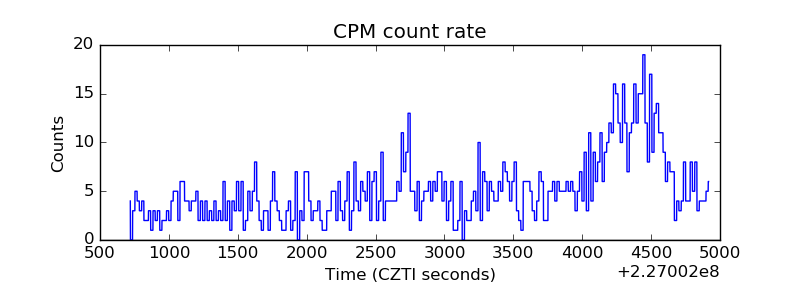 |
| CZT Counter | 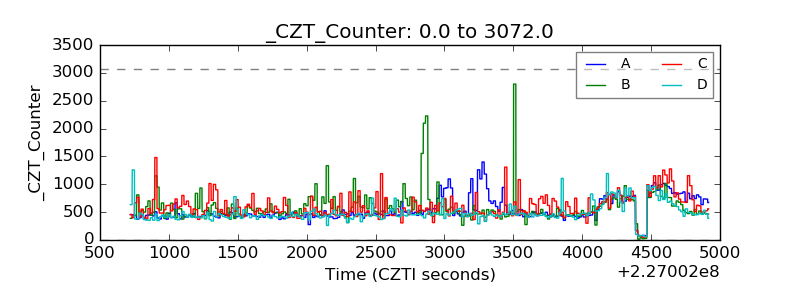 |
| +2.5 Volts monitor |  |
| +5 Volts monitor | 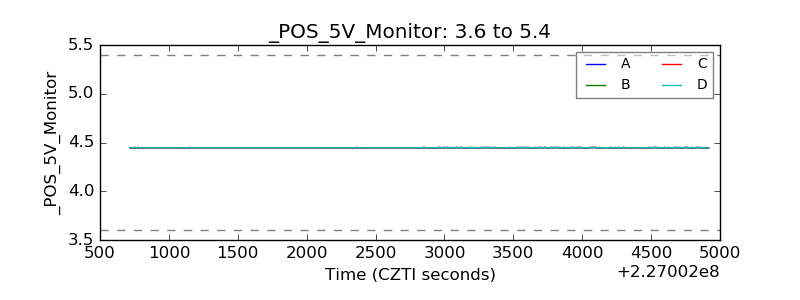 |
| _ROLL_ROT | 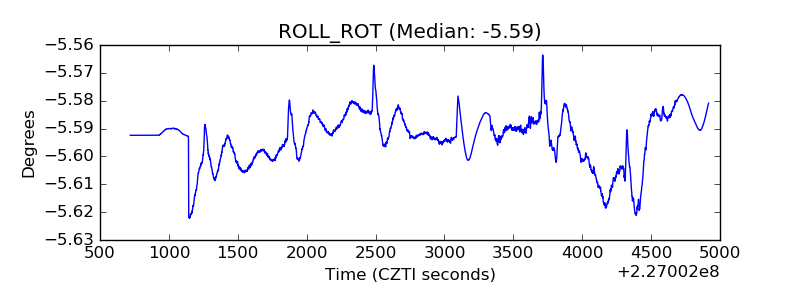 |
| _Roll_DEC | 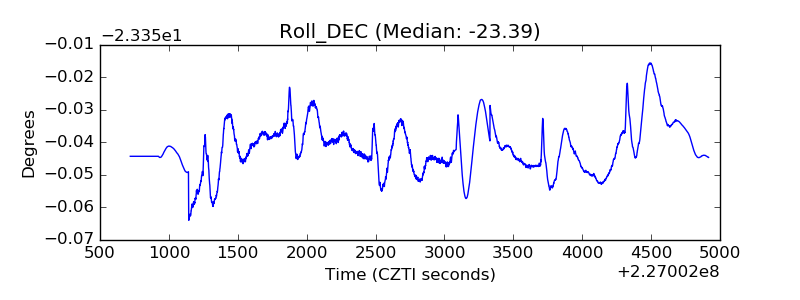 |
| _Roll_RA | 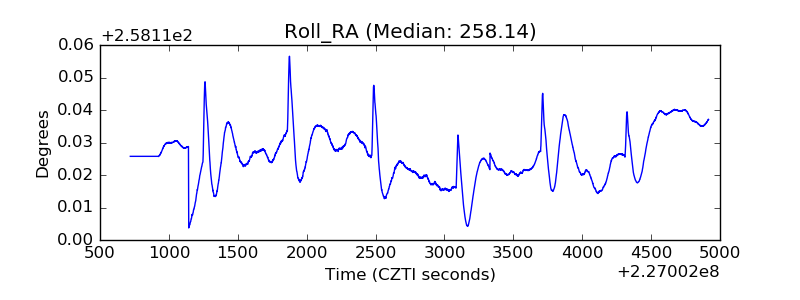 |
| Veto Counter |  |