| Param | Original file | Final file |
|---|---|---|
| Filename | modeM0/AS1G06_077T02_9000001076_07864cztM0_level2.evt | modeM0/AS1G06_077T02_9000001076_07864cztM0_level2_quad_clean.evt |
| Size (bytes) | 255,893,760 | 26,737,920 |
| Size | 244.0 MB | 25.5 MB |
| Events in quadrant A | 2,198,424 | 142,519 |
| Events in quadrant B | 1,532,136 | 150,374 |
| Events in quadrant C | 2,321,873 | 145,253 |
| Events in quadrant D | 1,476,985 | 141,600 |
| Mode M0 | |||
|---|---|---|---|
| Quadrant | BADHDUFLAG | Total packets | Discarded packets |
| A | 0 | 8830 | 11 |
| B | 0 | 6681 | 4 |
| C | 0 | 9156 | 10 |
| D | 0 | 6669 | 2 |
| Mode SS | |||
|---|---|---|---|
| Quadrant | BADHDUFLAG | Total packets | Discarded packets |
| A | 0 | 64 | 0 |
| B | 0 | 64 | 0 |
| C | 0 | 64 | 0 |
| D | 0 | 64 | 0 |
| Quadrant | Total seconds | Saturated seconds | Saturation percentage |
|---|---|---|---|
| A | 3224 | 73 | 2.264268% |
| B | 3226 | 5 | 0.154991% |
| C | 3225 | 27 | 0.837209% |
| D | 3227 | 9 | 0.278897% |
Noise dominated data is calculated using 1-second bins in cleaned event files. If a bin has >2000 counts, and if more than 50% of those come from <1% of pixels, then it is considered to be noise-dominated and hence unusable.
| Quadrant | # 1 sec bins | Bins with >0 counts | Bins with >2000 counts | High rate bins dominated by noise | Noise dominated (total time) | Noise dominated (detector-on time) | Marked lightcurve |
|---|---|---|---|---|---|---|---|
| A | 3228 | 3228 | 39 | 39 | 1.21% | 1.21% | 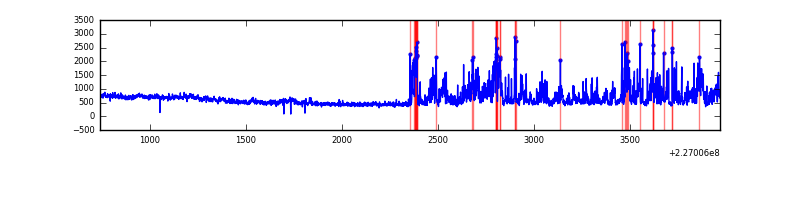 |
| B | 3228 | 3228 | 2 | 2 | 0.06% | 0.06% | 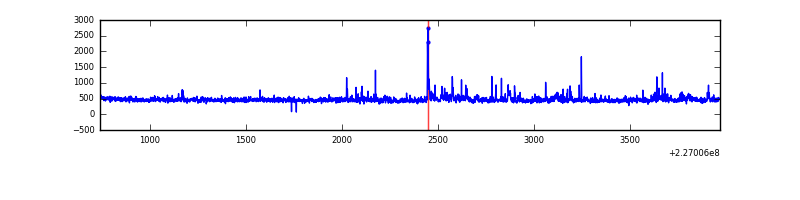 |
| C | 3228 | 3228 | 22 | 22 | 0.68% | 0.68% | 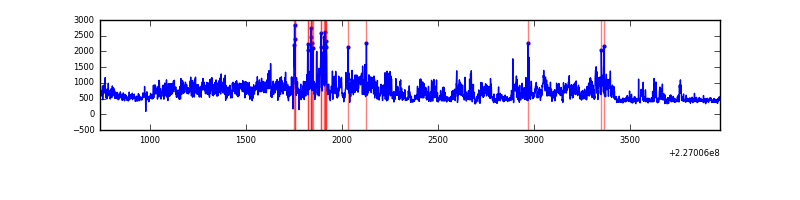 |
| D | 3228 | 3228 | 9 | 9 | 0.28% | 0.28% | 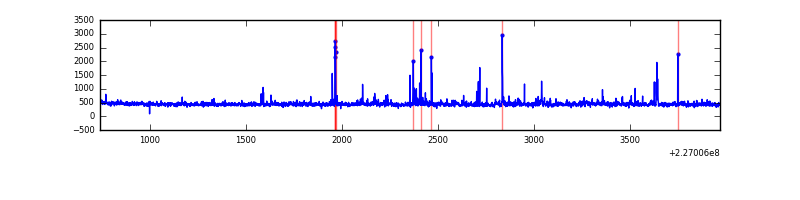 |
Top three noisy pixels from each quadrant. If the there are fewer than three noisy pixels in the level2.evt file, extra rows are filled as -1
| Pixel properties | Quadrant properties | ||||||
|---|---|---|---|---|---|---|---|
| Quadrant | DetID | PixID | Counts | Sigma | Mean | Median | Sigma |
| A | 15 | 239 | 591161 | 7911.96 | 360 | 352 | 74.7 |
| A | 15 | 234 | 185301 | 2476.79 | 360 | 352 | 74.7 |
| A | 15 | 223 | 22805 | 300.68 | 360 | 352 | 74.7 |
| B | 4 | 239 | 45298 | 631.46 | 363 | 355 | 71.2 |
| B | 4 | 173 | 40235 | 560.32 | 363 | 355 | 71.2 |
| B | 0 | 214 | 18552 | 255.67 | 363 | 355 | 71.2 |
| C | 1 | 16 | 812771 | 9817.53 | 352 | 354 | 82.8 |
| C | 8 | 229 | 119894 | 1444.56 | 352 | 354 | 82.8 |
| C | 8 | 128 | 7286 | 83.77 | 352 | 354 | 82.8 |
| D | 2 | 152 | 58905 | 663.81 | 356 | 345 | 88.2 |
| D | 7 | 71 | 19545 | 217.64 | 356 | 345 | 88.2 |
| D | 5 | 233 | 15157 | 167.9 | 356 | 345 | 88.2 |
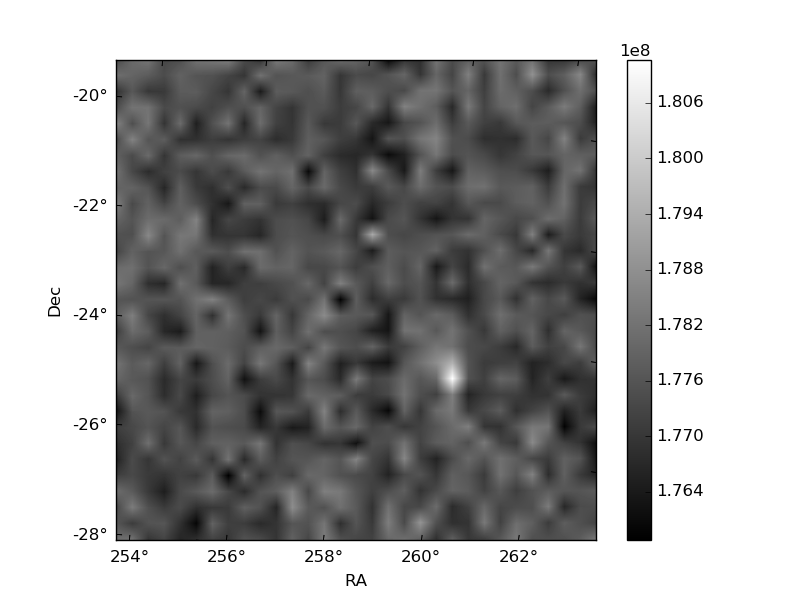
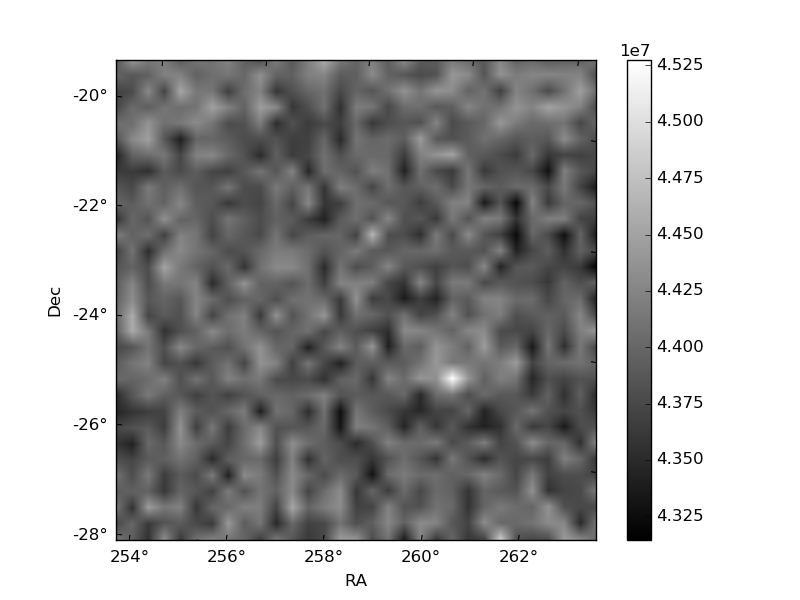
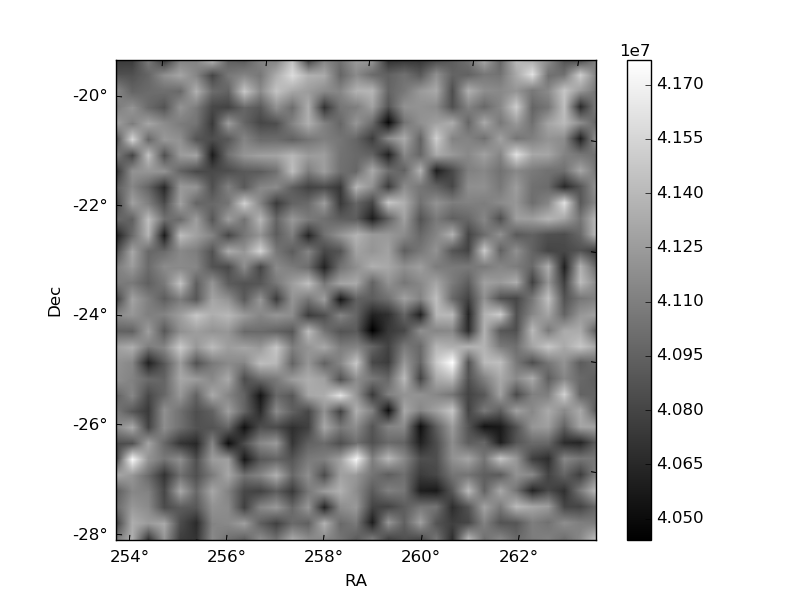
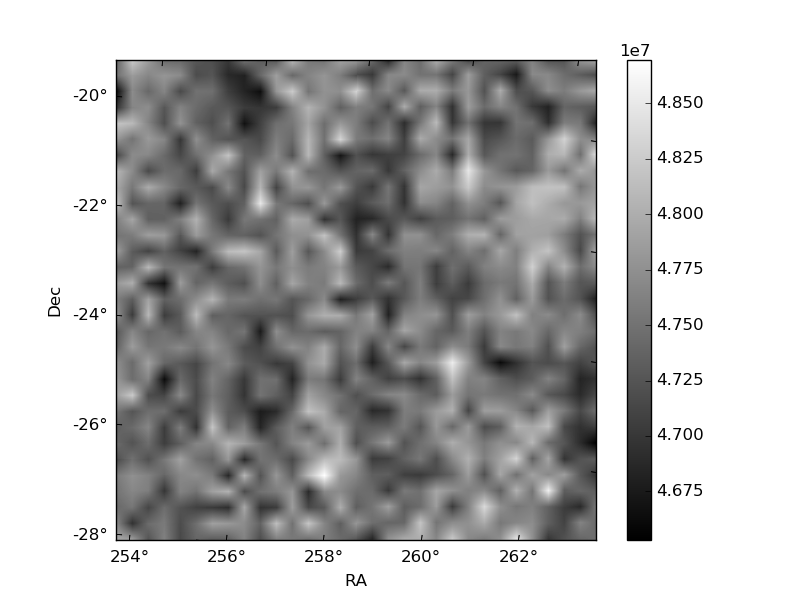
Histogram calculated using DETX and DETY for each event in the final _common_clean file
| Quadrant A | 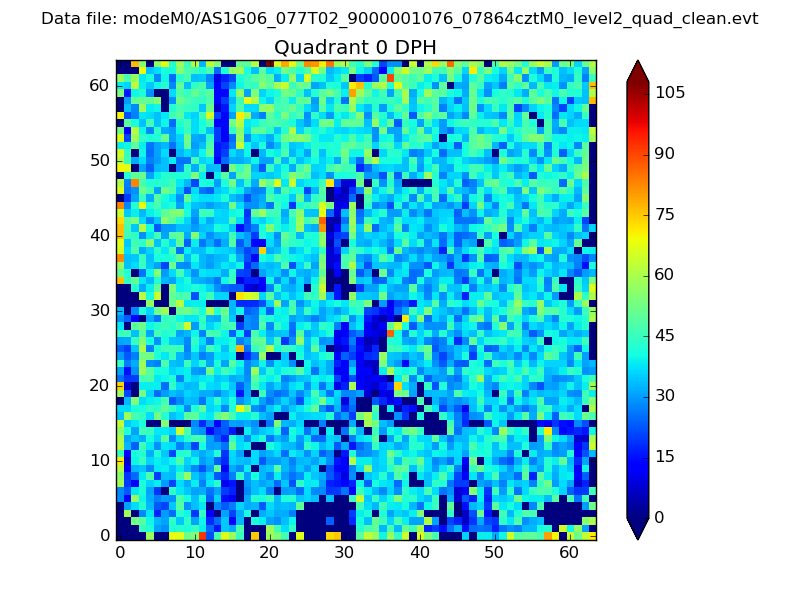 |
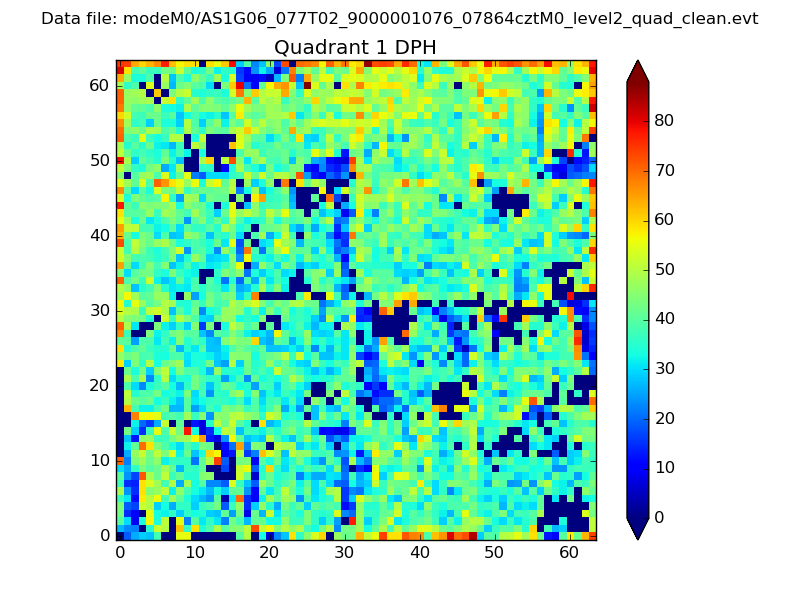 |
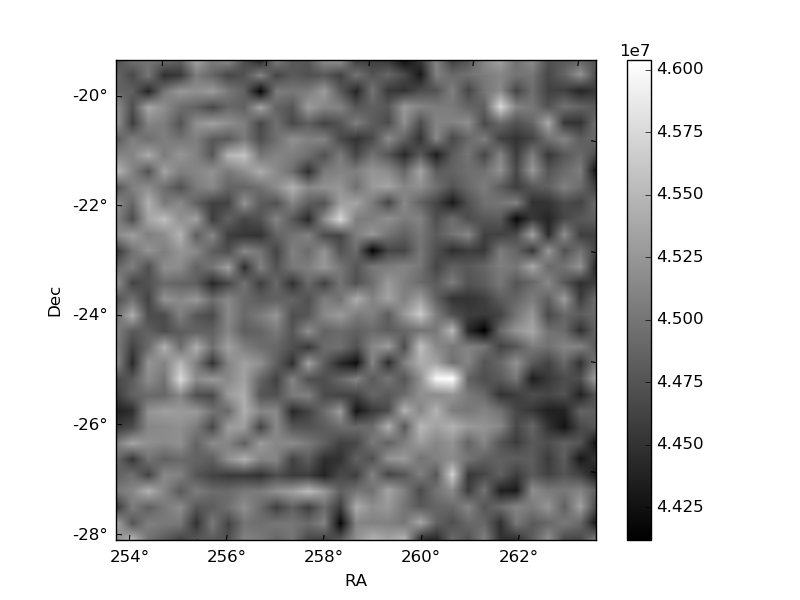
Quadrant B |
|---|---|---|---|
| Quadrant D | 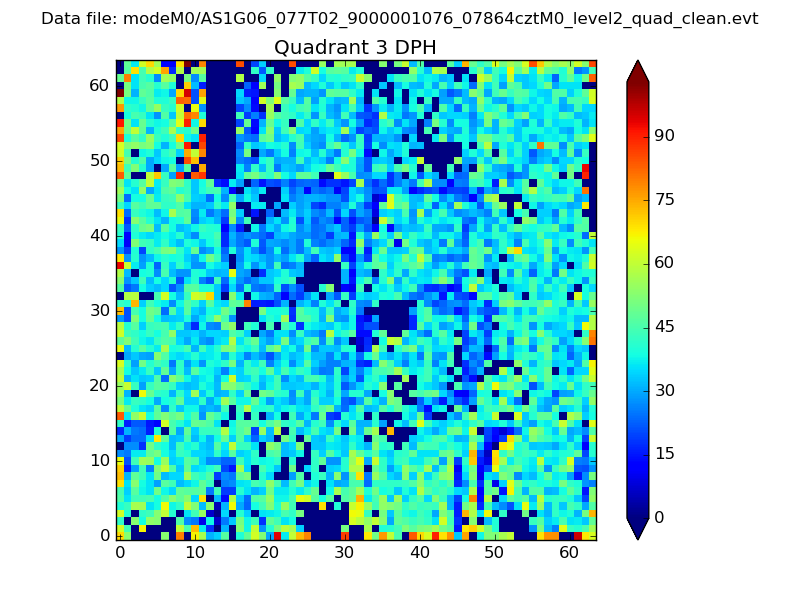 |
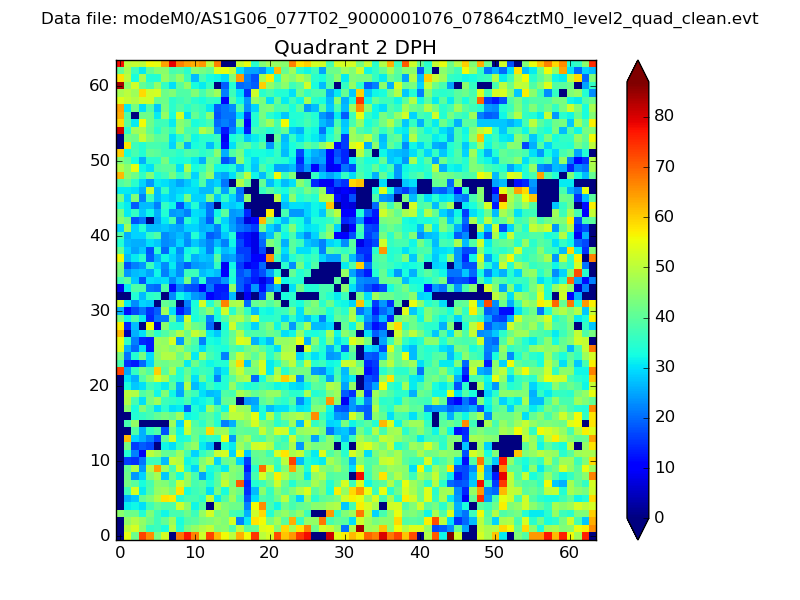 |
Quadrant C |
| Plot type | Count rate plots | Images |
|---|---|---|
| Comparison with Poisson distribution Blue bars denote a histogram of data divided into 1 sec bins. Red curve is a Poisson curve with rate = median count rate of data. |
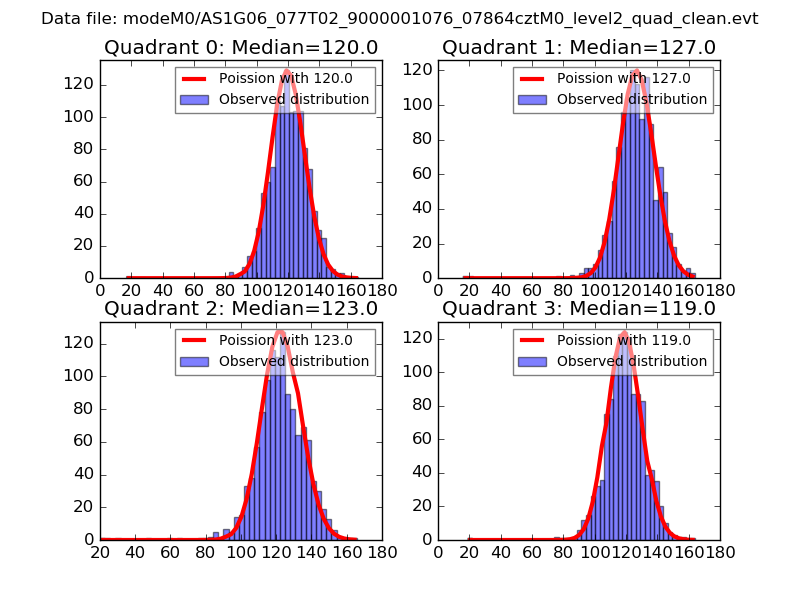 |
 |
| Quadrant-wise count rates Data is divided into 100 sec bins |
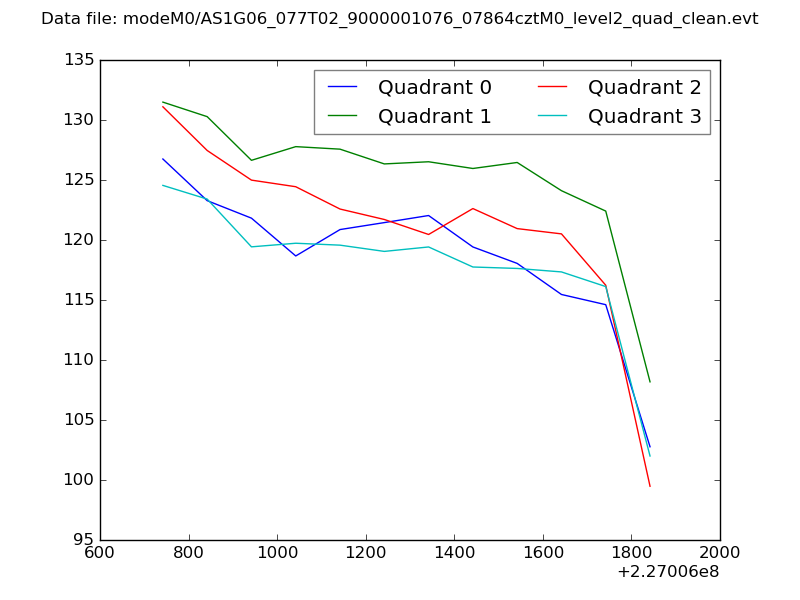 |
|
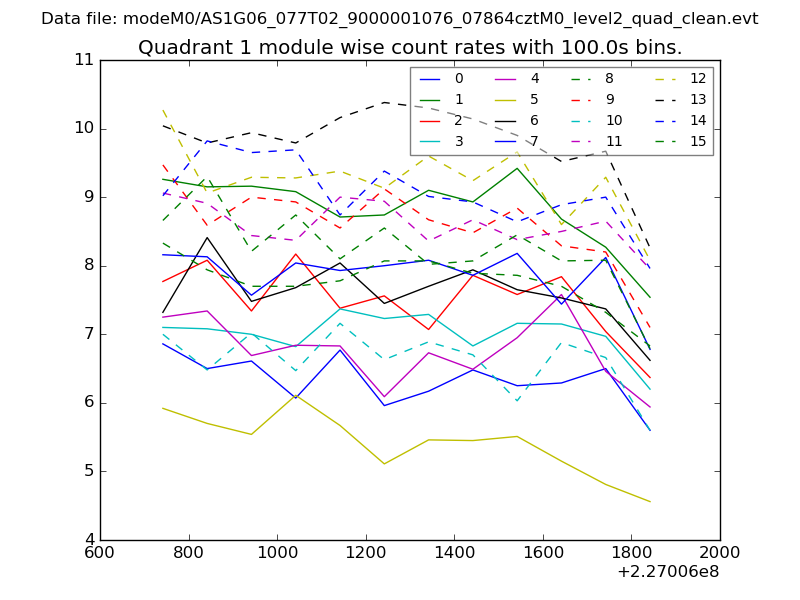
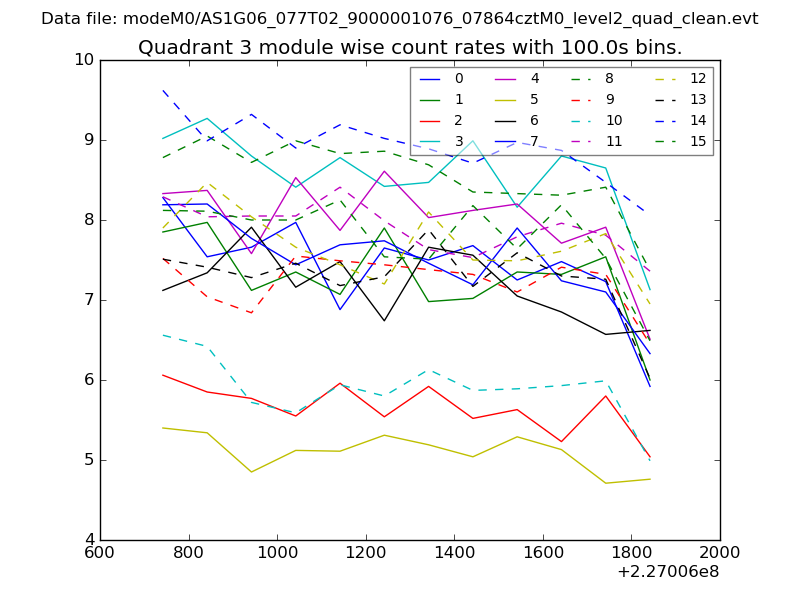
| Module-wise count rates for Quadrant A Data is divided into 100 sec bins |
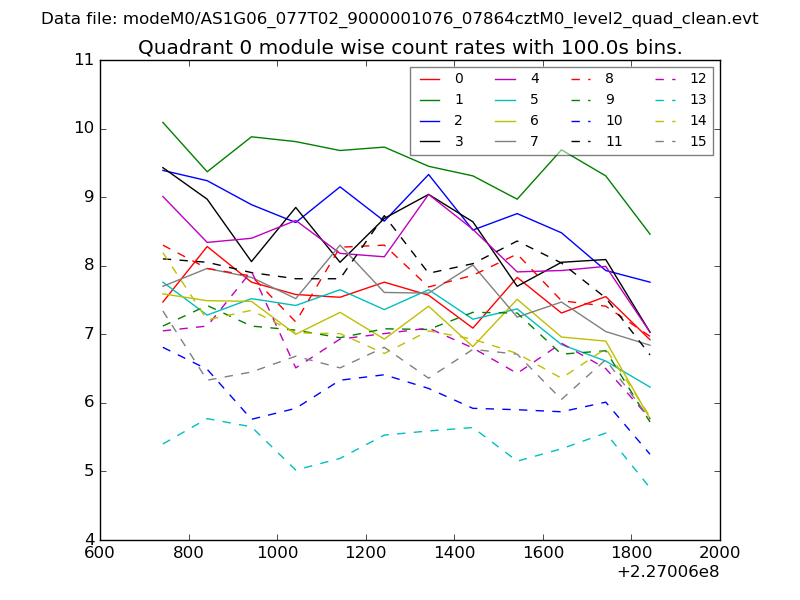 |
 |
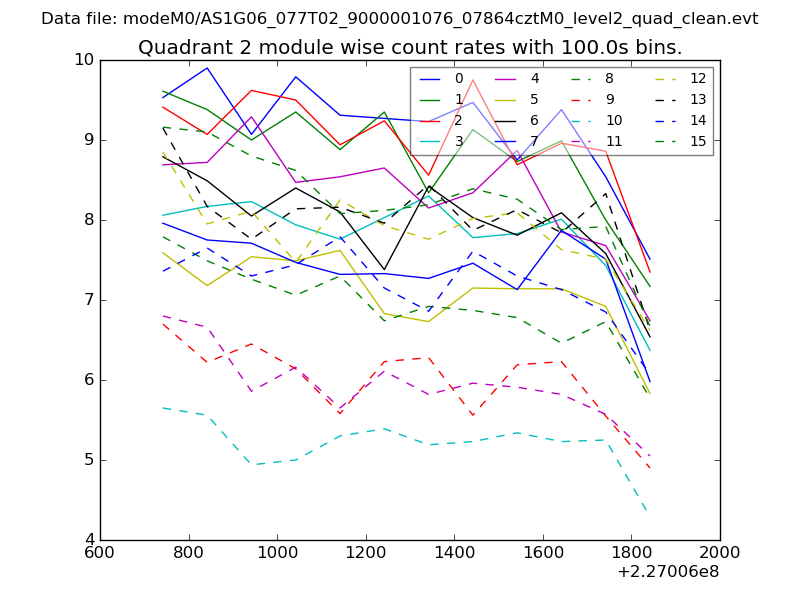
| Module-wise count rates for Quadrant B Data is divided into 100 sec bins |
 |
 |
| Module-wise count rates for Quadrant C Data is divided into 100 sec bins |
 |
 |
| Module-wise count rates for Quadrant D Data is divided into 100 sec bins |
 |
 |
| Parameter | Plot |
|---|---|
| CZT HV Monitor | 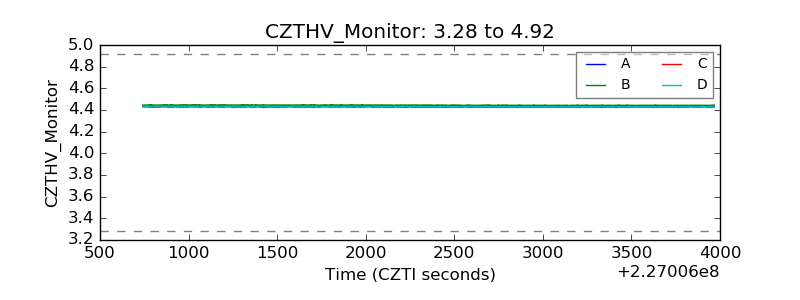 |
| D_VDD | 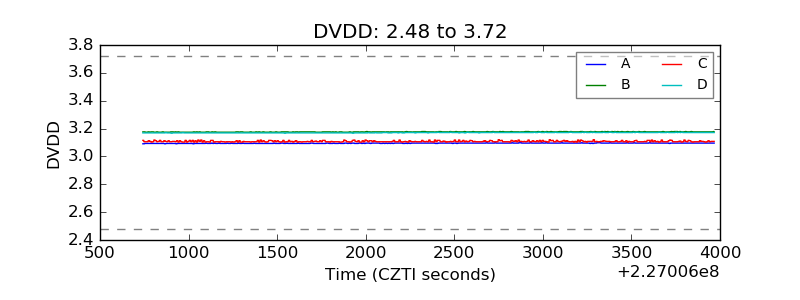 |
| Temperature 1 | 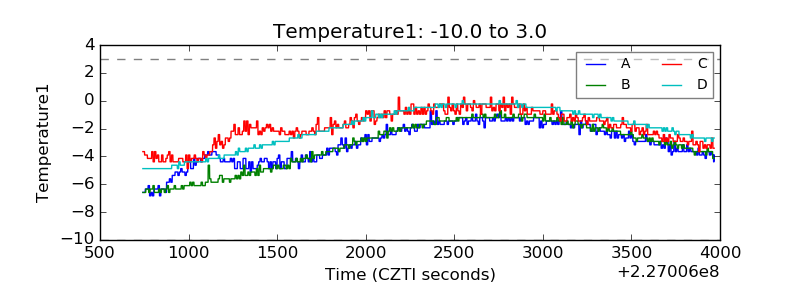 |
| Veto HV Monitor | 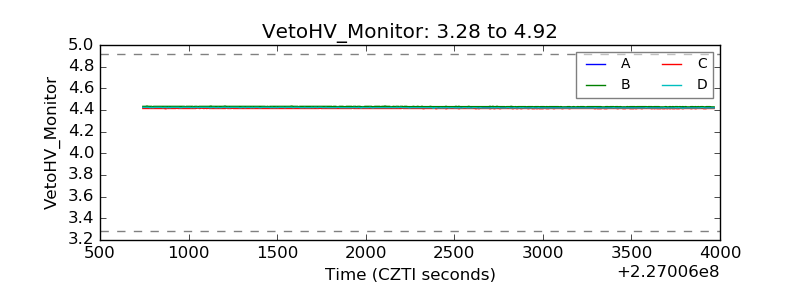 |
| Veto LLD | 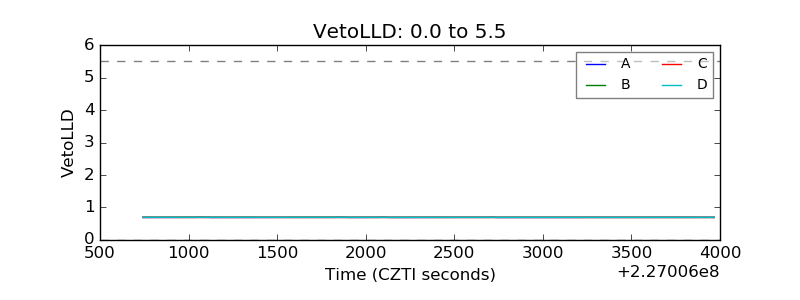 |
| Alpha Counter | 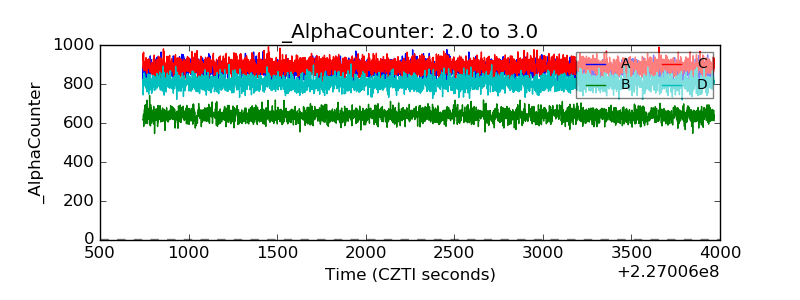 |
| _CPM_Rate | 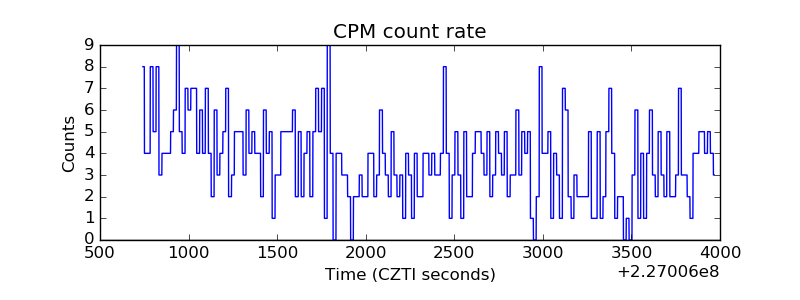 |
| CZT Counter | 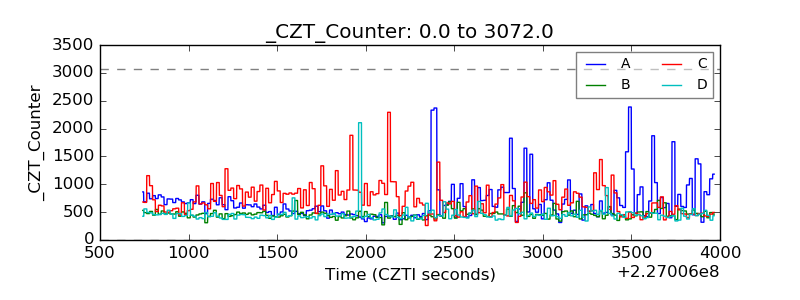 |
| +2.5 Volts monitor | 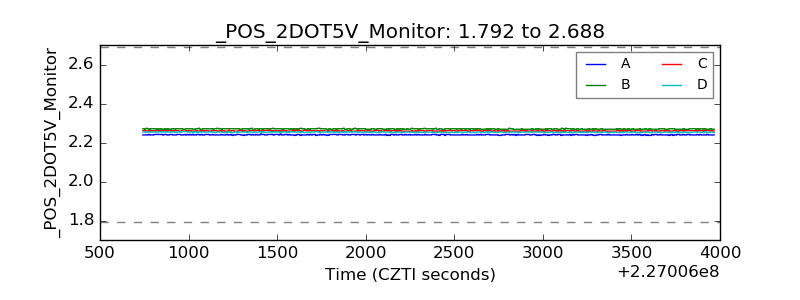 |
| +5 Volts monitor | 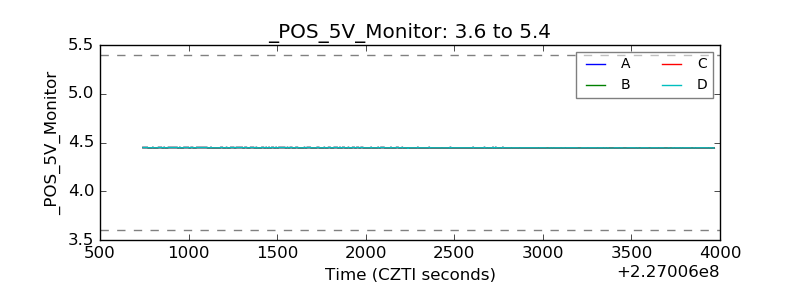 |
| _ROLL_ROT | 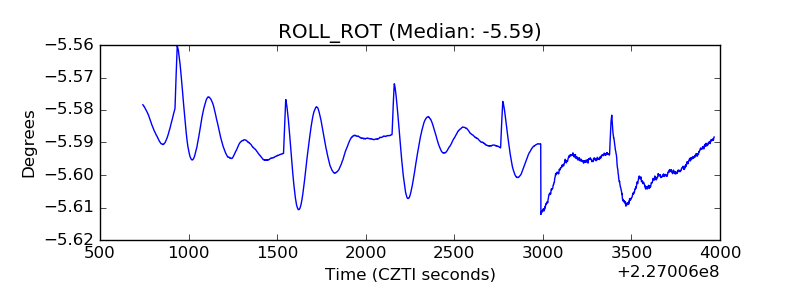 |
| _Roll_DEC | 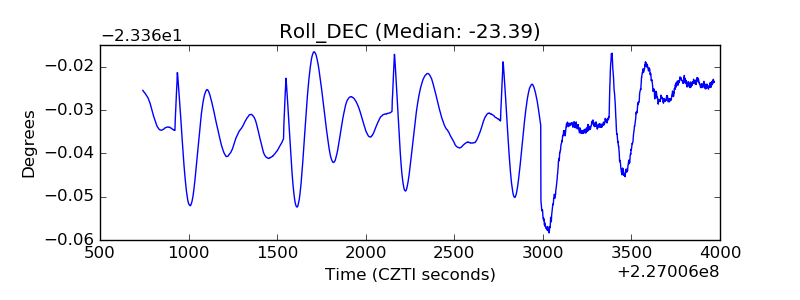 |
| _Roll_RA | 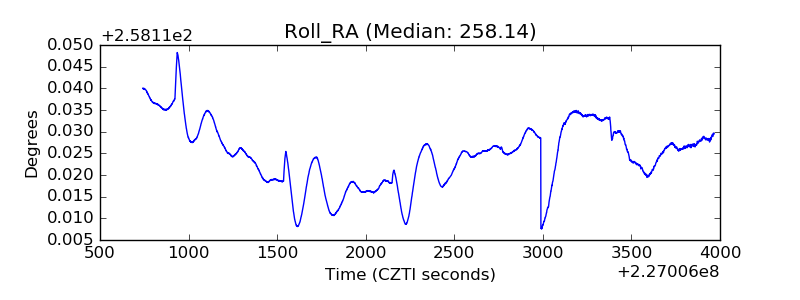 |
| Veto Counter | 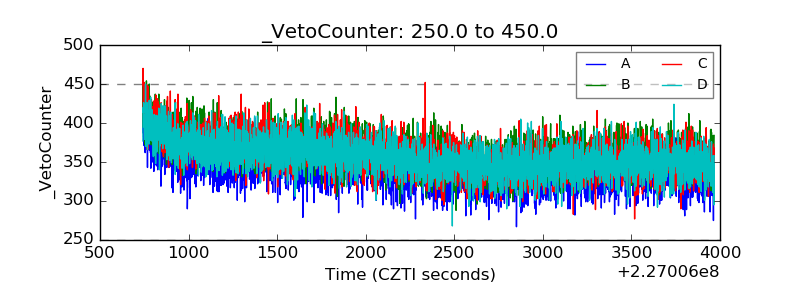 |