| Param | Original file | Final file |
|---|---|---|
| Filename | modeM0/AS1A02_071T01_9000001078cztM0_level2.fits | modeM0/AS1A02_071T01_9000001078cztM0_level2_quad_clean.evt |
| Size (bytes) | 1,297,543,680 | 1,382,313,600 |
| Size | 1.2 GB | 1.3 GB |
| Events in quadrant A | 7,727,656 | 8,370,064 |
| Events in quadrant B | 7,590,160 | 8,540,975 |
| Events in quadrant C | 7,704,426 | 8,030,804 |
| Events in quadrant D | 6,615,436 | 7,270,394 |
| Mode SS | |||
|---|---|---|---|
| Quadrant | BADHDUFLAG | Total packets | Discarded packets |
| A | 0 | 2868 | 0 |
| B | 0 | 2868 | 0 |
| C | 0 | 2868 | 0 |
| D | 0 | 2868 | 0 |
| Mode M0 | |||
|---|---|---|---|
| Quadrant | BADHDUFLAG | Total packets | Discarded packets |
| A | 0 | 314775 | 0 |
| B | 0 | 304090 | 0 |
| C | 0 | 334905 | 0 |
| D | 0 | 330890 | 0 |
| Mode M9 | |||
|---|---|---|---|
| Quadrant | BADHDUFLAG | Total packets | Discarded packets |
| A | 0 | 214 | 0 |
| B | 0 | 214 | 0 |
| C | 0 | 214 | 0 |
| D | 0 | 214 | 0 |
| Quadrant | Total seconds | Saturated seconds | Saturation percentage |
|---|---|---|---|
| A | 140892 | 4071 | 2.889447% |
| B | 140891 | 3142 | 2.230093% |
| C | 140892 | 3203 | 2.273373% |
| D | 140892 | 4290 | 3.044885% |
Noise dominated data is calculated using 1-second bins in cleaned event files. If a bin has >2000 counts, and if more than 50% of those come from <1% of pixels, then it is considered to be noise-dominated and hence unusable.
| Quadrant | # 1 sec bins | Bins with >0 counts | Bins with >2000 counts | High rate bins dominated by noise | Noise dominated (total time) | Noise dominated (detector-on time) | Marked lightcurve |
|---|---|---|---|---|---|---|---|
| A | 162537 | 140876 | 0 | 0 | 0.00% | 0.00% | 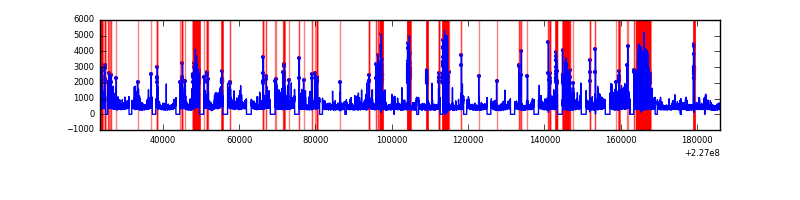 |
| B | 162537 | 140888 | 0 | 0 | 0.00% | 0.00% |  |
| C | 162537 | 140884 | 0 | 0 | 0.00% | 0.00% | 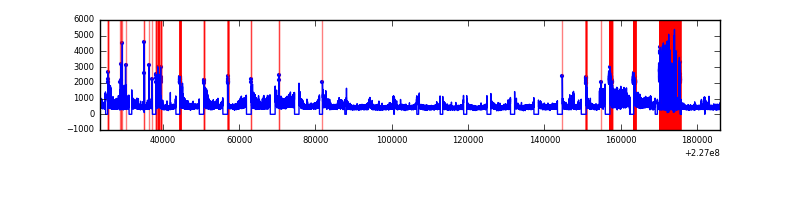 |
| D | 162537 | 140880 | 0 | 0 | 0.00% | 0.00% |  |
Top three noisy pixels from each quadrant. If the there are fewer than three noisy pixels in the level2.evt file, extra rows are filled as -1
| Pixel properties | Quadrant properties | ||||||
|---|---|---|---|---|---|---|---|
| Quadrant | DetID | PixID | Counts | Sigma | Mean | Median | Sigma |
| A | 0 | 29 | 7629 | 11.34 | 2007 | 1867 | 508.2 |
| A | 7 | 110 | 6417 | 8.95 | 2007 | 1867 | 508.2 |
| A | 0 | 30 | 5986 | 8.11 | 2007 | 1867 | 508.2 |
| B | 2 | 9 | 6503 | 11.72 | 1998 | 1898 | 392.8 |
| B | 3 | 17 | 5153 | 8.29 | 1998 | 1898 | 392.8 |
| B | 12 | 226 | 5088 | 8.12 | 1998 | 1898 | 392.8 |
| C | 1 | 80 | 5849 | 7.4 | 2036 | 1884 | 536.0 |
| C | 1 | 81 | 5808 | 7.32 | 2036 | 1884 | 536.0 |
| C | 12 | 241 | 5518 | 6.78 | 2036 | 1884 | 536.0 |
| D | 3 | 14 | 4913 | 6.38 | 1888 | 1715 | 501.0 |
| D | 6 | 231 | 4861 | 6.28 | 1888 | 1715 | 501.0 |
| D | 7 | 5 | 4769 | 6.1 | 1888 | 1715 | 501.0 |
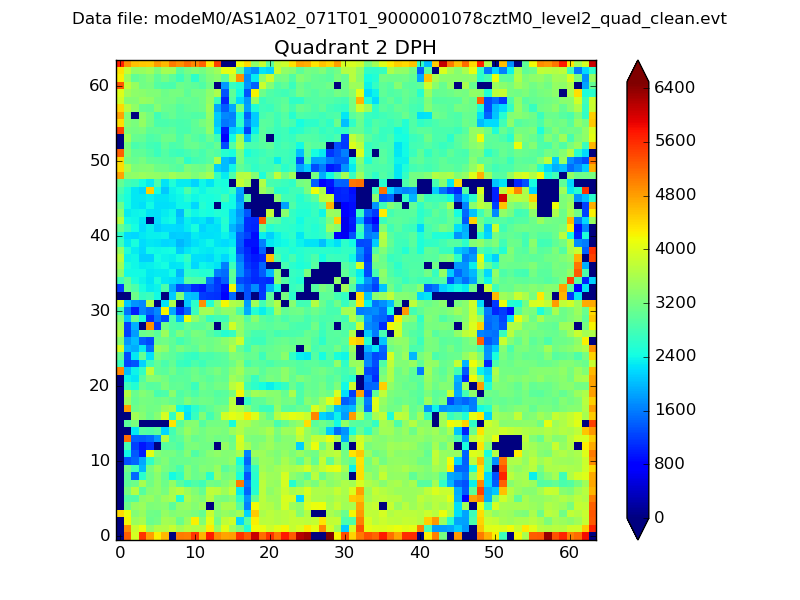
Histogram calculated using DETX and DETY for each event in the final _common_clean file
| Quadrant A | 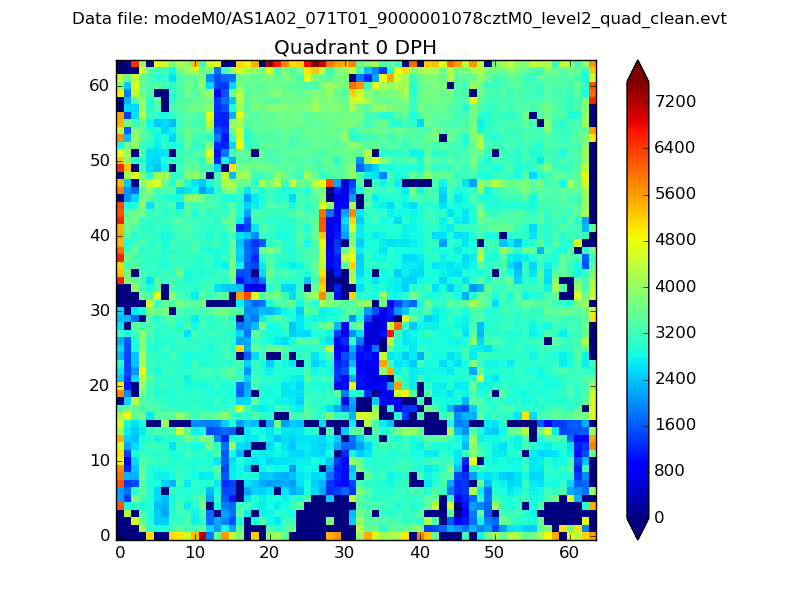 |
 |
Quadrant B |
|---|---|---|---|
| Quadrant D | 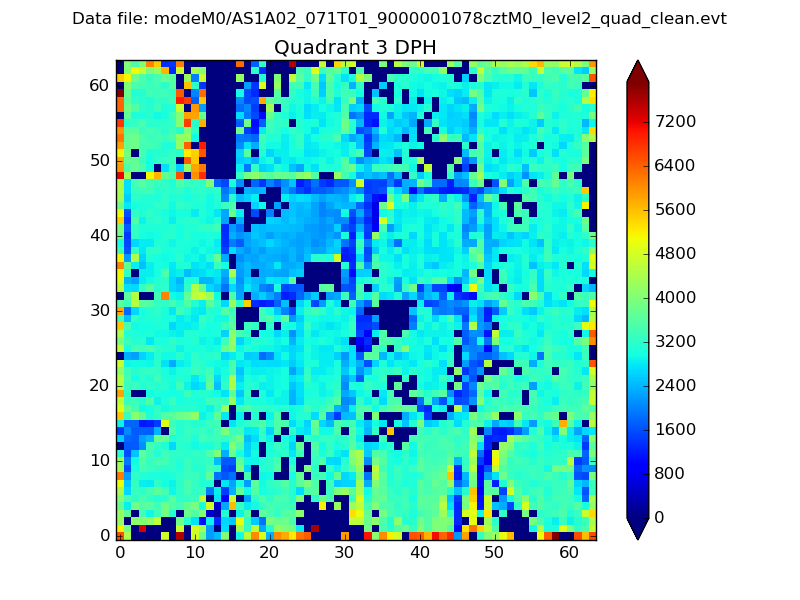 |
 |
Quadrant C |
| Plot type | Count rate plots | Images |
|---|---|---|
| Comparison with Poisson distribution Blue bars denote a histogram of data divided into 1 sec bins. Red curve is a Poisson curve with rate = median count rate of data. |
 |
 |
| Quadrant-wise count rates Data is divided into 100 sec bins |
 |
|
| Module-wise count rates for Quadrant A Data is divided into 100 sec bins |
 |
 |
| Module-wise count rates for Quadrant B Data is divided into 100 sec bins |
 |
 |
| Module-wise count rates for Quadrant C Data is divided into 100 sec bins |
 |
 |
| Module-wise count rates for Quadrant D Data is divided into 100 sec bins |
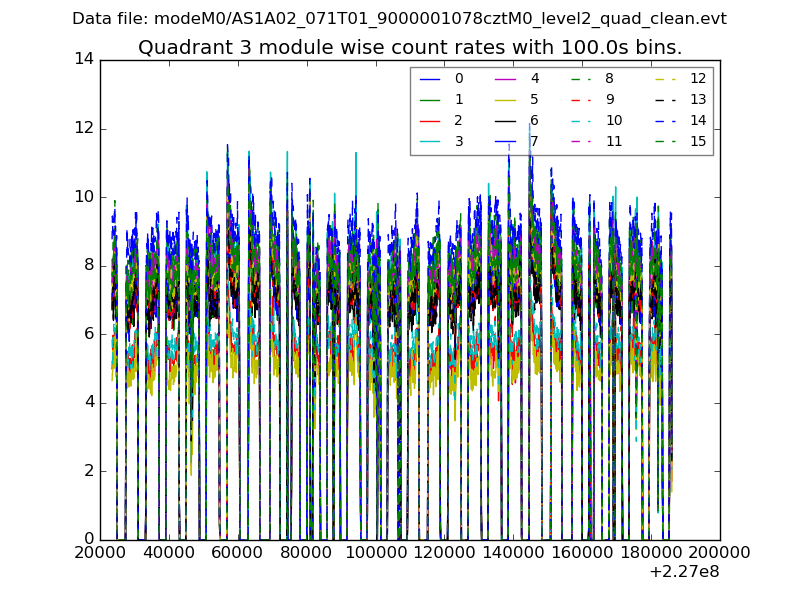 |
 |
| Parameter | Plot |
|---|---|
| CZT HV Monitor |  |
| D_VDD |  |
| Temperature 1 |  |
| Veto HV Monitor |  |
| Veto LLD |  |
| Alpha Counter |  |
| _CPM_Rate | 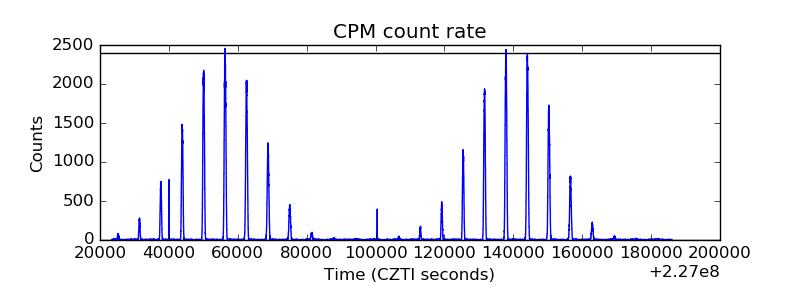 |
| CZT Counter |  |
| +2.5 Volts monitor |  |
| +5 Volts monitor |  |
| _ROLL_ROT | 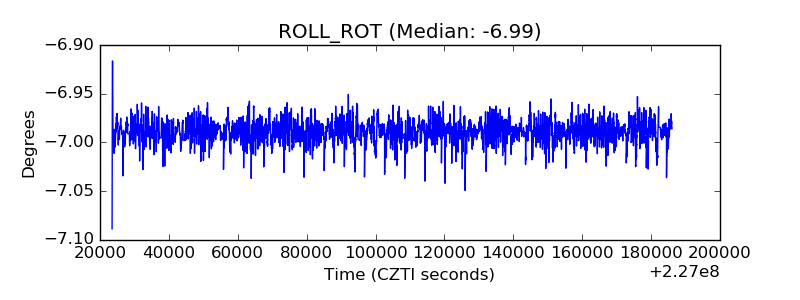 |
| _Roll_DEC |  |
| _Roll_RA |  |
| Veto Counter |  |