| Param | Original file | Final file |
|---|---|---|
| Filename | modeM0/AS1A02_071T01_9000001078_07867cztM0_level2.evt | modeM0/AS1A02_071T01_9000001078_07867cztM0_level2_quad_clean.evt |
| Size (bytes) | 85,458,240 | 21,346,560 |
| Size | 81.5 MB | 20.4 MB |
| Events in quadrant A | 706,343 | 140,160 |
| Events in quadrant B | 520,959 | 143,093 |
| Events in quadrant C | 626,716 | 140,696 |
| Events in quadrant D | 653,765 | 135,753 |
| Mode SS | |||
|---|---|---|---|
| Quadrant | BADHDUFLAG | Total packets | Discarded packets |
| A | 0 | 22 | 0 |
| B | 0 | 22 | 0 |
| C | 0 | 22 | 0 |
| D | 0 | 22 | 0 |
| Mode M0 | |||
|---|---|---|---|
| Quadrant | BADHDUFLAG | Total packets | Discarded packets |
| A | 0 | 2832 | 1 |
| B | 0 | 2281 | 0 |
| C | 0 | 2590 | 0 |
| D | 0 | 2701 | 0 |
| Quadrant | Total seconds | Saturated seconds | Saturation percentage |
|---|---|---|---|
| A | 1137 | 25 | 2.198769% |
| B | 1137 | 0 | 0.000000% |
| C | 1137 | 0 | 0.000000% |
| D | 1137 | 12 | 1.055409% |
Noise dominated data is calculated using 1-second bins in cleaned event files. If a bin has >2000 counts, and if more than 50% of those come from <1% of pixels, then it is considered to be noise-dominated and hence unusable.
| Quadrant | # 1 sec bins | Bins with >0 counts | Bins with >2000 counts | High rate bins dominated by noise | Noise dominated (total time) | Noise dominated (detector-on time) | Marked lightcurve |
|---|---|---|---|---|---|---|---|
| A | 1137 | 1137 | 17 | 17 | 1.50% | 1.50% | 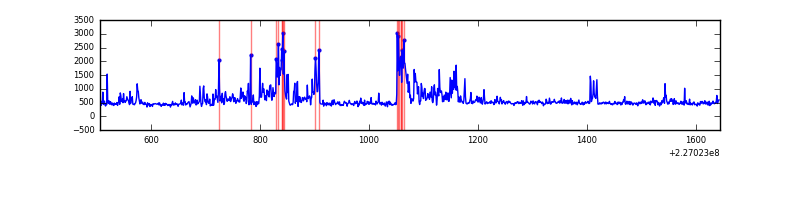 |
| B | 1137 | 1137 | 0 | 0 | 0.00% | 0.00% | 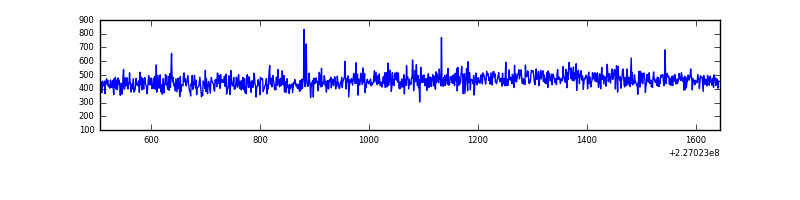 |
| C | 1137 | 1137 | 0 | 0 | 0.00% | 0.00% | 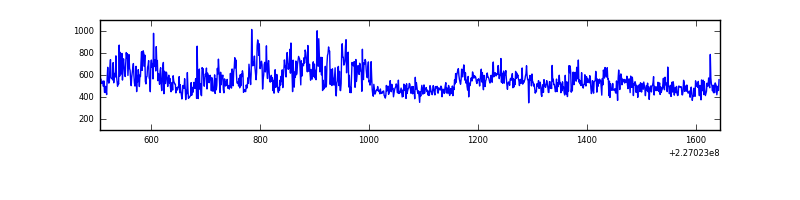 |
| D | 1137 | 1137 | 10 | 10 | 0.88% | 0.88% | 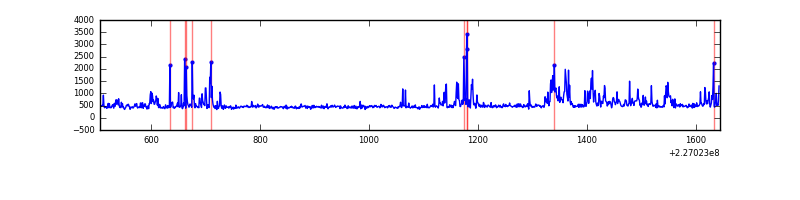 |
Top three noisy pixels from each quadrant. If the there are fewer than three noisy pixels in the level2.evt file, extra rows are filled as -1
| Pixel properties | Quadrant properties | ||||||
|---|---|---|---|---|---|---|---|
| Quadrant | DetID | PixID | Counts | Sigma | Mean | Median | Sigma |
| A | 15 | 239 | 175148 | 5976.41 | 131 | 128 | 29.3 |
| A | 13 | 248 | 20733 | 703.6 | 131 | 128 | 29.3 |
| A | 13 | 14 | 2874 | 93.77 | 131 | 128 | 29.3 |
| B | 12 | 111 | 2702 | 92.72 | 133 | 130 | 27.7 |
| B | 11 | 111 | 2005 | 67.59 | 133 | 130 | 27.7 |
| B | 14 | 111 | 1470 | 48.31 | 133 | 130 | 27.7 |
| C | 1 | 16 | 110438 | 3389.78 | 132 | 133 | 32.5 |
| C | 13 | 61 | 1040 | 27.87 | 132 | 133 | 32.5 |
| C | 12 | 4 | 720 | 18.04 | 132 | 133 | 32.5 |
| D | 13 | 104 | 90295 | 2684.39 | 130 | 126 | 33.6 |
| D | 14 | 34 | 39375 | 1168.47 | 130 | 126 | 33.6 |
| D | 1 | 52 | 20625 | 610.27 | 130 | 126 | 33.6 |
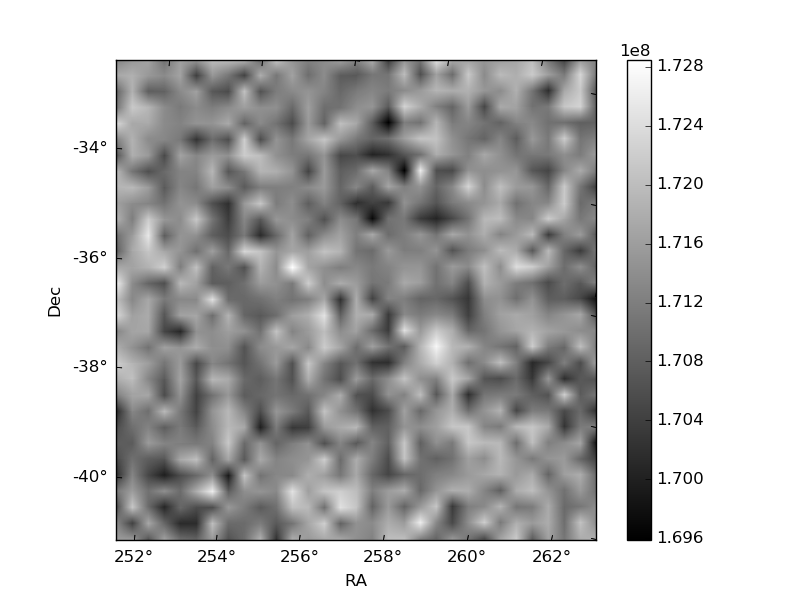
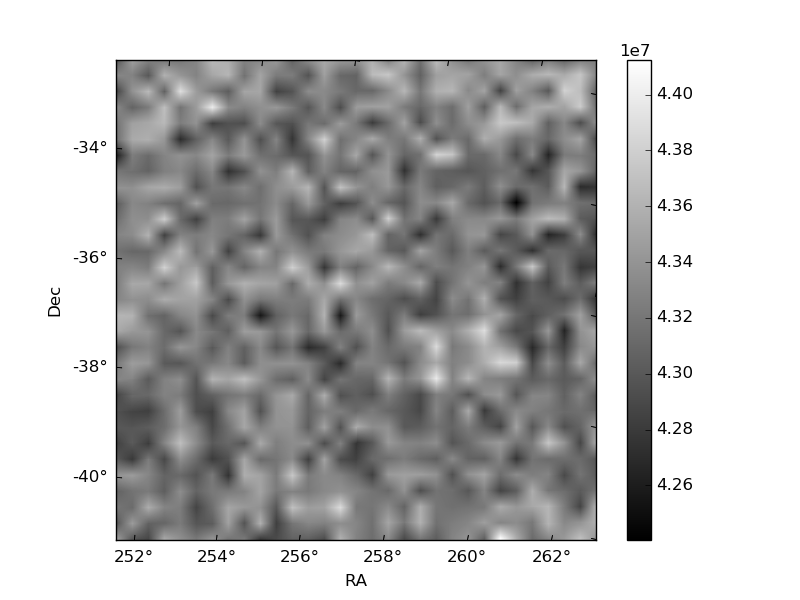
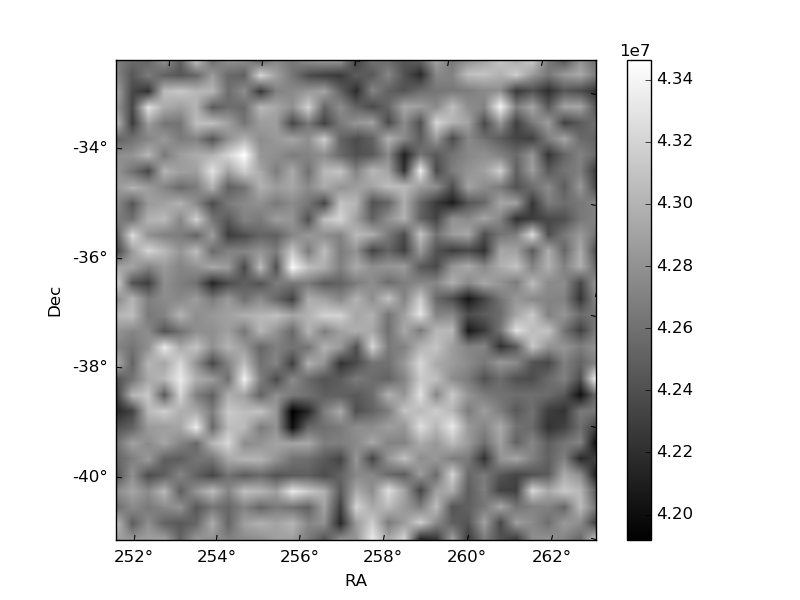
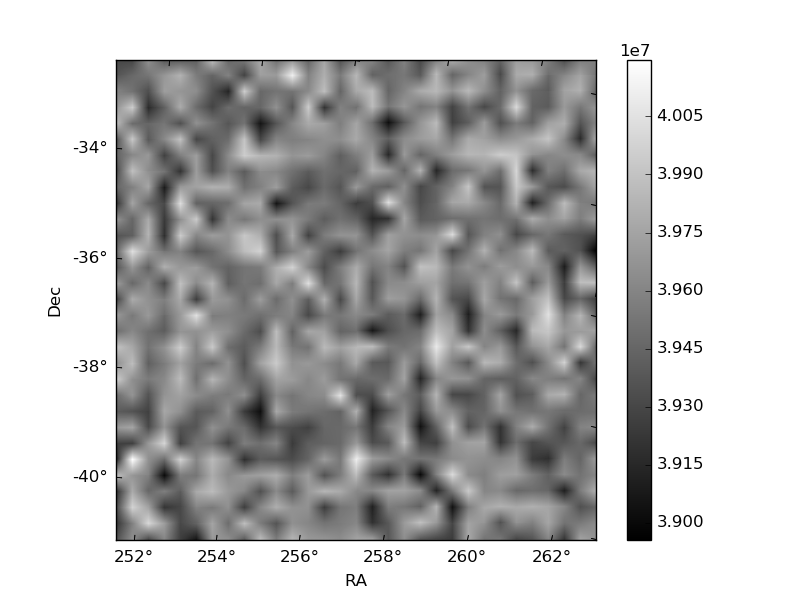
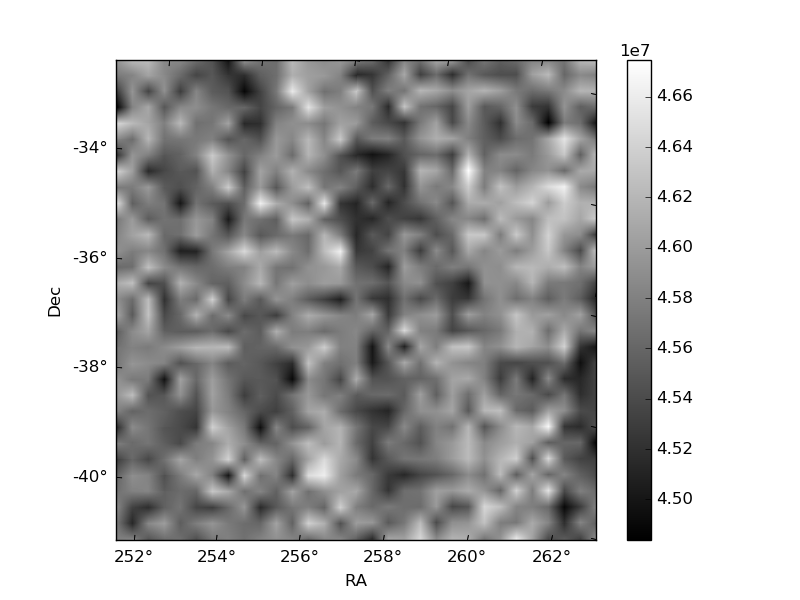
Histogram calculated using DETX and DETY for each event in the final _common_clean file
| Quadrant A | 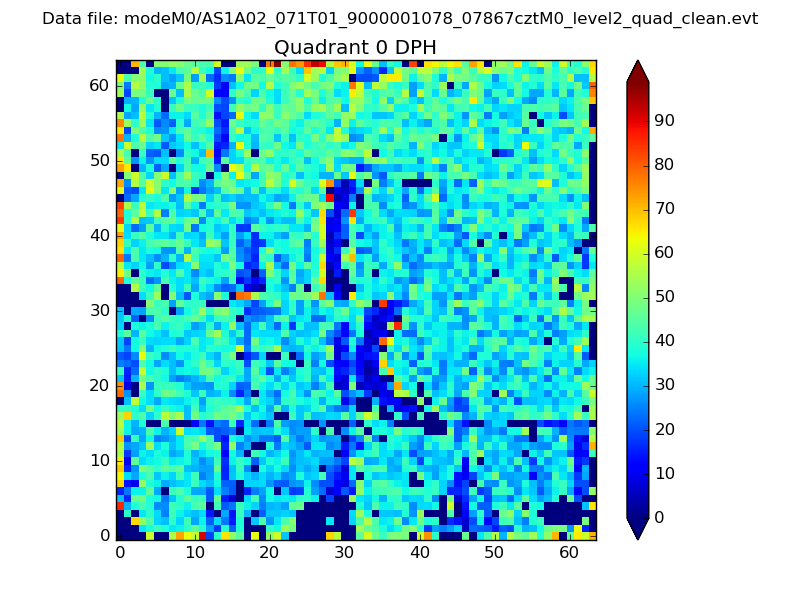 |
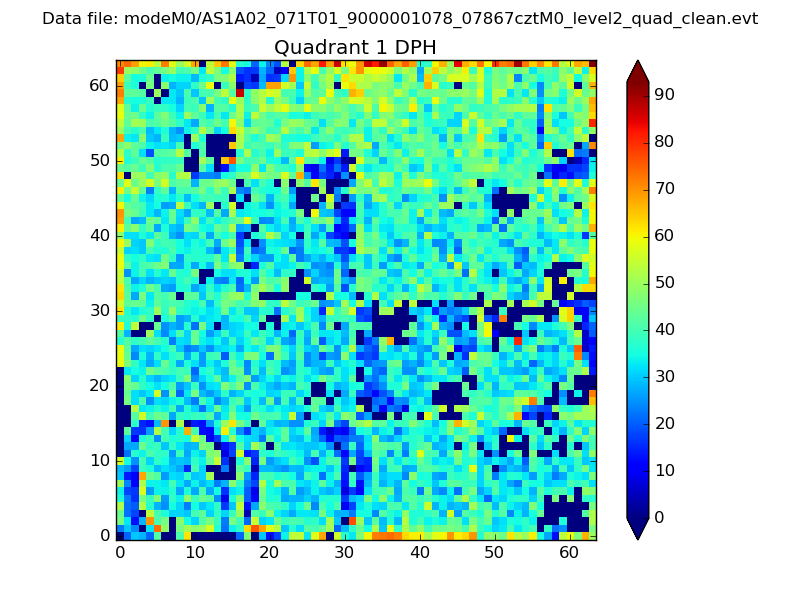 |
Quadrant B |
|---|---|---|---|
| Quadrant D | 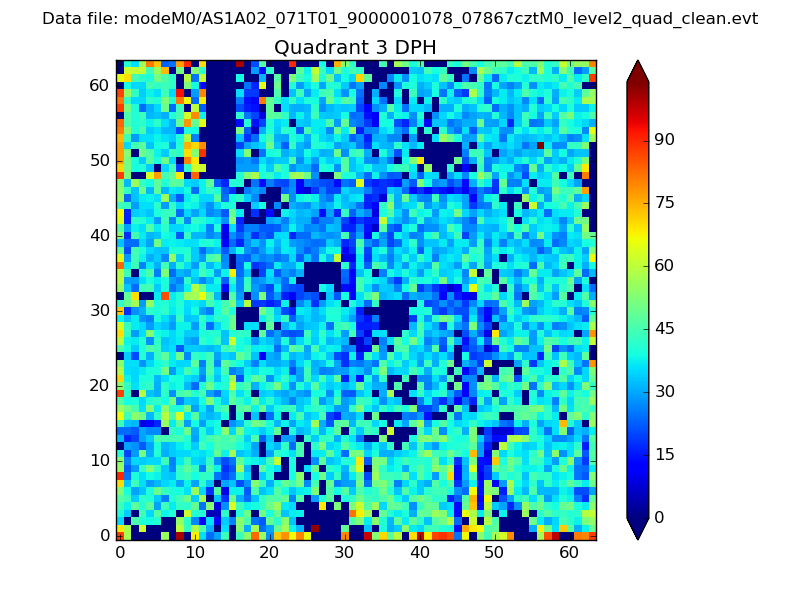 |
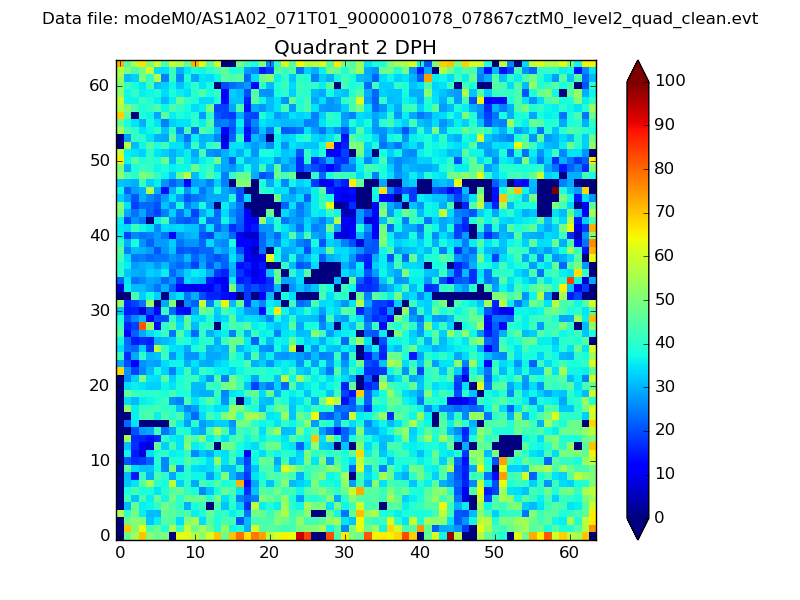 |
Quadrant C |
| Plot type | Count rate plots | Images |
|---|---|---|
| Comparison with Poisson distribution Blue bars denote a histogram of data divided into 1 sec bins. Red curve is a Poisson curve with rate = median count rate of data. |
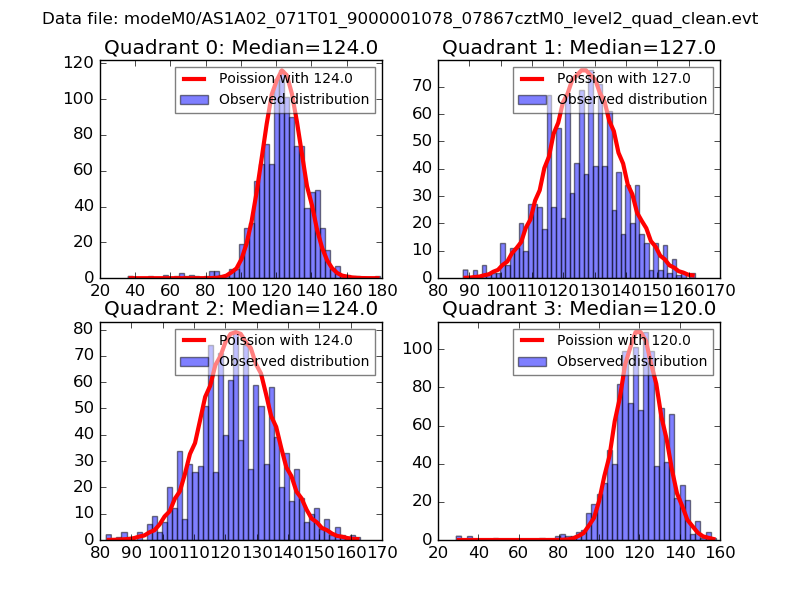 |
 |
| Quadrant-wise count rates Data is divided into 100 sec bins |
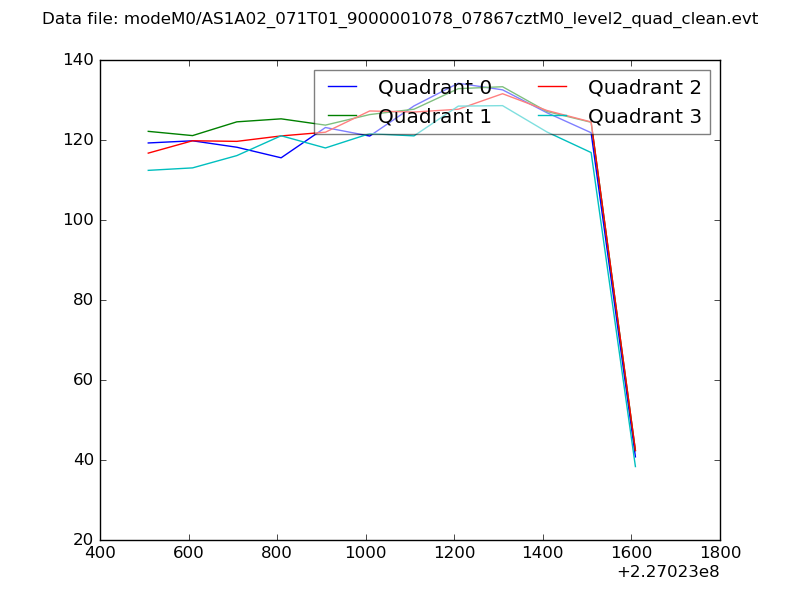 |
|
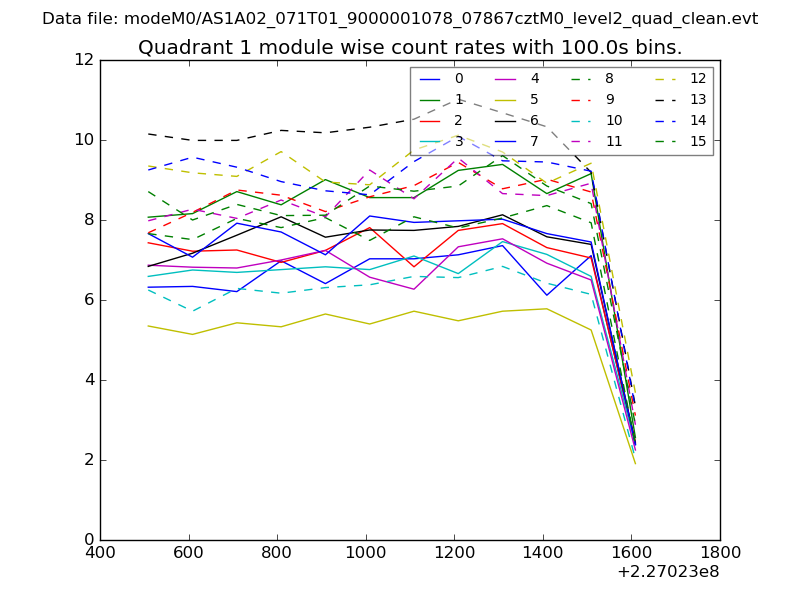
| Module-wise count rates for Quadrant A Data is divided into 100 sec bins |
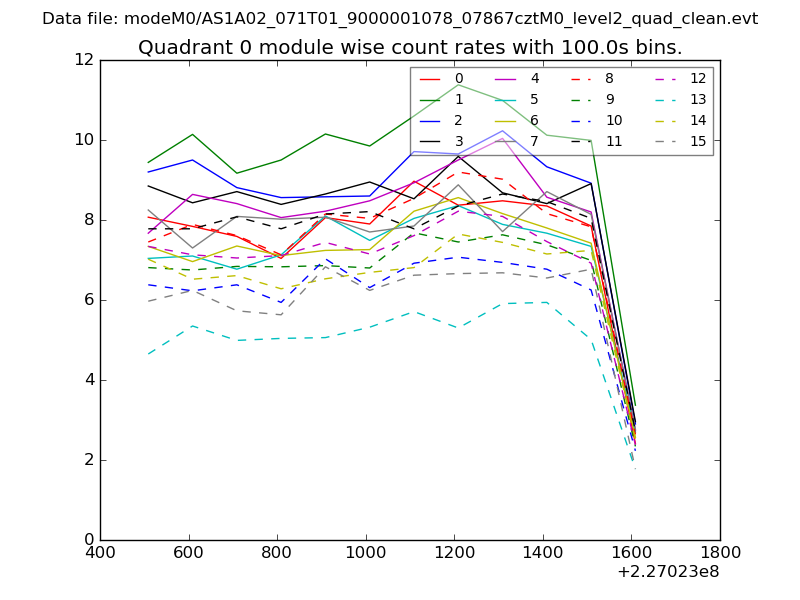 |
 |
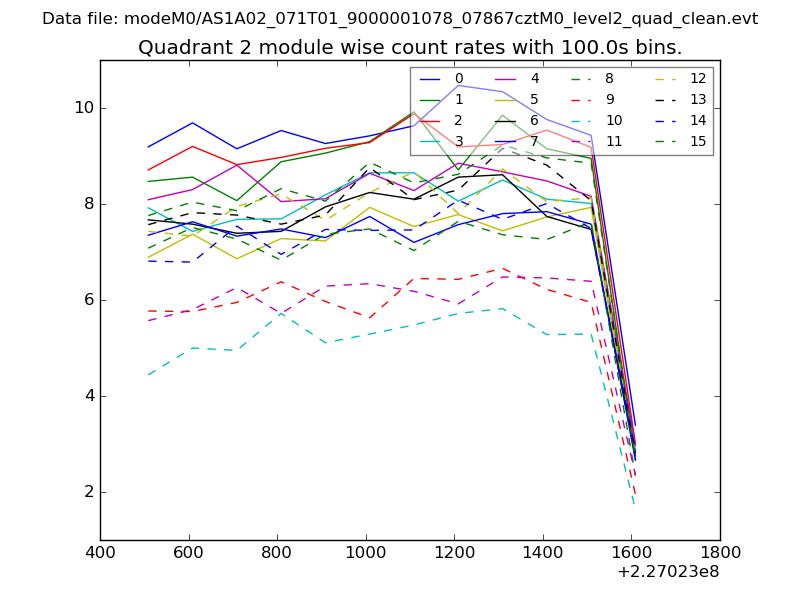
| Module-wise count rates for Quadrant B Data is divided into 100 sec bins |
 |
 |
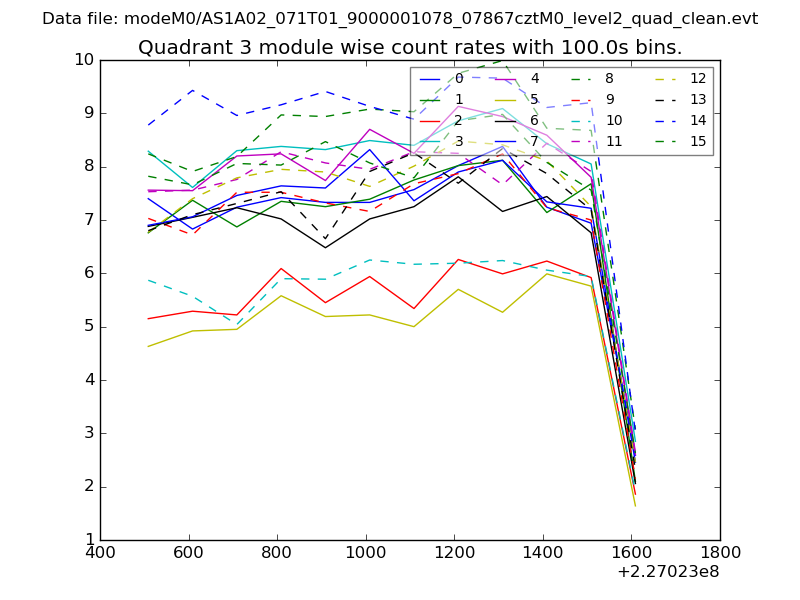
| Module-wise count rates for Quadrant C Data is divided into 100 sec bins |
 |
 |
| Module-wise count rates for Quadrant D Data is divided into 100 sec bins |
 |
 |
| Parameter | Plot |
|---|---|
| CZT HV Monitor | 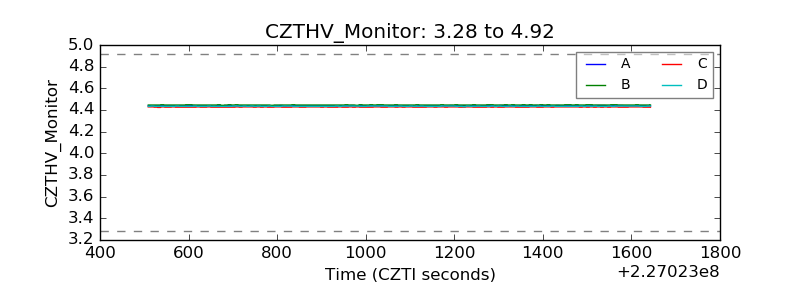 |
| D_VDD | 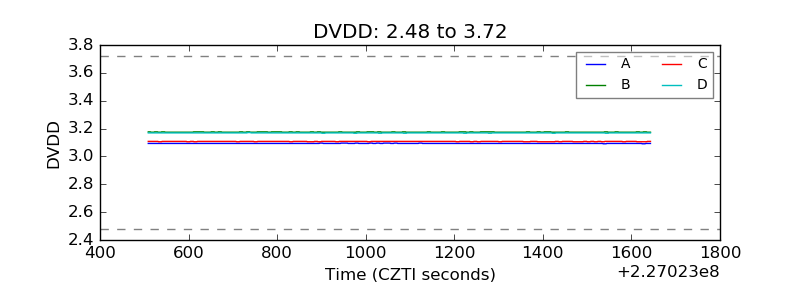 |
| Temperature 1 |  |
| Veto HV Monitor | 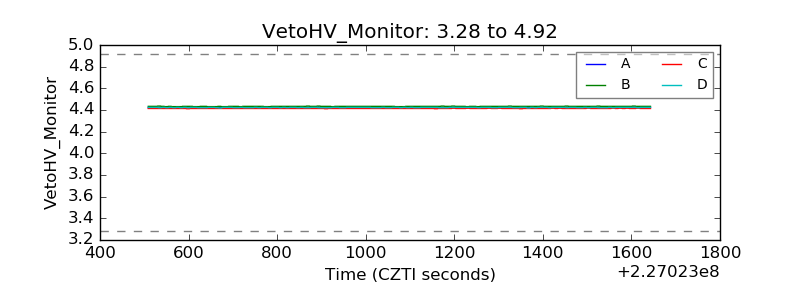 |
| Veto LLD | 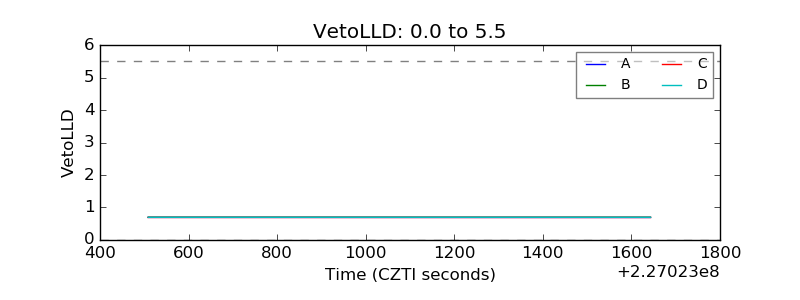 |
| Alpha Counter | 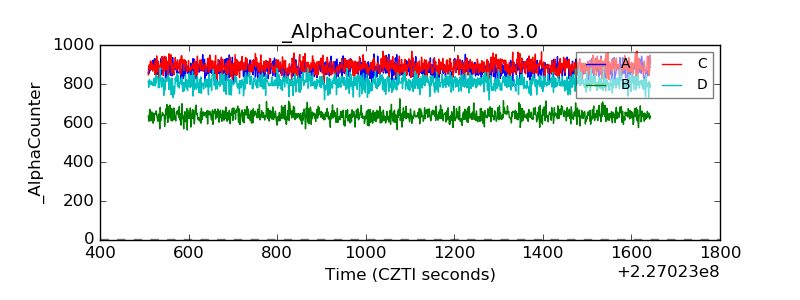 |
| _CPM_Rate | 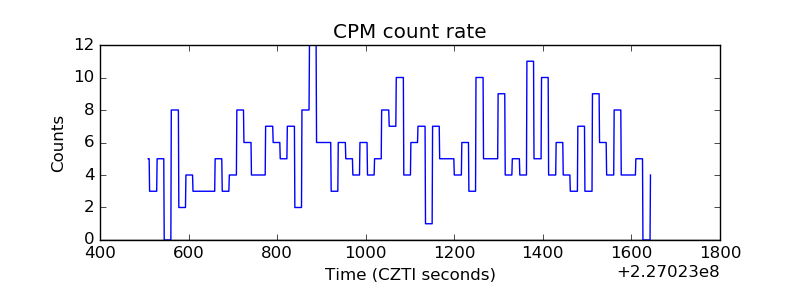 |
| CZT Counter | 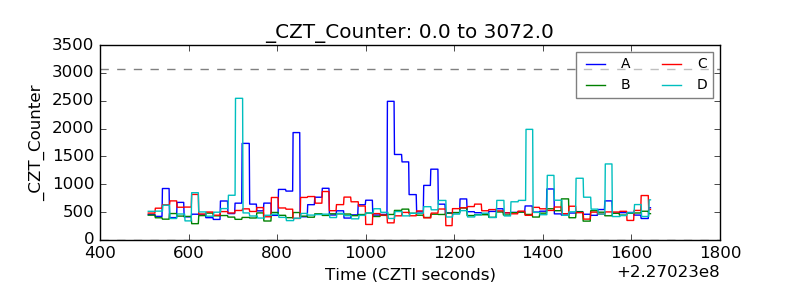 |
| +2.5 Volts monitor |  |
| +5 Volts monitor |  |
| _ROLL_ROT | 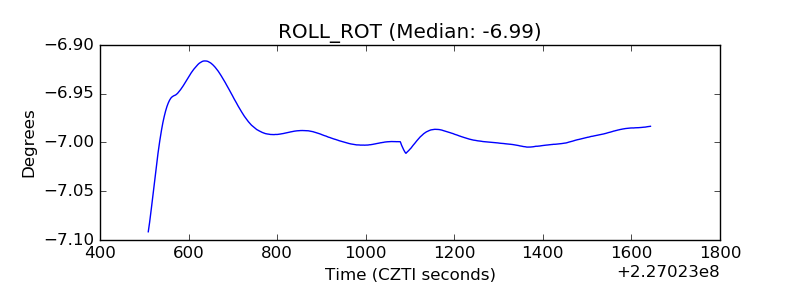 |
| _Roll_DEC | 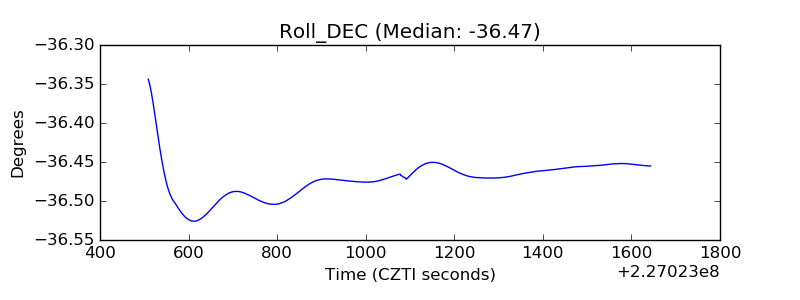 |
| _Roll_RA | 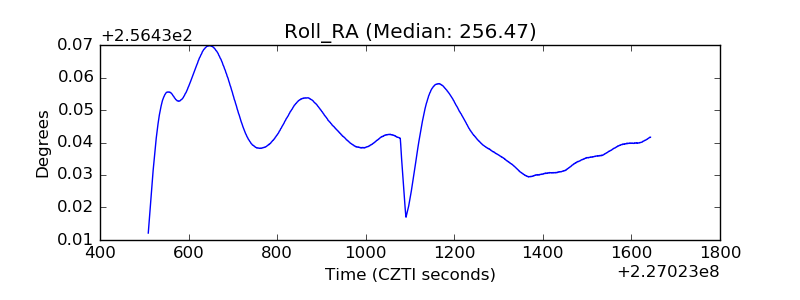 |
| Veto Counter | 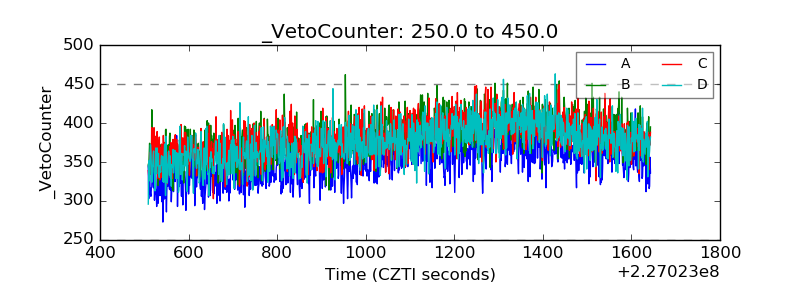 |