| Param | Original file | Final file |
|---|---|---|
| Filename | modeM0/AS1A02_071T01_9000001078_07868cztM0_level2.evt | modeM0/AS1A02_071T01_9000001078_07868cztM0_level2_quad_clean.evt |
| Size (bytes) | 1,024,441,920 | 176,256,000 |
| Size | 977.0 MB | 168.1 MB |
| Events in quadrant A | 7,302,753 | 1,102,652 |
| Events in quadrant B | 6,898,715 | 1,120,043 |
| Events in quadrant C | 8,000,291 | 1,102,099 |
| Events in quadrant D | 7,882,351 | 1,051,858 |
| Mode SS | |||
|---|---|---|---|
| Quadrant | BADHDUFLAG | Total packets | Discarded packets |
| A | 0 | 284 | 0 |
| B | 0 | 284 | 0 |
| C | 0 | 284 | 0 |
| D | 0 | 284 | 0 |
| Mode M0 | |||
|---|---|---|---|
| Quadrant | BADHDUFLAG | Total packets | Discarded packets |
| A | 0 | 31003 | 4 |
| B | 0 | 29684 | 3 |
| C | 0 | 33143 | 3 |
| D | 0 | 32694 | 3 |
| Mode M9 | |||
|---|---|---|---|
| Quadrant | BADHDUFLAG | Total packets | Discarded packets |
| A | 0 | 22 | 0 |
| B | 0 | 22 | 0 |
| C | 0 | 22 | 0 |
| D | 0 | 22 | 0 |
| Quadrant | Total seconds | Saturated seconds | Saturation percentage |
|---|---|---|---|
| A | 13923 | 260 | 1.867414% |
| B | 13923 | 231 | 1.659125% |
| C | 13923 | 221 | 1.587302% |
| D | 13923 | 262 | 1.881778% |
Noise dominated data is calculated using 1-second bins in cleaned event files. If a bin has >2000 counts, and if more than 50% of those come from <1% of pixels, then it is considered to be noise-dominated and hence unusable.
| Quadrant | # 1 sec bins | Bins with >0 counts | Bins with >2000 counts | High rate bins dominated by noise | Noise dominated (total time) | Noise dominated (detector-on time) | Marked lightcurve |
|---|---|---|---|---|---|---|---|
| A | 16108 | 13926 | 35 | 35 | 0.22% | 0.25% | 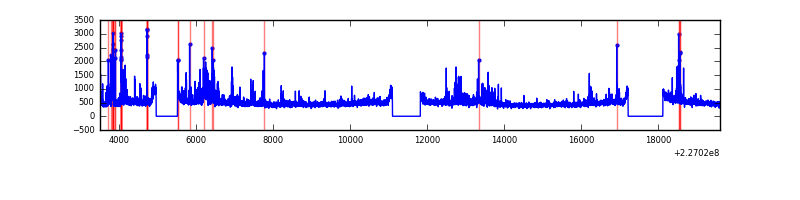 |
| B | 16108 | 13926 | 41 | 41 | 0.25% | 0.29% | 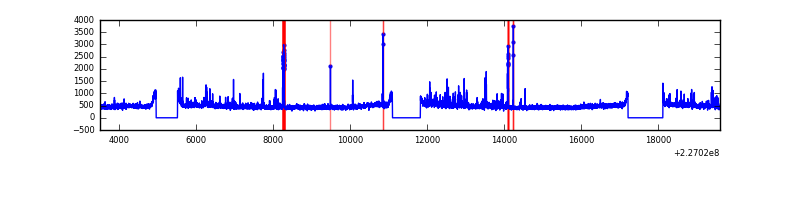 |
| C | 16108 | 13926 | 34 | 34 | 0.21% | 0.24% | 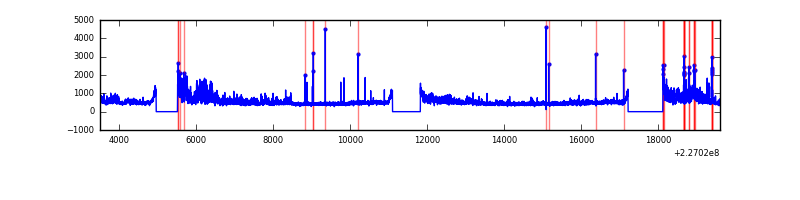 |
| D | 16108 | 13926 | 114 | 114 | 0.71% | 0.82% | 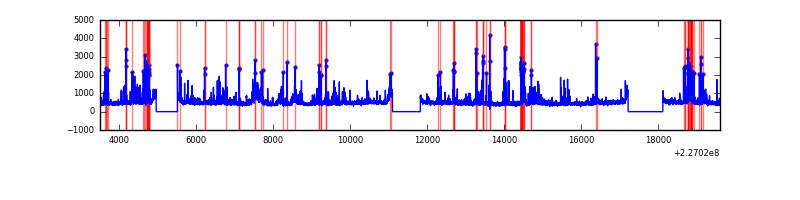 |
Top three noisy pixels from each quadrant. If the there are fewer than three noisy pixels in the level2.evt file, extra rows are filled as -1
| Pixel properties | Quadrant properties | ||||||
|---|---|---|---|---|---|---|---|
| Quadrant | DetID | PixID | Counts | Sigma | Mean | Median | Sigma |
| A | 15 | 239 | 838026 | 2513.39 | 1638 | 1601 | 332.8 |
| A | 13 | 248 | 52820 | 153.91 | 1638 | 1601 | 332.8 |
| A | 13 | 14 | 32820 | 93.81 | 1638 | 1601 | 332.8 |
| B | 4 | 239 | 242486 | 761.48 | 1652 | 1610 | 316.3 |
| B | 15 | 204 | 85054 | 263.79 | 1652 | 1610 | 316.3 |
| B | 4 | 173 | 83875 | 260.06 | 1652 | 1610 | 316.3 |
| C | 1 | 16 | 1610910 | 4364.91 | 1600 | 1612 | 368.7 |
| C | 8 | 229 | 143348 | 384.43 | 1600 | 1612 | 368.7 |
| C | 13 | 61 | 12244 | 28.84 | 1600 | 1612 | 368.7 |
| D | 1 | 52 | 795825 | 2036.17 | 1597 | 1549 | 390.1 |
| D | 2 | 152 | 293120 | 747.46 | 1597 | 1549 | 390.1 |
| D | 13 | 104 | 238188 | 606.64 | 1597 | 1549 | 390.1 |
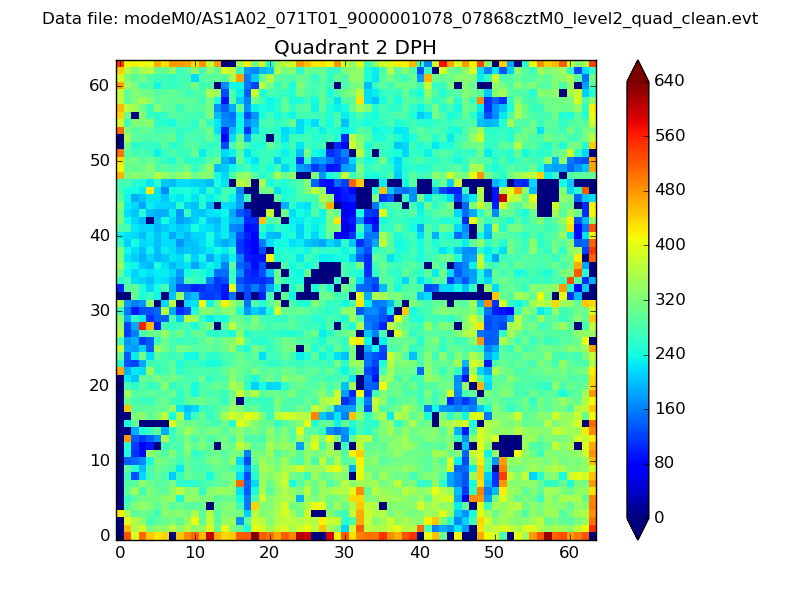
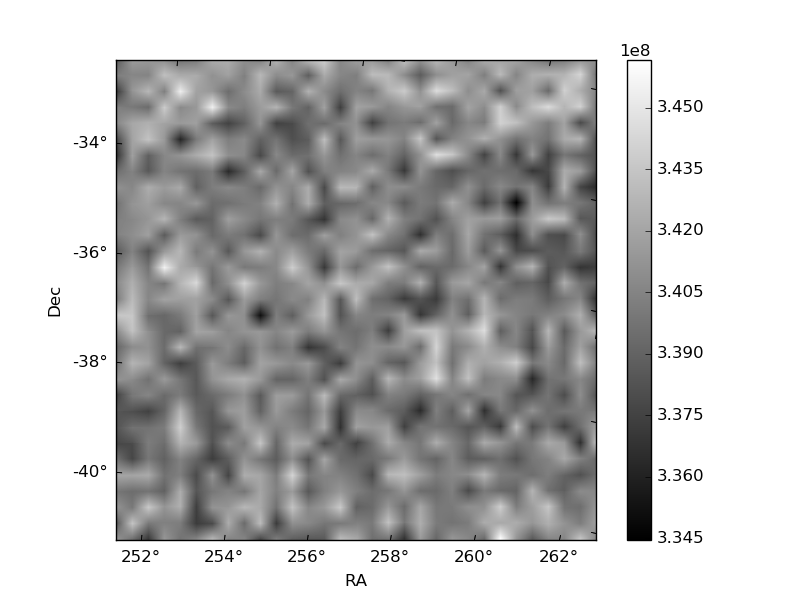
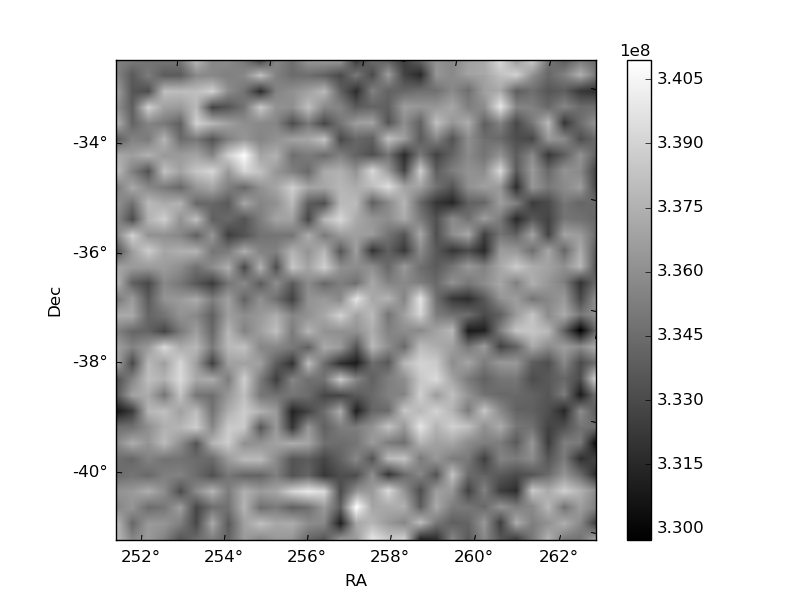
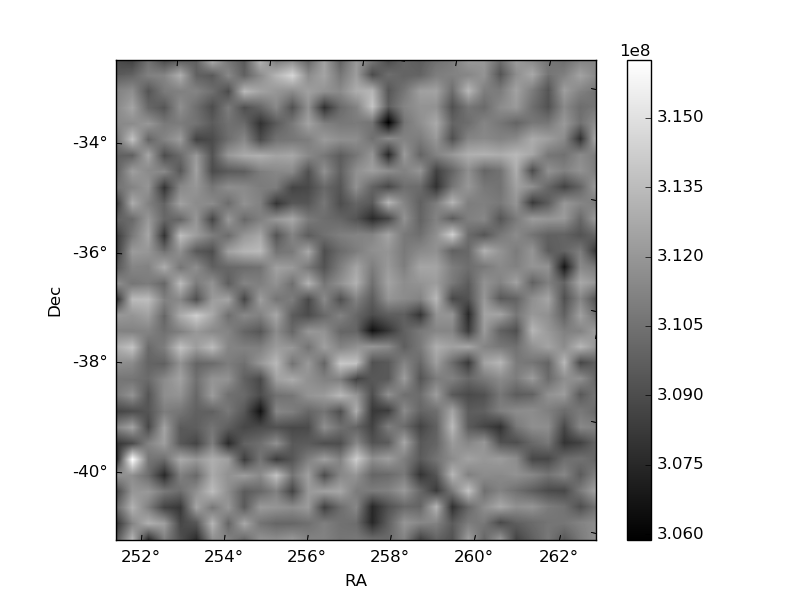
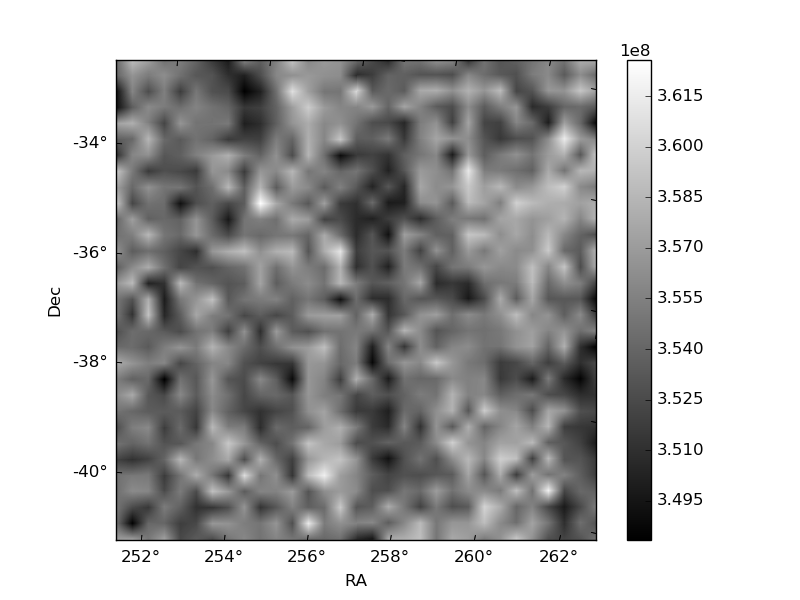
Histogram calculated using DETX and DETY for each event in the final _common_clean file
| Quadrant A | 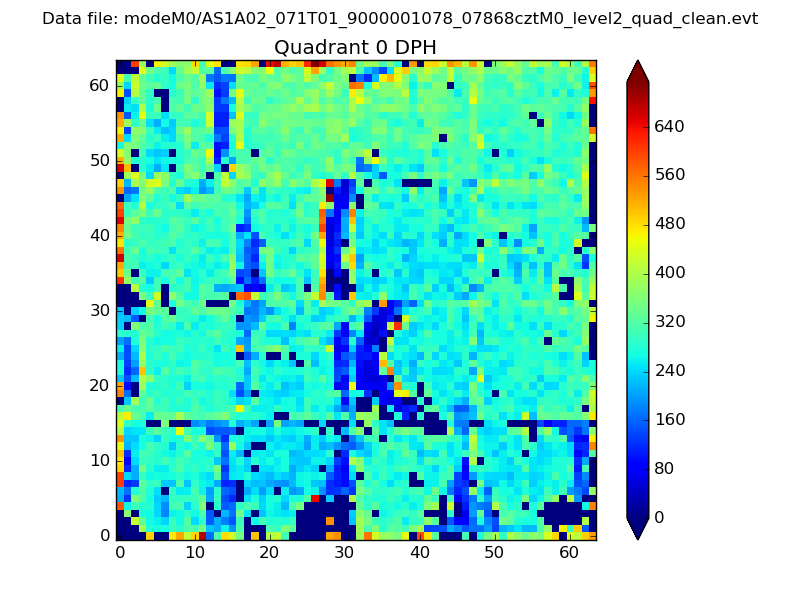 |
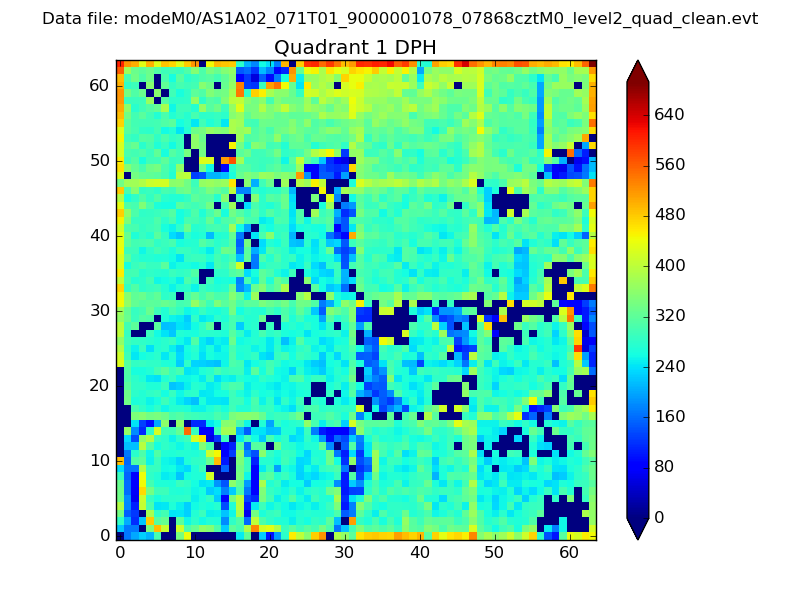 |
Quadrant B |
|---|---|---|---|
| Quadrant D | 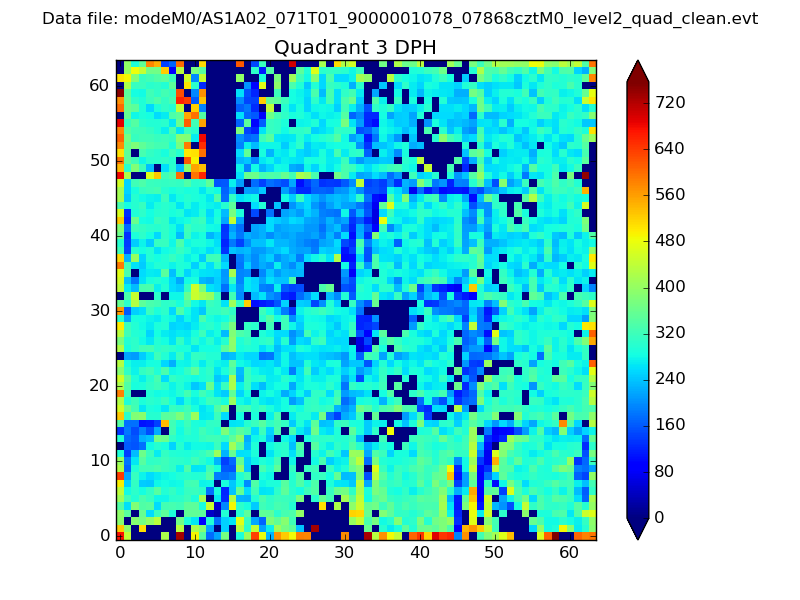 |
 |
Quadrant C |
| Plot type | Count rate plots | Images |
|---|---|---|
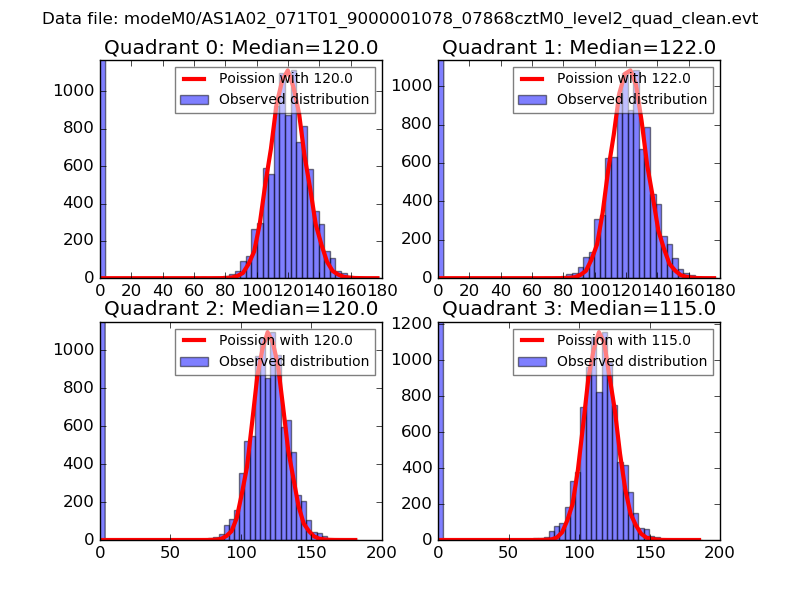
| Comparison with Poisson distribution Blue bars denote a histogram of data divided into 1 sec bins. Red curve is a Poisson curve with rate = median count rate of data. |
 |
 |
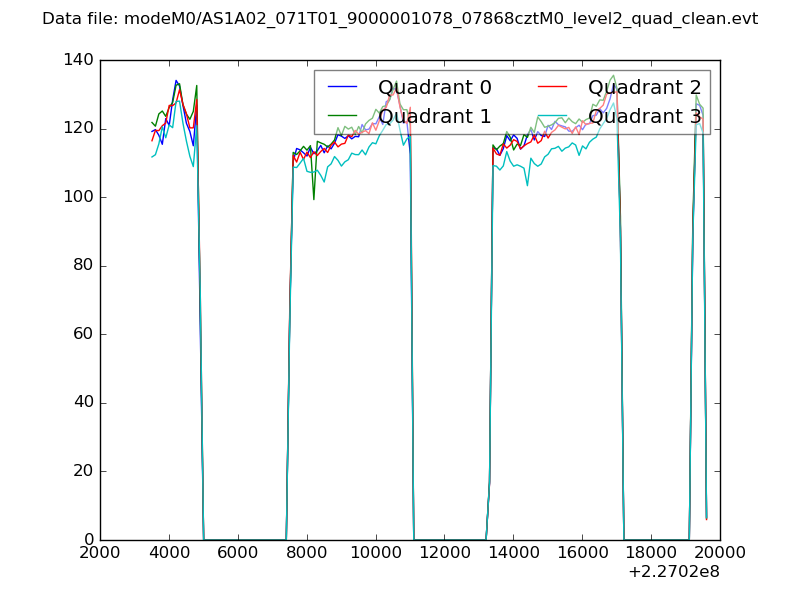
| Quadrant-wise count rates Data is divided into 100 sec bins |
 |
|
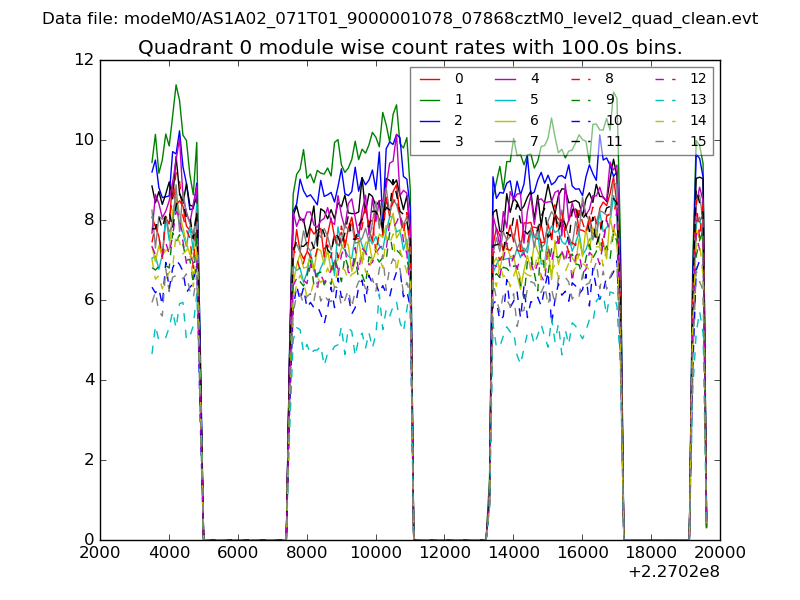
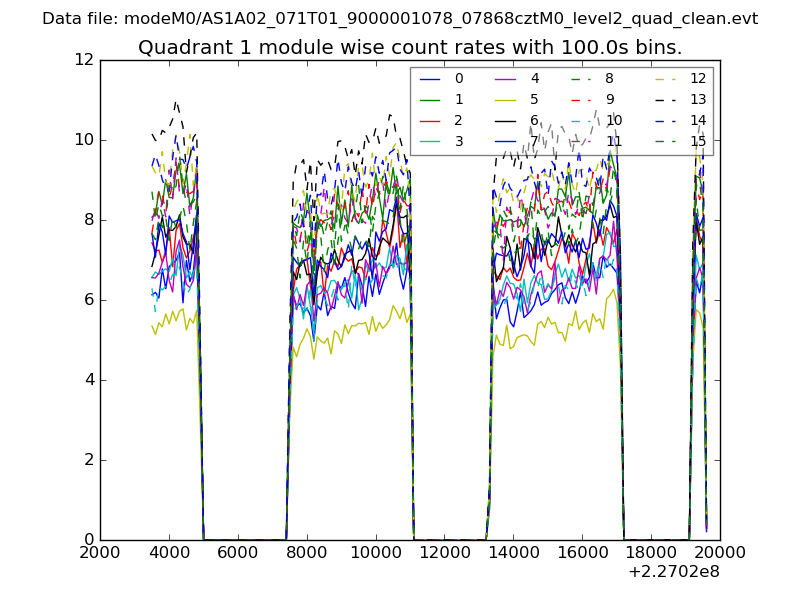
| Module-wise count rates for Quadrant A Data is divided into 100 sec bins |
 |
 |
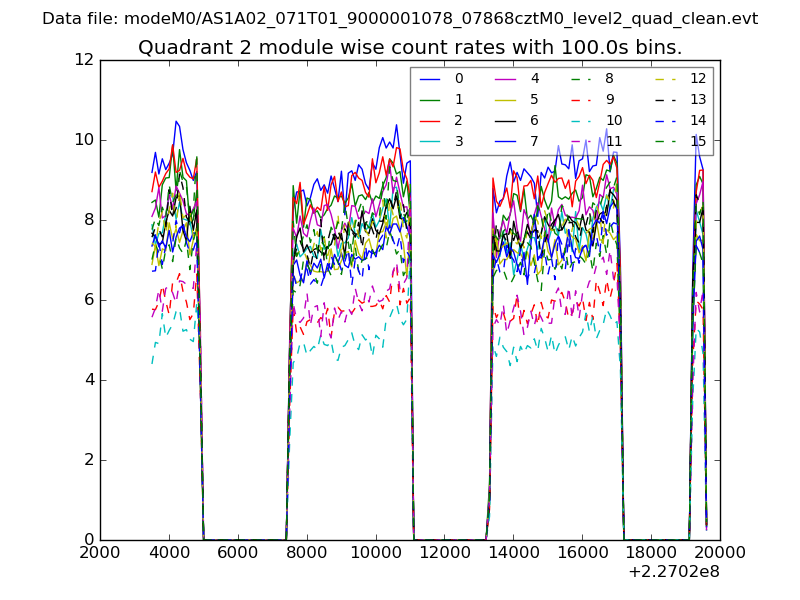
| Module-wise count rates for Quadrant B Data is divided into 100 sec bins |
 |
 |
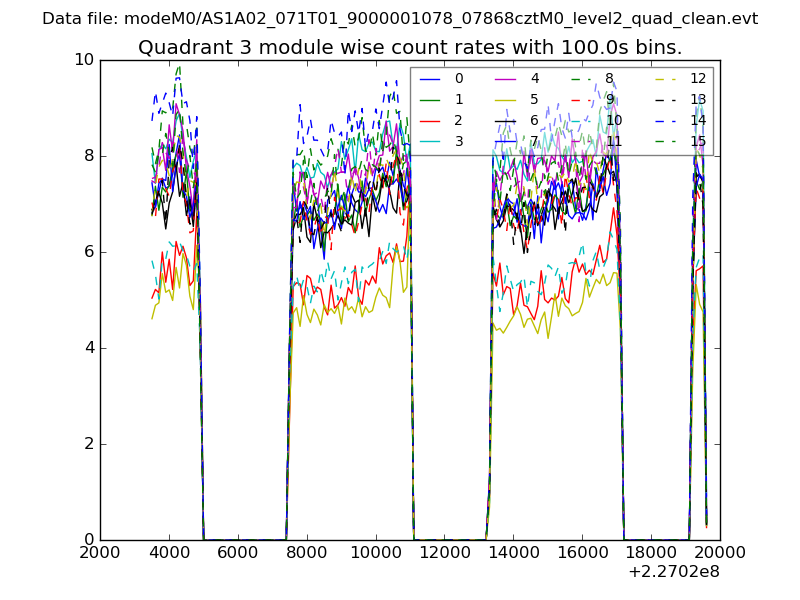
| Module-wise count rates for Quadrant C Data is divided into 100 sec bins |
 |
 |
| Module-wise count rates for Quadrant D Data is divided into 100 sec bins |
 |
 |
| Parameter | Plot |
|---|---|
| CZT HV Monitor | 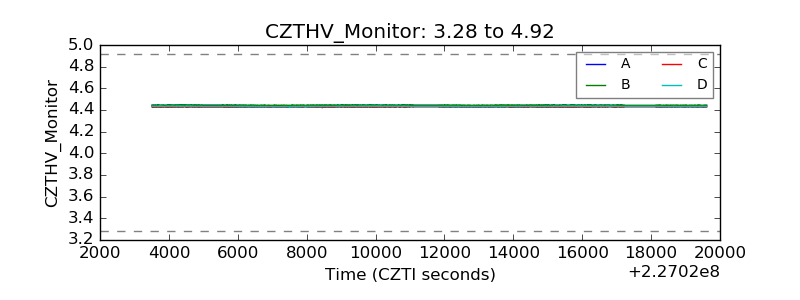 |
| D_VDD | 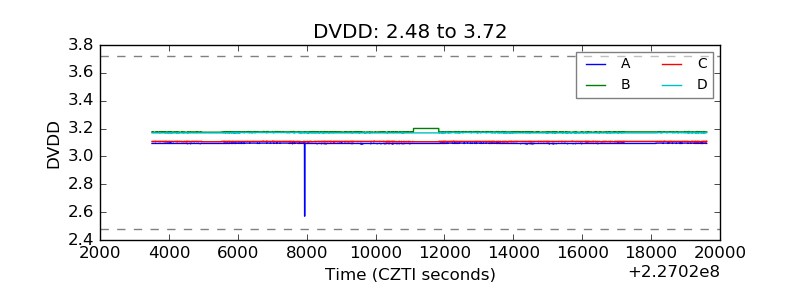 |
| Temperature 1 | 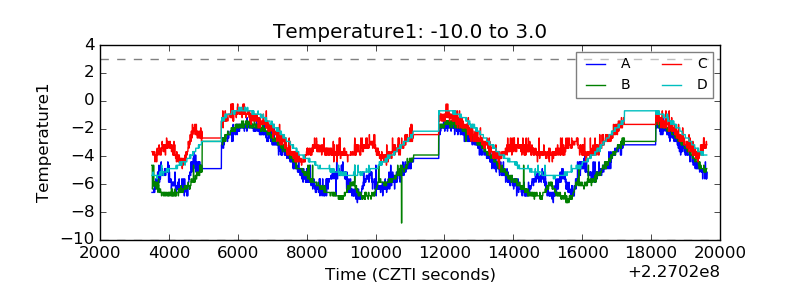 |
| Veto HV Monitor | 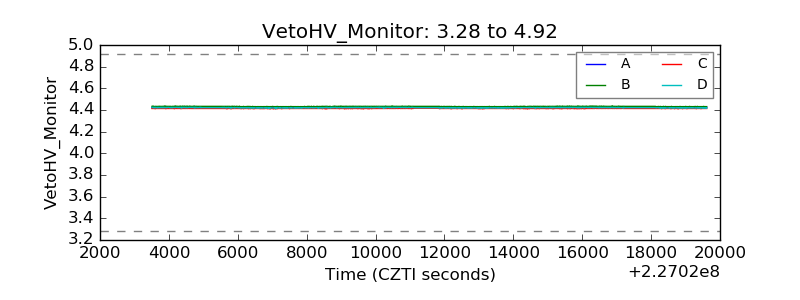 |
| Veto LLD | 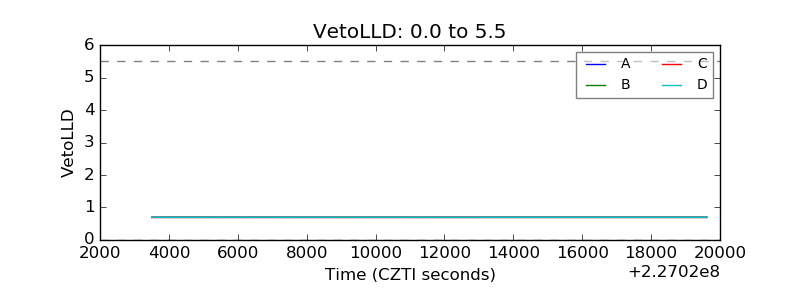 |
| Alpha Counter | 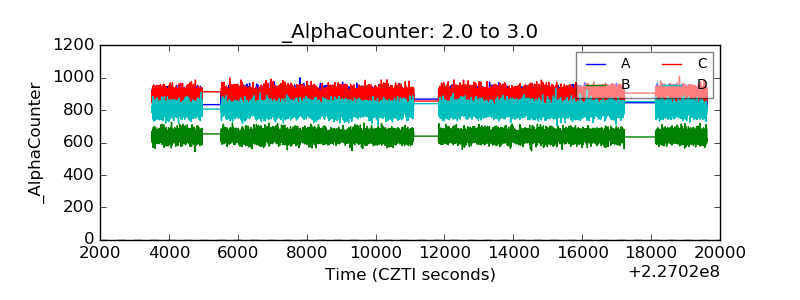 |
| _CPM_Rate | 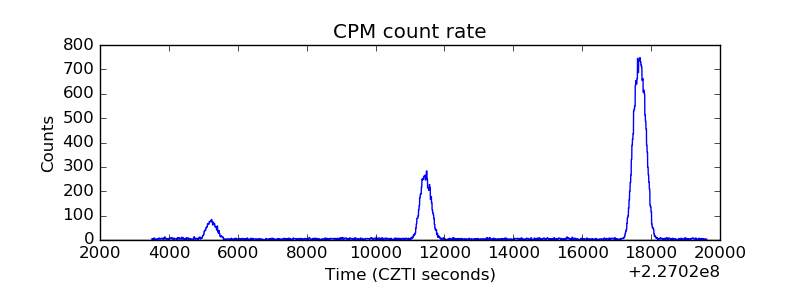 |
| CZT Counter | 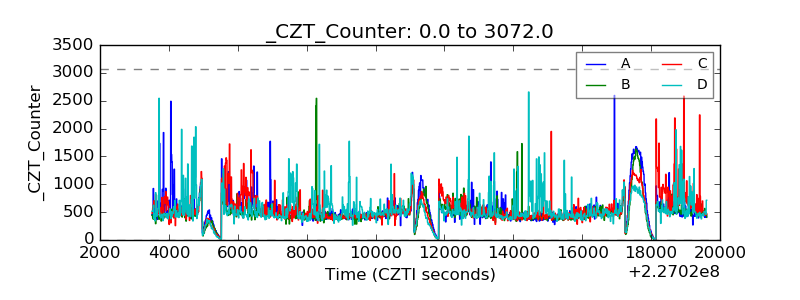 |
| +2.5 Volts monitor |  |
| +5 Volts monitor |  |
| _ROLL_ROT | 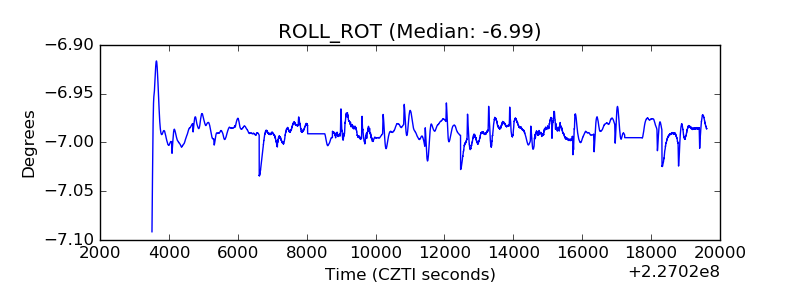 |
| _Roll_DEC | 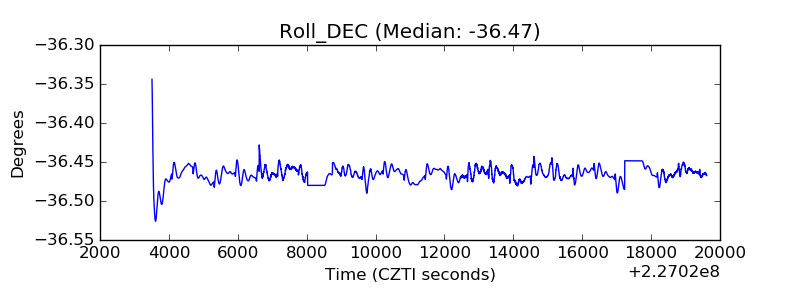 |
| _Roll_RA | 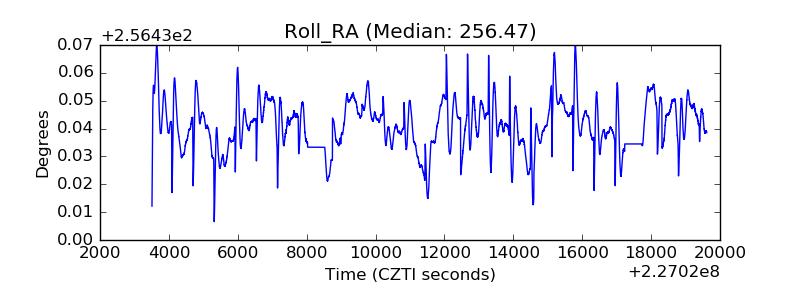 |
| Veto Counter | 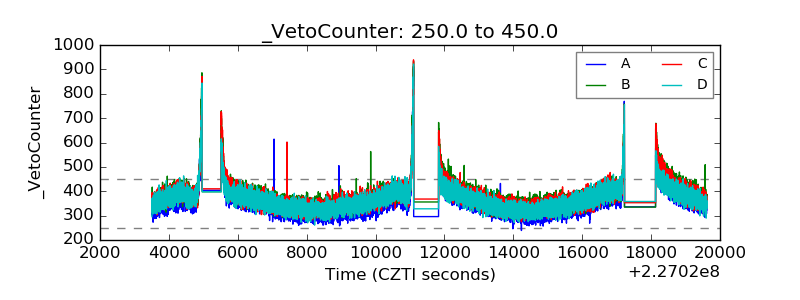 |