| Param | Original file | Final file |
|---|---|---|
| Filename | modeM0/AS1A02_071T01_9000001078_07869cztM0_level2.evt | modeM0/AS1A02_071T01_9000001078_07869cztM0_level2_quad_clean.evt |
| Size (bytes) | 485,271,360 | 87,059,520 |
| Size | 462.8 MB | 83.0 MB |
| Events in quadrant A | 3,329,298 | 548,198 |
| Events in quadrant B | 3,446,271 | 557,540 |
| Events in quadrant C | 4,112,799 | 545,261 |
| Events in quadrant D | 3,356,588 | 521,811 |
| Mode SS | |||
|---|---|---|---|
| Quadrant | BADHDUFLAG | Total packets | Discarded packets |
| A | 0 | 134 | 0 |
| B | 0 | 134 | 0 |
| C | 0 | 134 | 0 |
| D | 0 | 134 | 0 |
| Mode M0 | |||
|---|---|---|---|
| Quadrant | BADHDUFLAG | Total packets | Discarded packets |
| A | 0 | 14459 | 3 |
| B | 0 | 14620 | 2 |
| C | 0 | 16942 | 2 |
| D | 0 | 14606 | 2 |
| Mode M9 | |||
|---|---|---|---|
| Quadrant | BADHDUFLAG | Total packets | Discarded packets |
| A | 0 | 14 | 0 |
| B | 0 | 14 | 0 |
| C | 0 | 14 | 0 |
| D | 0 | 15 | 0 |
| Quadrant | Total seconds | Saturated seconds | Saturation percentage |
|---|---|---|---|
| A | 6652 | 100 | 1.503307% |
| B | 6652 | 124 | 1.864101% |
| C | 6652 | 142 | 2.134696% |
| D | 6652 | 66 | 0.992183% |
Noise dominated data is calculated using 1-second bins in cleaned event files. If a bin has >2000 counts, and if more than 50% of those come from <1% of pixels, then it is considered to be noise-dominated and hence unusable.
| Quadrant | # 1 sec bins | Bins with >0 counts | Bins with >2000 counts | High rate bins dominated by noise | Noise dominated (total time) | Noise dominated (detector-on time) | Marked lightcurve |
|---|---|---|---|---|---|---|---|
| A | 7682 | 6653 | 11 | 11 | 0.14% | 0.17% | 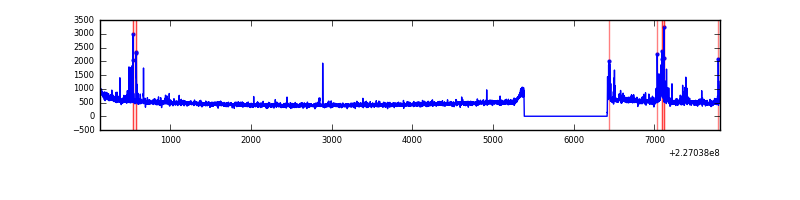 |
| B | 7682 | 6653 | 47 | 47 | 0.61% | 0.71% | 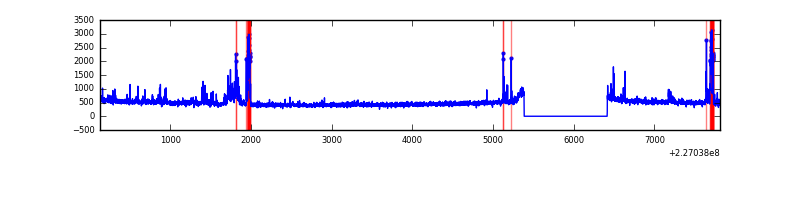 |
| C | 7682 | 6653 | 43 | 43 | 0.56% | 0.65% | 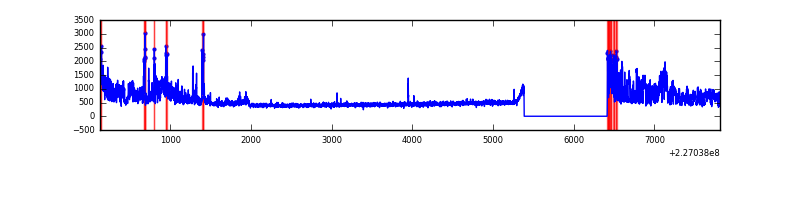 |
| D | 7682 | 6653 | 27 | 27 | 0.35% | 0.41% | 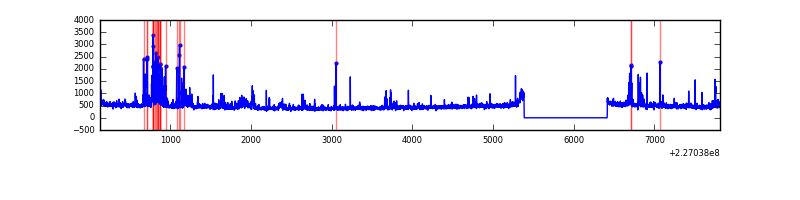 |
Top three noisy pixels from each quadrant. If the there are fewer than three noisy pixels in the level2.evt file, extra rows are filled as -1
| Pixel properties | Quadrant properties | ||||||
|---|---|---|---|---|---|---|---|
| Quadrant | DetID | PixID | Counts | Sigma | Mean | Median | Sigma |
| A | 15 | 239 | 229262 | 1420.33 | 794 | 778 | 160.9 |
| A | 2 | 79 | 12381 | 72.13 | 794 | 778 | 160.9 |
| A | 3 | 1 | 11346 | 65.69 | 794 | 778 | 160.9 |
| B | 4 | 239 | 204444 | 1324.68 | 801 | 782 | 153.7 |
| B | 4 | 81 | 76932 | 495.3 | 801 | 782 | 153.7 |
| B | 15 | 204 | 39295 | 250.5 | 801 | 782 | 153.7 |
| C | 1 | 16 | 1002321 | 5615.77 | 769 | 772 | 178.3 |
| C | 8 | 229 | 100569 | 559.57 | 769 | 772 | 178.3 |
| C | 10 | 22 | 10863 | 56.58 | 769 | 772 | 178.3 |
| D | 12 | 233 | 173196 | 916.21 | 767 | 745 | 188.2 |
| D | 7 | 71 | 95369 | 502.73 | 767 | 745 | 188.2 |
| D | 1 | 52 | 77106 | 405.7 | 767 | 745 | 188.2 |
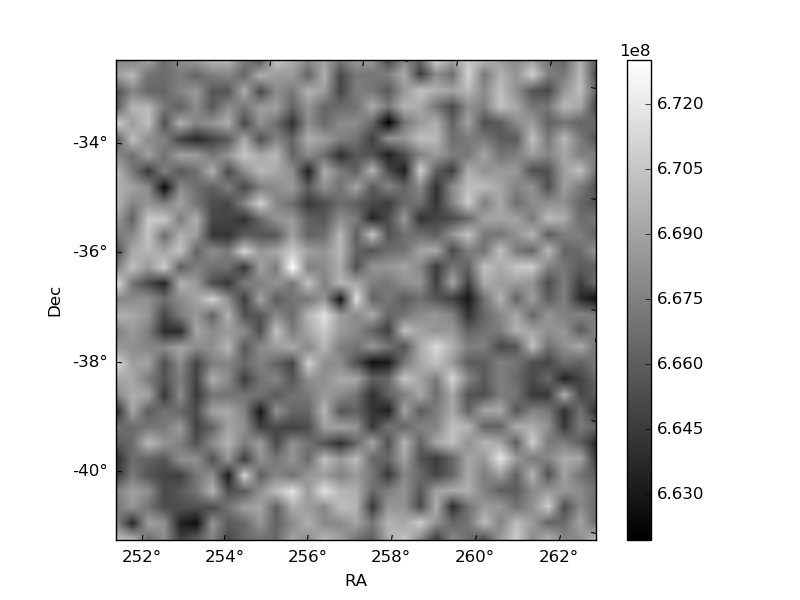
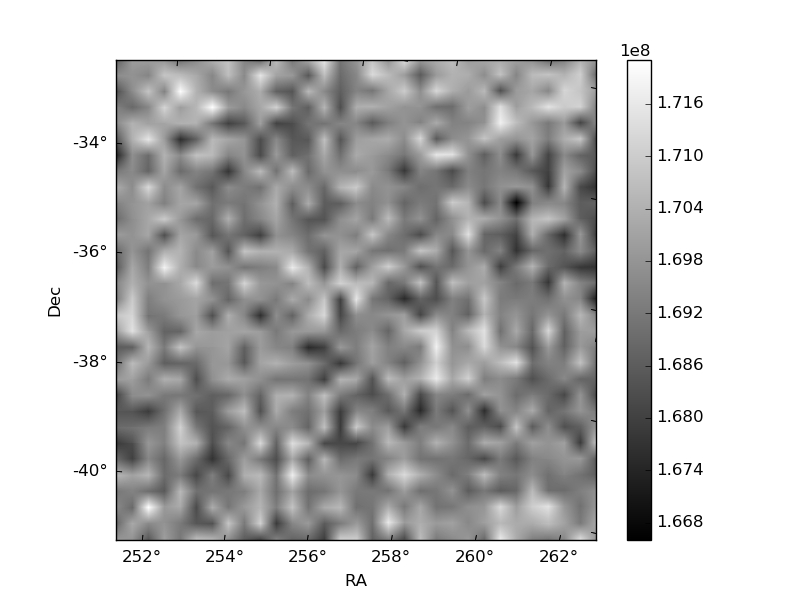
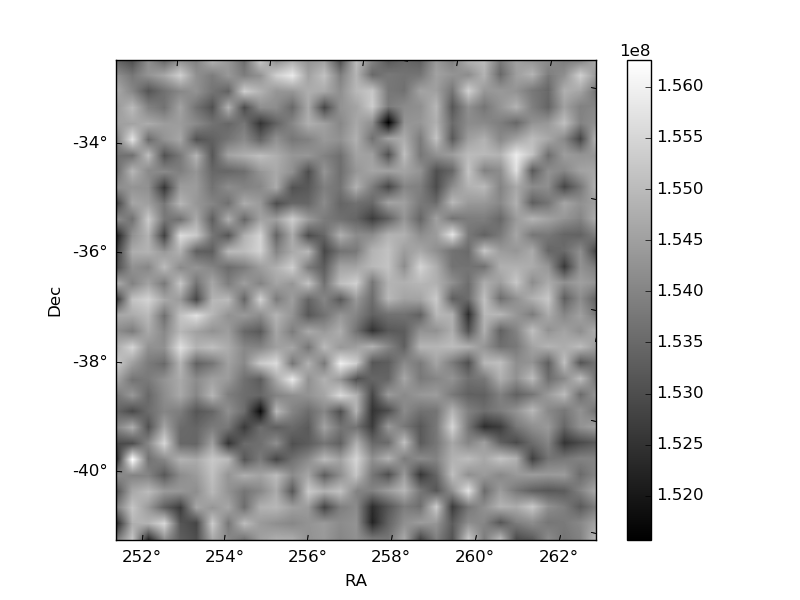
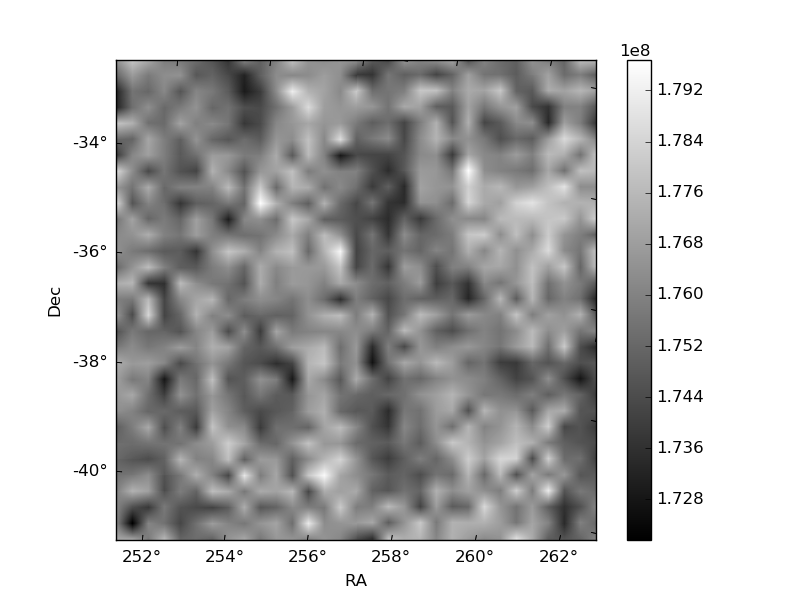
Histogram calculated using DETX and DETY for each event in the final _common_clean file
| Quadrant A | 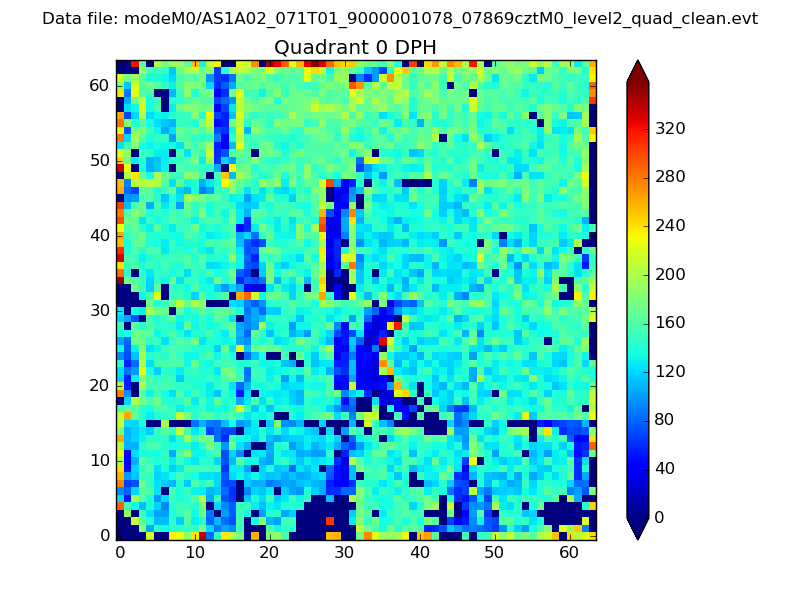 |
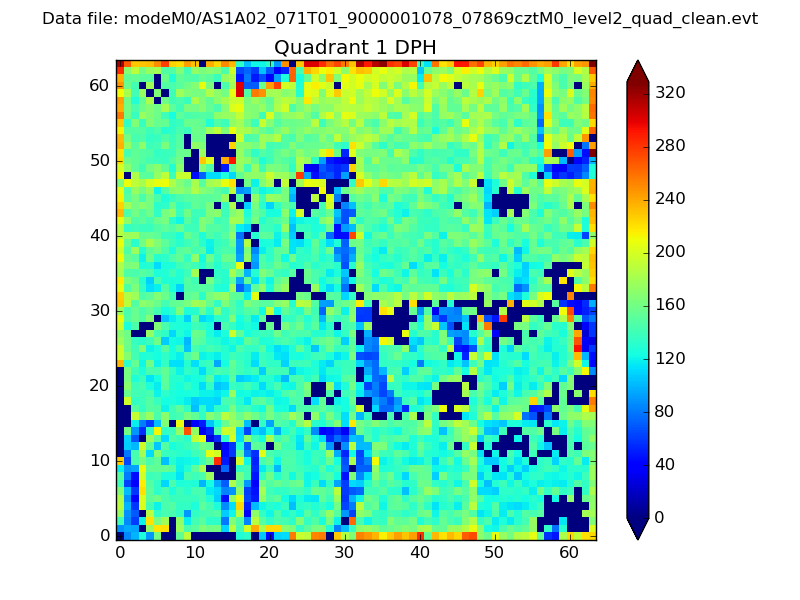 |
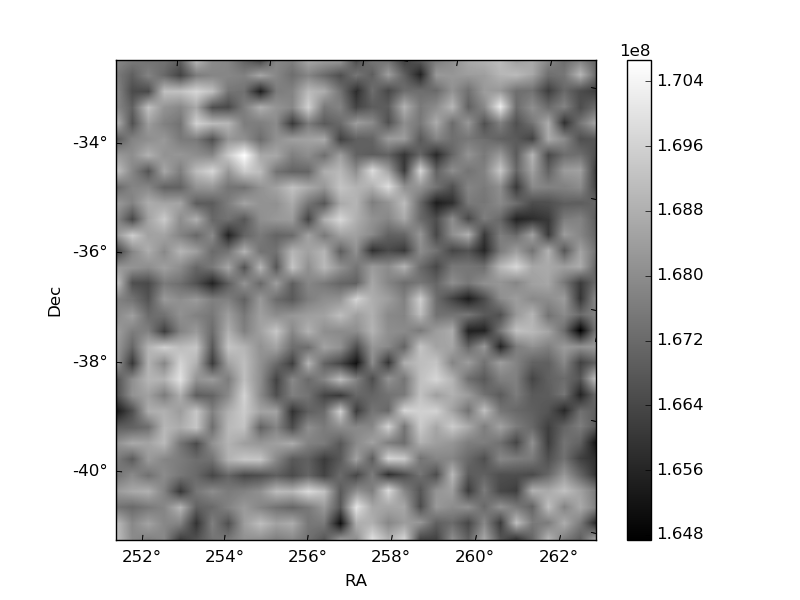
Quadrant B |
|---|---|---|---|
| Quadrant D | 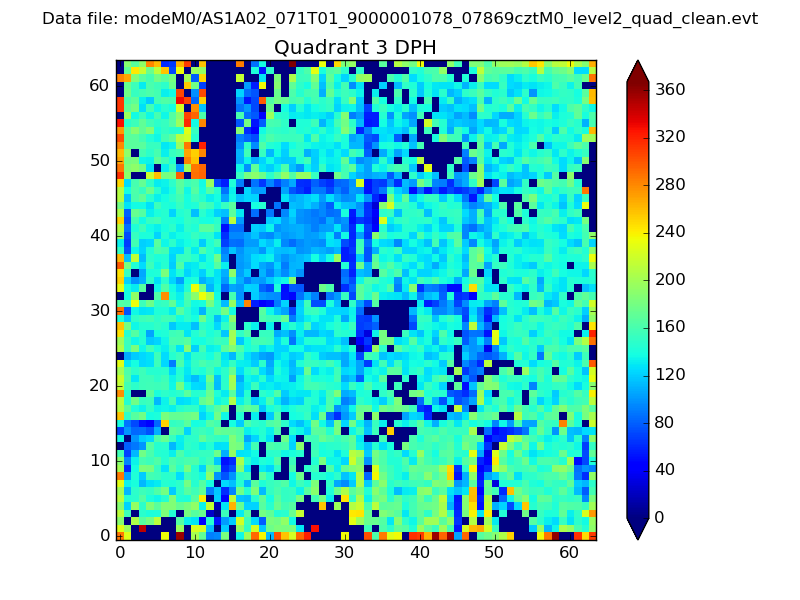 |
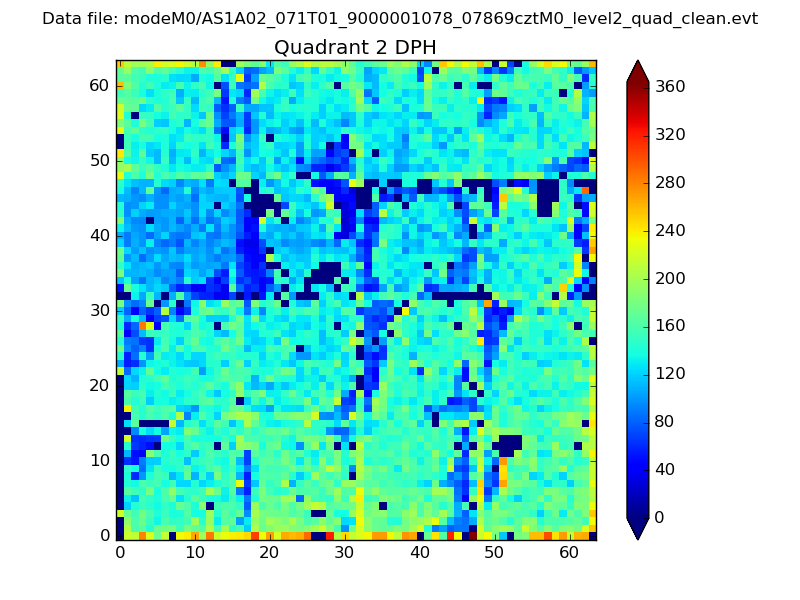 |
Quadrant C |
| Plot type | Count rate plots | Images |
|---|---|---|
| Comparison with Poisson distribution Blue bars denote a histogram of data divided into 1 sec bins. Red curve is a Poisson curve with rate = median count rate of data. |
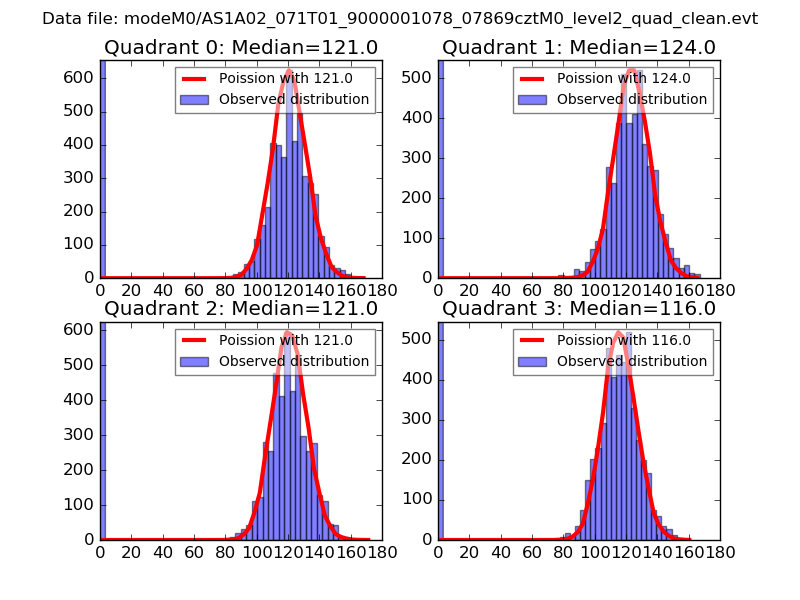 |
 |
| Quadrant-wise count rates Data is divided into 100 sec bins |
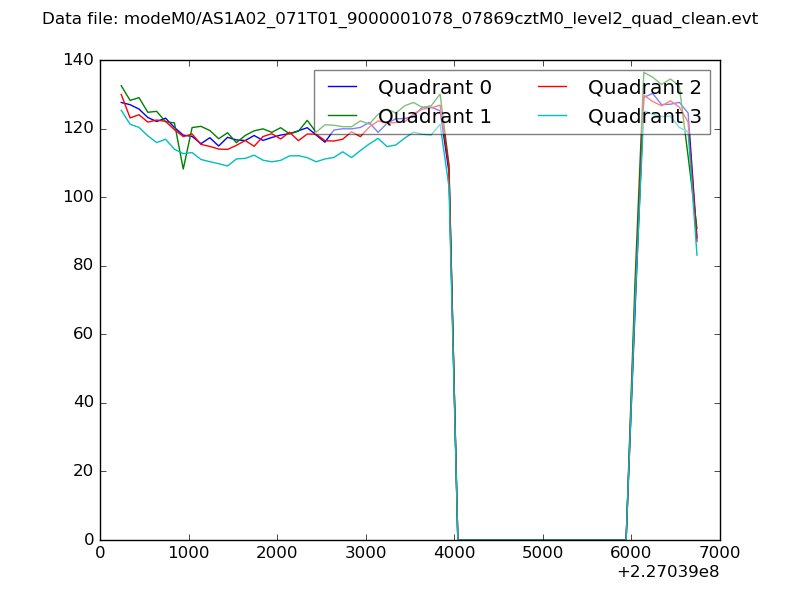 |
|
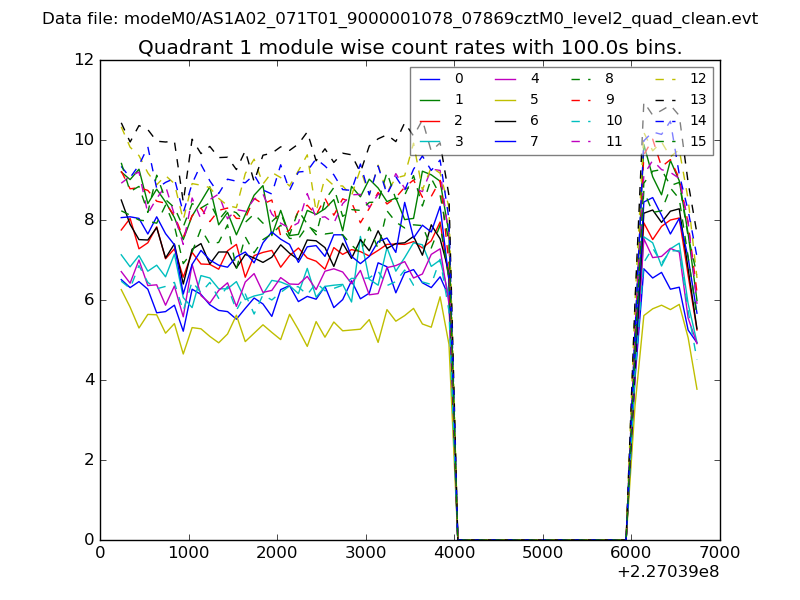
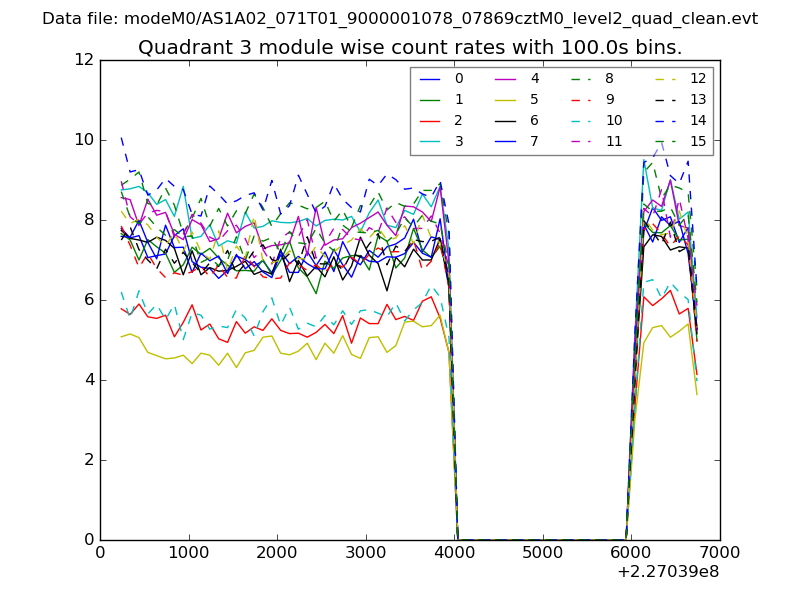
| Module-wise count rates for Quadrant A Data is divided into 100 sec bins |
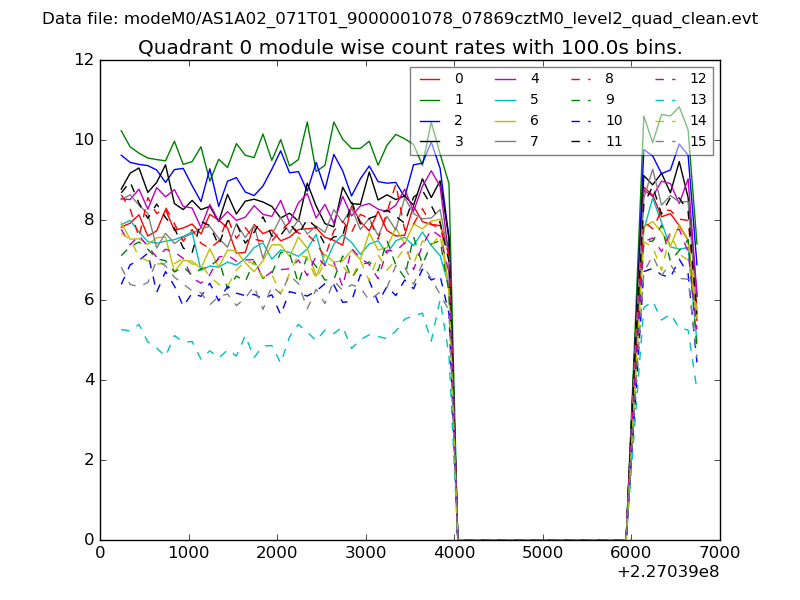 |
 |
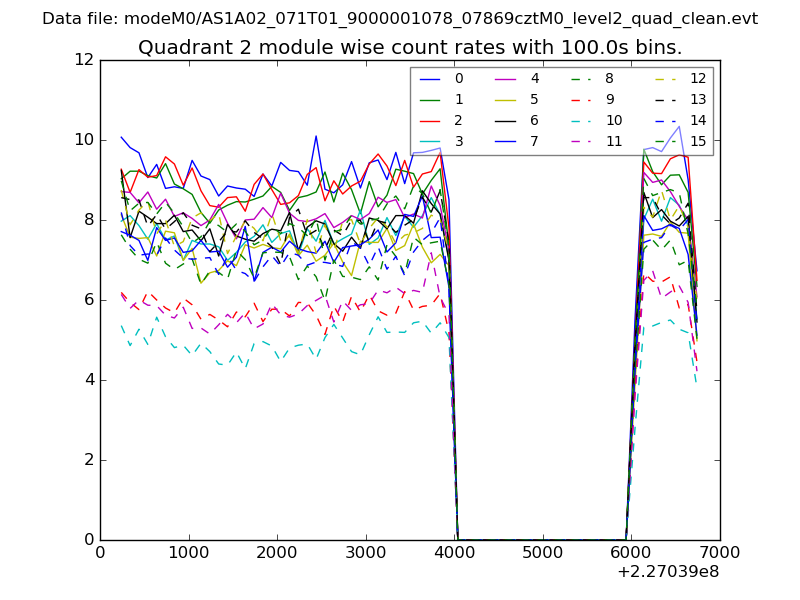
| Module-wise count rates for Quadrant B Data is divided into 100 sec bins |
 |
 |
| Module-wise count rates for Quadrant C Data is divided into 100 sec bins |
 |
 |
| Module-wise count rates for Quadrant D Data is divided into 100 sec bins |
 |
 |
| Parameter | Plot |
|---|---|
| CZT HV Monitor | 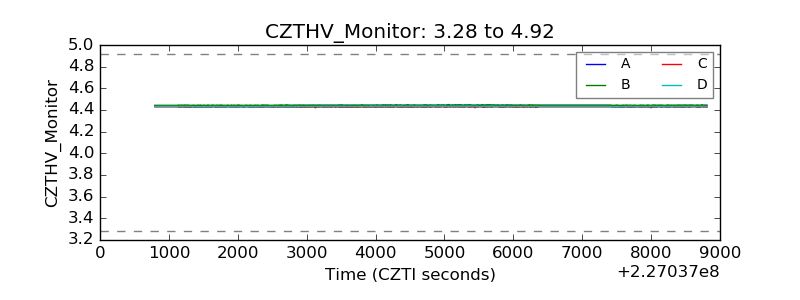 |
| D_VDD | 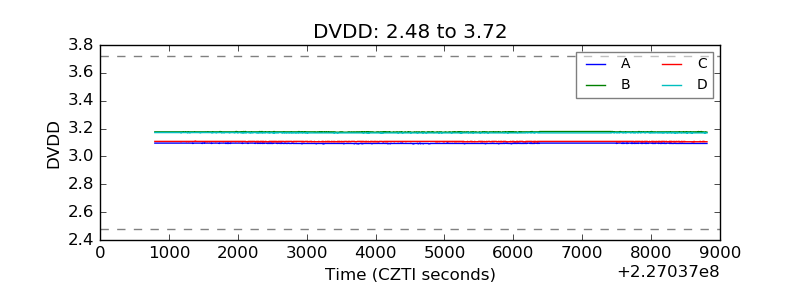 |
| Temperature 1 | 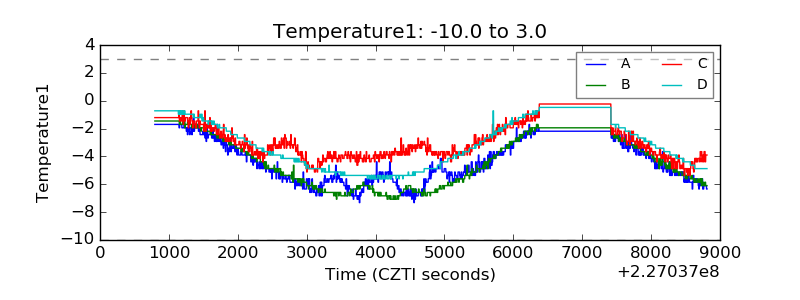 |
| Veto HV Monitor | 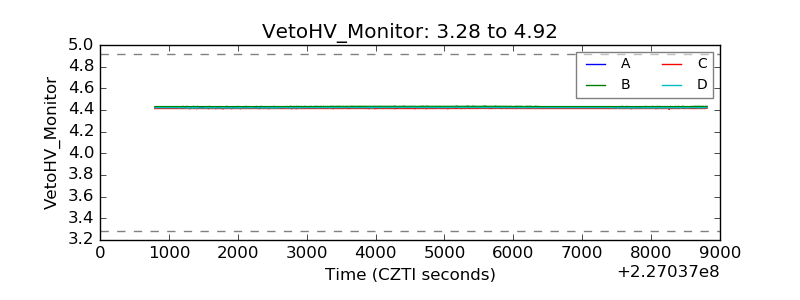 |
| Veto LLD | 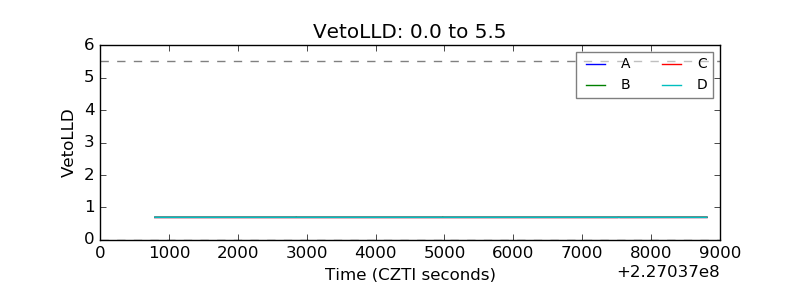 |
| Alpha Counter | 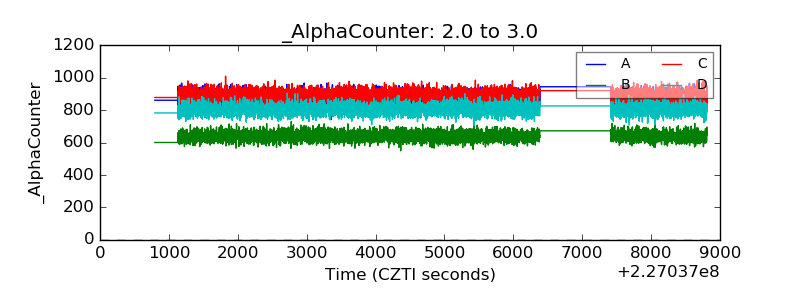 |
| _CPM_Rate | 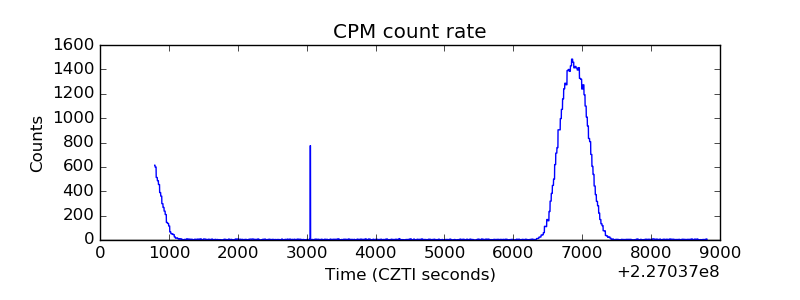 |
| CZT Counter | 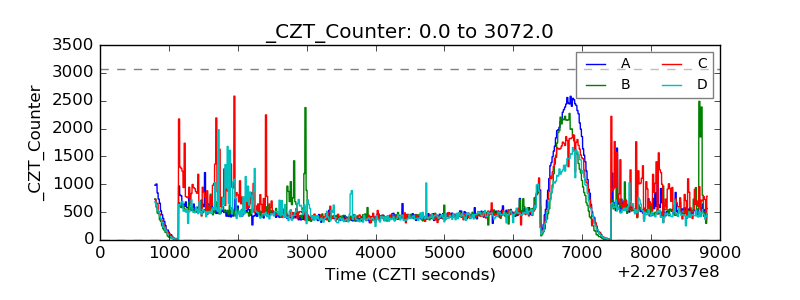 |
| +2.5 Volts monitor |  |
| +5 Volts monitor |  |
| _ROLL_ROT | 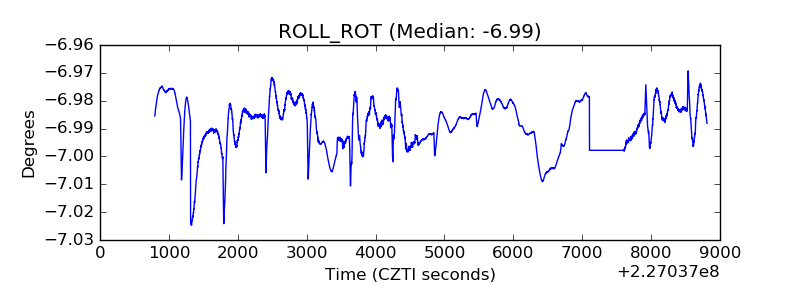 |
| _Roll_DEC | 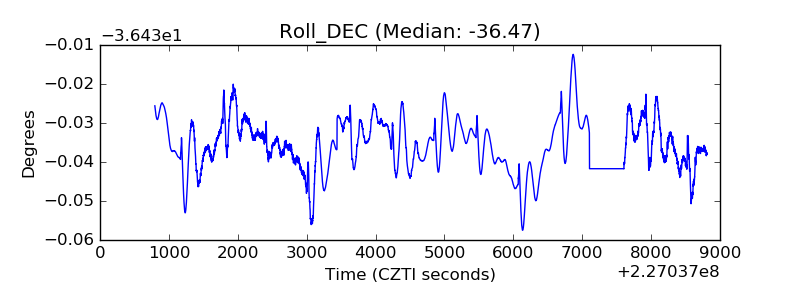 |
| _Roll_RA | 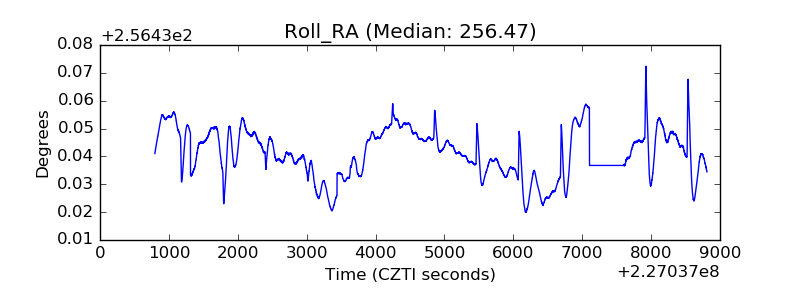 |
| Veto Counter | 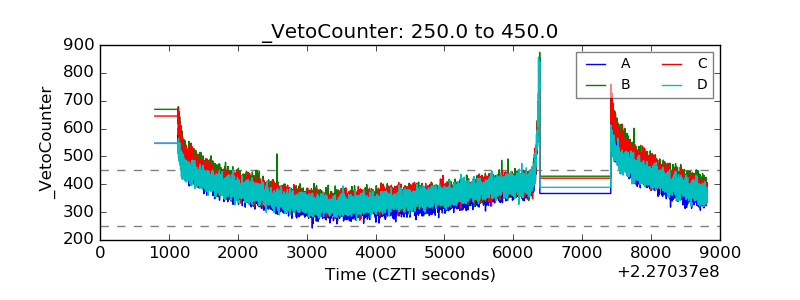 |