| Param | Original file | Final file |
|---|---|---|
| Filename | modeM0/AS1A02_071T01_9000001078_07873cztM0_level2.evt | modeM0/AS1A02_071T01_9000001078_07873cztM0_level2_quad_clean.evt |
| Size (bytes) | 469,857,600 | 102,830,400 |
| Size | 448.1 MB | 98.1 MB |
| Events in quadrant A | 3,314,230 | 668,035 |
| Events in quadrant B | 3,426,819 | 693,299 |
| Events in quadrant C | 3,967,529 | 675,489 |
| Events in quadrant D | 3,094,360 | 638,914 |
| Mode SS | |||
|---|---|---|---|
| Quadrant | BADHDUFLAG | Total packets | Discarded packets |
| A | 0 | 128 | 0 |
| B | 0 | 128 | 0 |
| C | 0 | 128 | 0 |
| D | 0 | 128 | 0 |
| Mode M0 | |||
|---|---|---|---|
| Quadrant | BADHDUFLAG | Total packets | Discarded packets |
| A | 0 | 13730 | 3 |
| B | 0 | 14144 | 2 |
| C | 0 | 16022 | 2 |
| D | 0 | 13481 | 2 |
| Mode M9 | |||
|---|---|---|---|
| Quadrant | BADHDUFLAG | Total packets | Discarded packets |
| A | 0 | 13 | 0 |
| B | 0 | 13 | 0 |
| C | 0 | 13 | 0 |
| D | 0 | 13 | 0 |
| Quadrant | Total seconds | Saturated seconds | Saturation percentage |
|---|---|---|---|
| A | 6283 | 44 | 0.700302% |
| B | 6283 | 156 | 2.482890% |
| C | 6283 | 77 | 1.225529% |
| D | 6284 | 40 | 0.636537% |
Noise dominated data is calculated using 1-second bins in cleaned event files. If a bin has >2000 counts, and if more than 50% of those come from <1% of pixels, then it is considered to be noise-dominated and hence unusable.
| Quadrant | # 1 sec bins | Bins with >0 counts | Bins with >2000 counts | High rate bins dominated by noise | Noise dominated (total time) | Noise dominated (detector-on time) | Marked lightcurve |
|---|---|---|---|---|---|---|---|
| A | 7553 | 6284 | 2 | 2 | 0.03% | 0.03% | 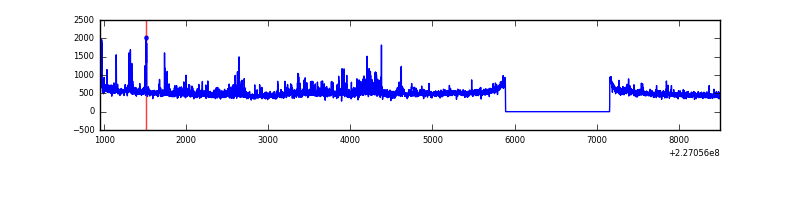 |
| B | 7553 | 6284 | 51 | 51 | 0.68% | 0.81% | 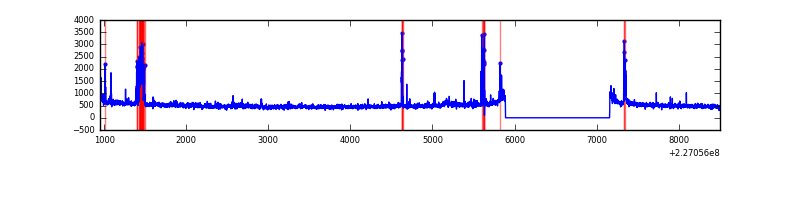 |
| C | 7553 | 6284 | 11 | 11 | 0.15% | 0.18% | 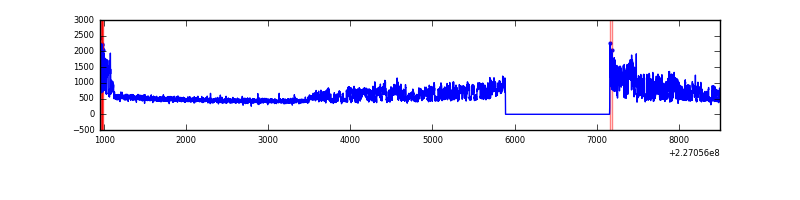 |
| D | 7554 | 6285 | 29 | 29 | 0.38% | 0.46% | 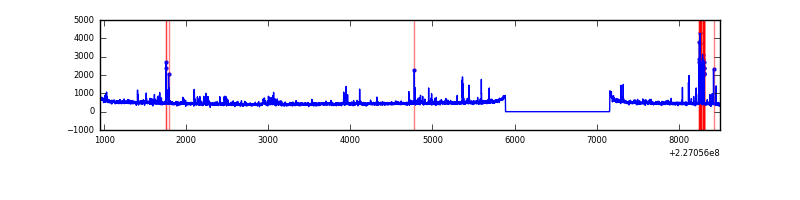 |
Top three noisy pixels from each quadrant. If the there are fewer than three noisy pixels in the level2.evt file, extra rows are filled as -1
| Pixel properties | Quadrant properties | ||||||
|---|---|---|---|---|---|---|---|
| Quadrant | DetID | PixID | Counts | Sigma | Mean | Median | Sigma |
| A | 15 | 239 | 332312 | 2128.87 | 768 | 752 | 155.7 |
| A | 3 | 1 | 8669 | 50.83 | 768 | 752 | 155.7 |
| A | 13 | 14 | 8010 | 46.6 | 768 | 752 | 155.7 |
| B | 4 | 239 | 240262 | 1637.39 | 783 | 766 | 146.3 |
| B | 4 | 97 | 73319 | 496.03 | 783 | 766 | 146.3 |
| B | 4 | 81 | 29757 | 198.21 | 783 | 766 | 146.3 |
| C | 1 | 16 | 977185 | 5548.86 | 763 | 768 | 176.0 |
| C | 13 | 61 | 5865 | 28.96 | 763 | 768 | 176.0 |
| C | 14 | 67 | 5859 | 28.93 | 763 | 768 | 176.0 |
| D | 2 | 14 | 94390 | 515.54 | 749 | 727 | 181.7 |
| D | 1 | 52 | 68831 | 374.86 | 749 | 727 | 181.7 |
| D | 13 | 104 | 23120 | 123.25 | 749 | 727 | 181.7 |
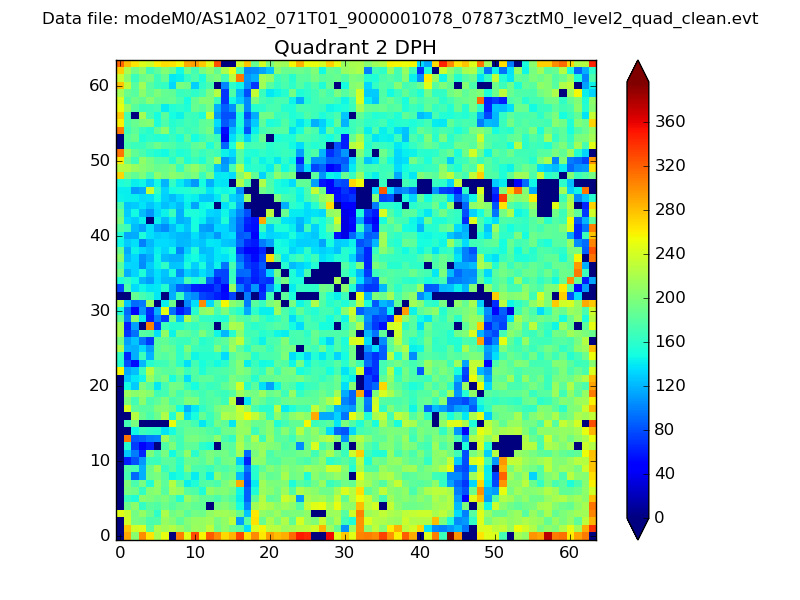
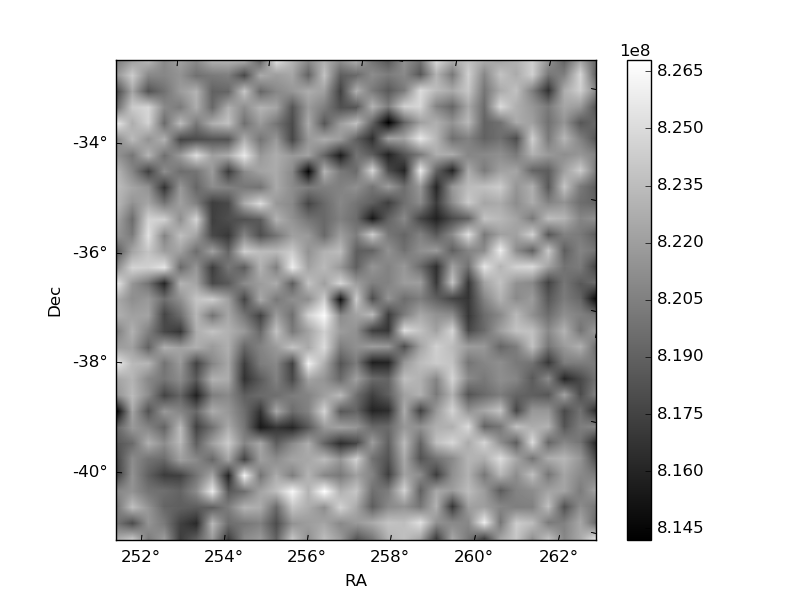
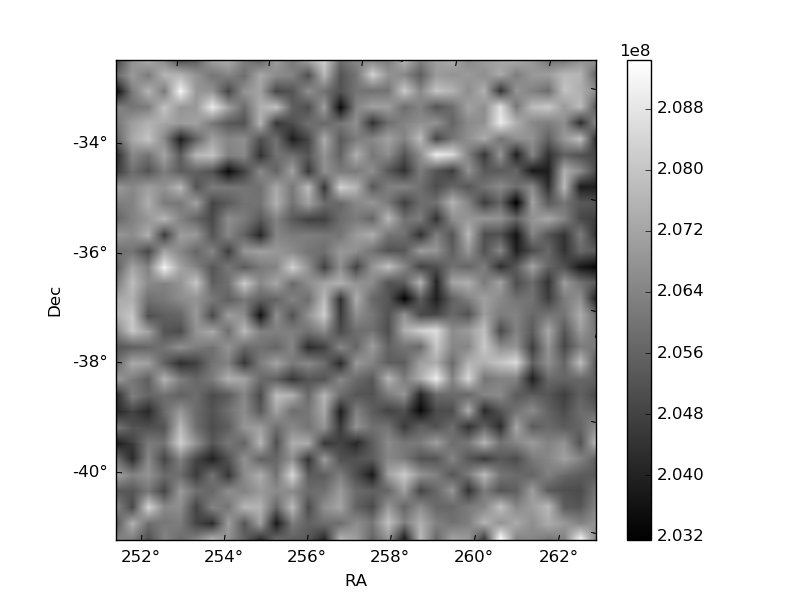
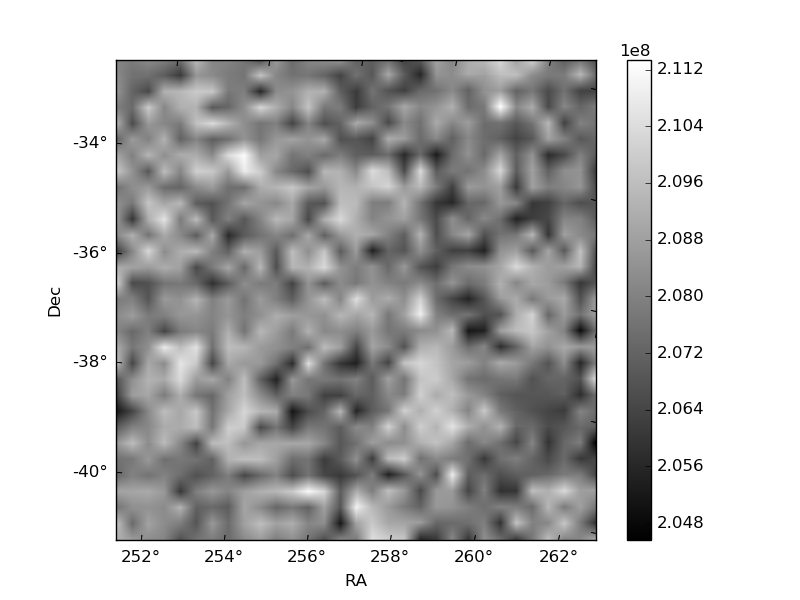
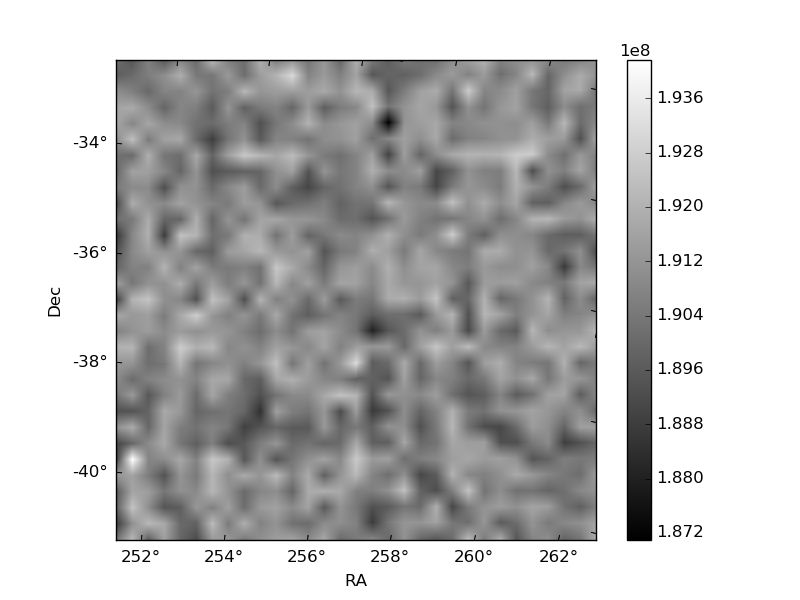
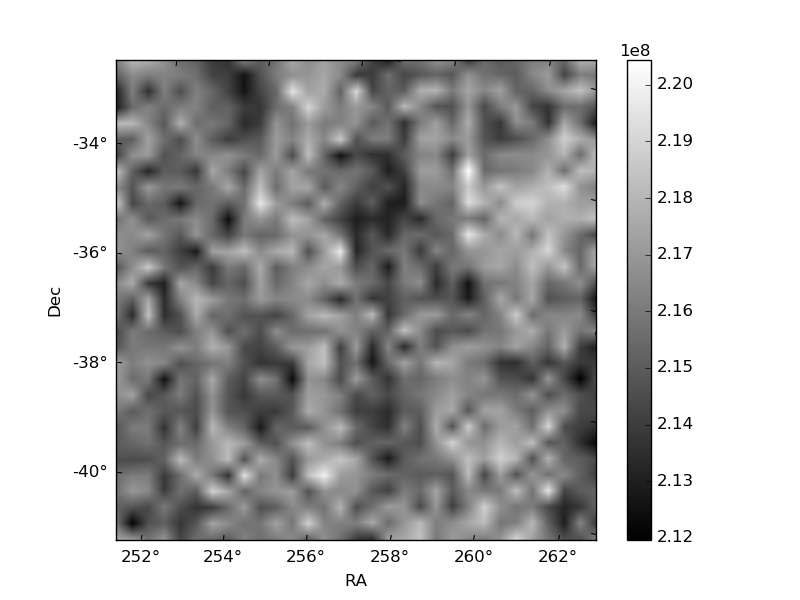
Histogram calculated using DETX and DETY for each event in the final _common_clean file
| Quadrant A | 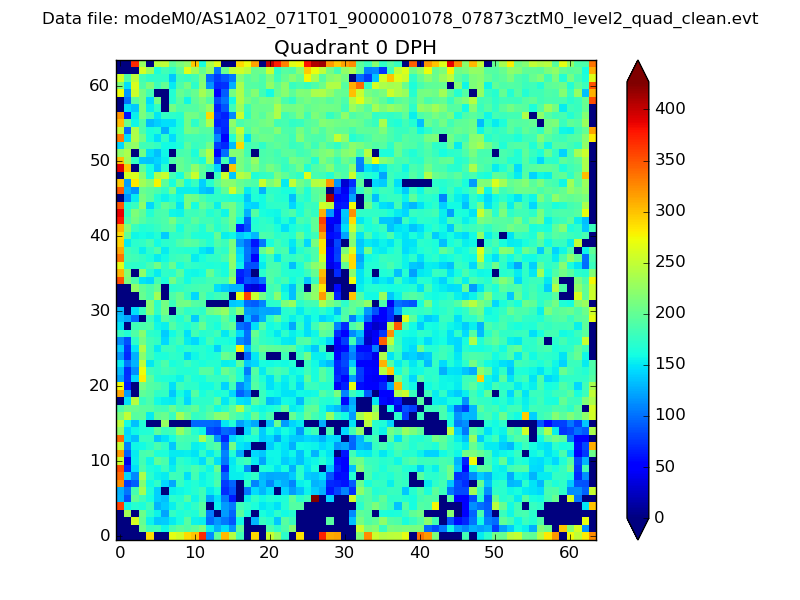 |
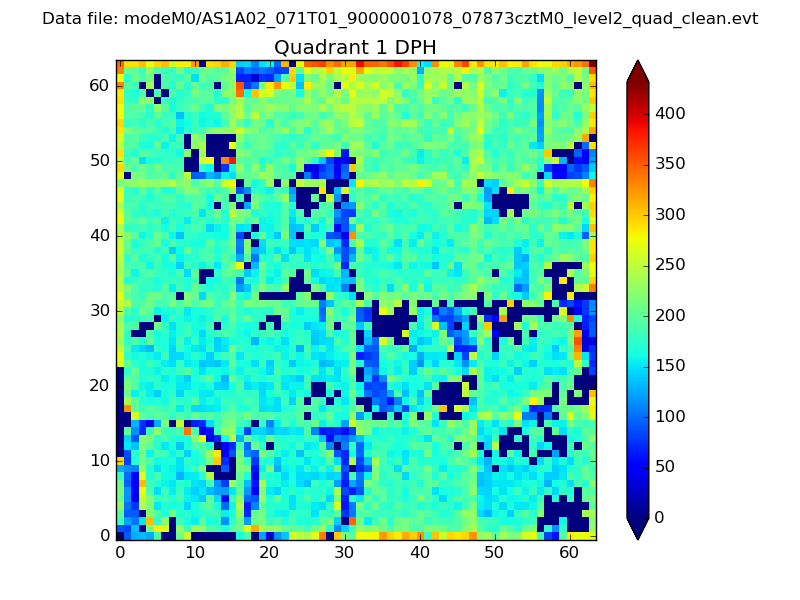 |
Quadrant B |
|---|---|---|---|
| Quadrant D | 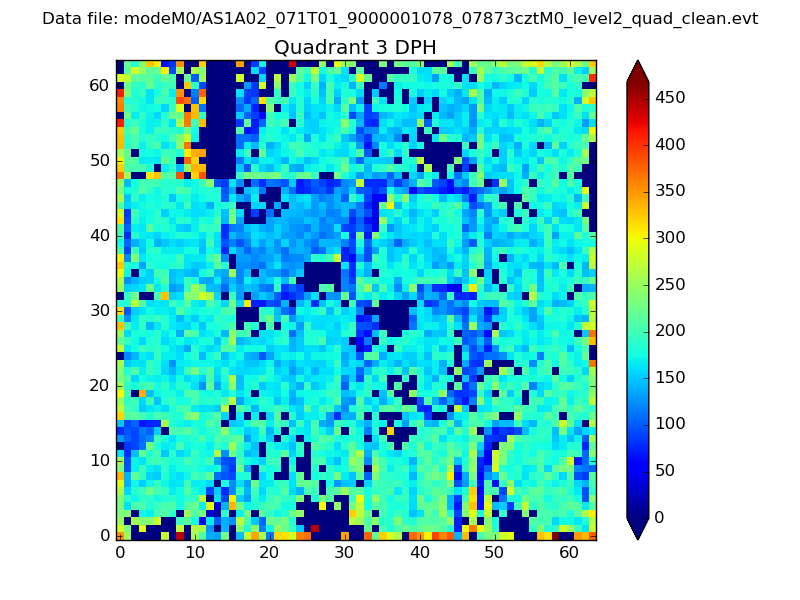 |
 |
Quadrant C |
| Plot type | Count rate plots | Images |
|---|---|---|
| Comparison with Poisson distribution Blue bars denote a histogram of data divided into 1 sec bins. Red curve is a Poisson curve with rate = median count rate of data. |
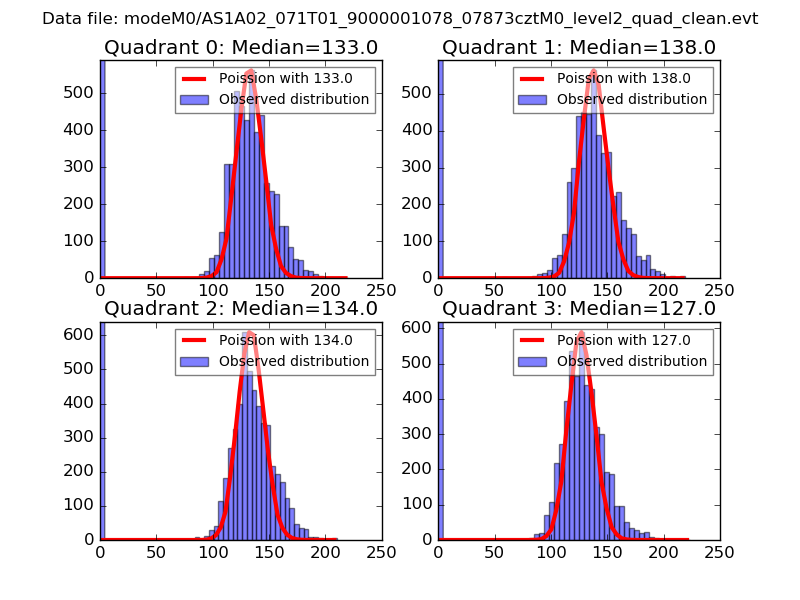 |
 |
| Quadrant-wise count rates Data is divided into 100 sec bins |
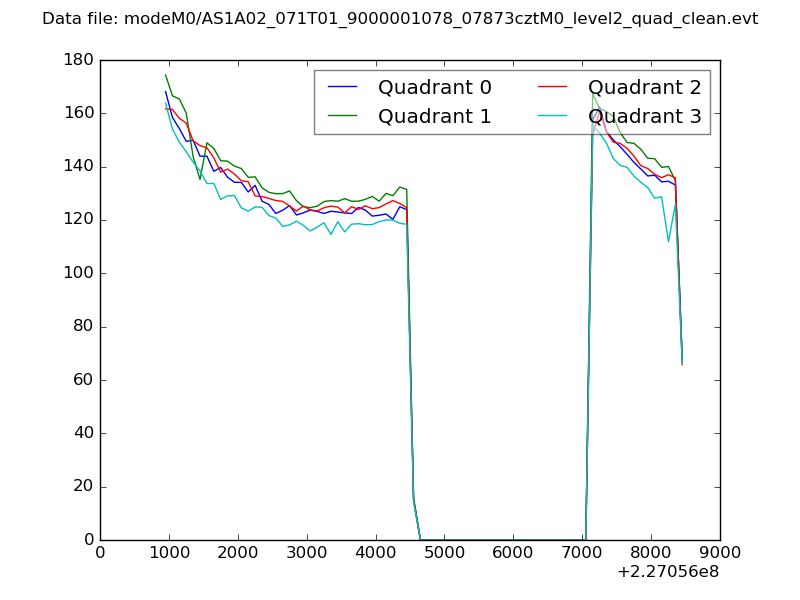 |
|
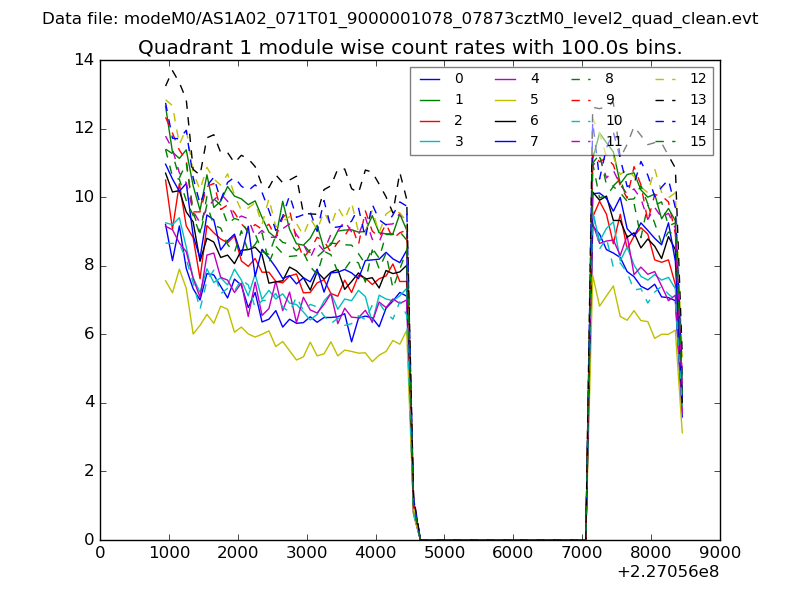
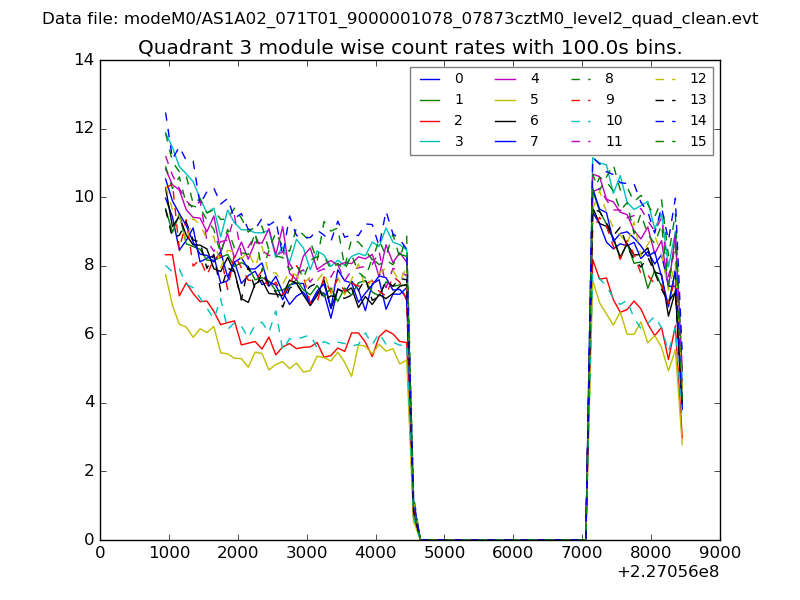
| Module-wise count rates for Quadrant A Data is divided into 100 sec bins |
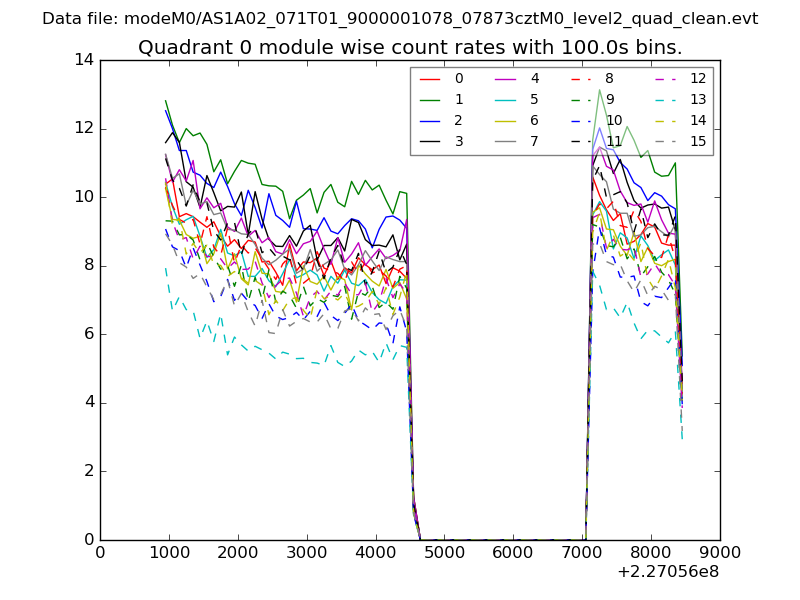 |
 |
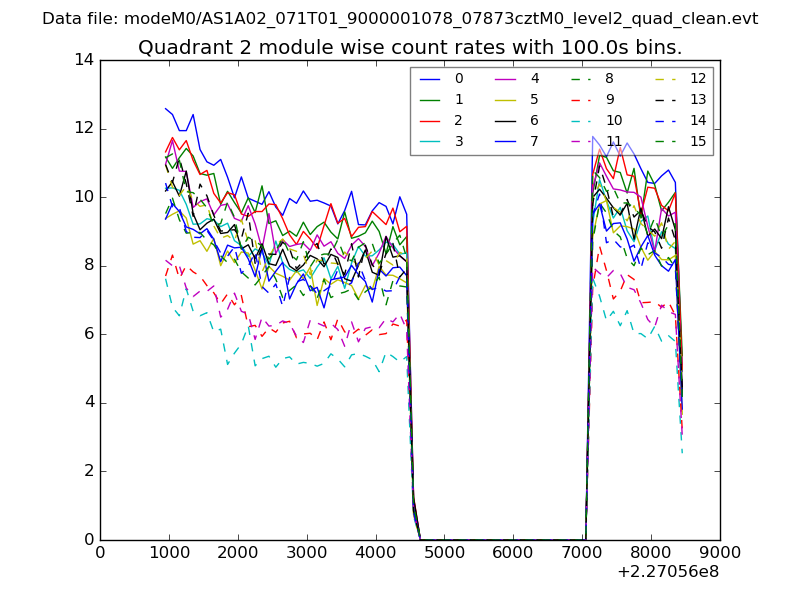
| Module-wise count rates for Quadrant B Data is divided into 100 sec bins |
 |
 |
| Module-wise count rates for Quadrant C Data is divided into 100 sec bins |
 |
 |
| Module-wise count rates for Quadrant D Data is divided into 100 sec bins |
 |
 |
| Parameter | Plot |
|---|---|
| CZT HV Monitor | 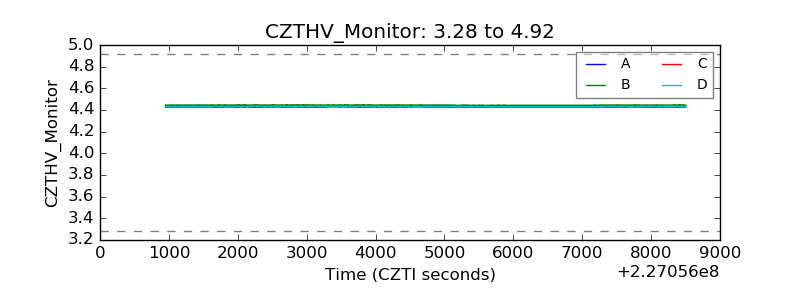 |
| D_VDD | 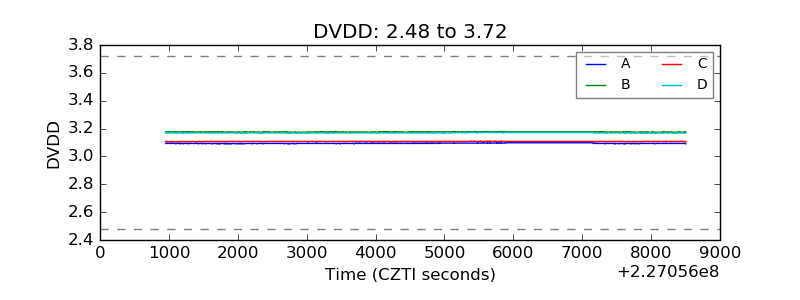 |
| Temperature 1 | 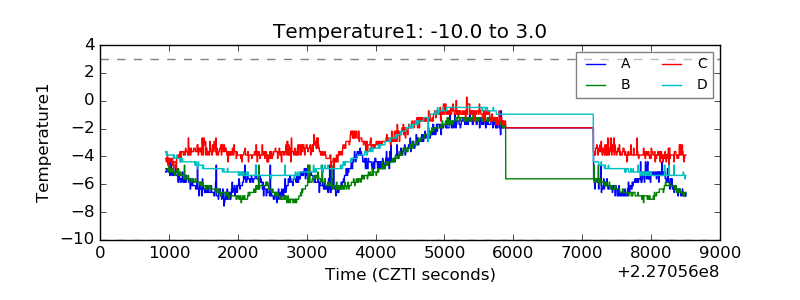 |
| Veto HV Monitor | 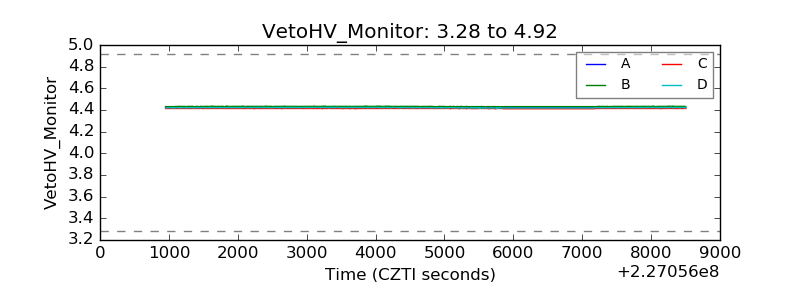 |
| Veto LLD | 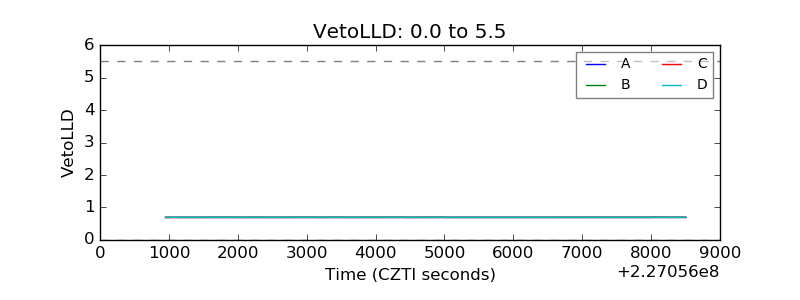 |
| Alpha Counter | 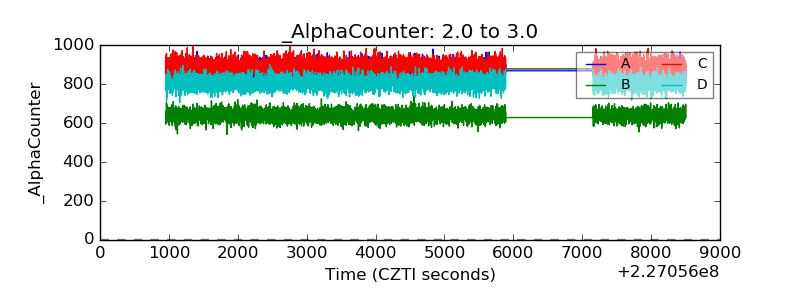 |
| _CPM_Rate | 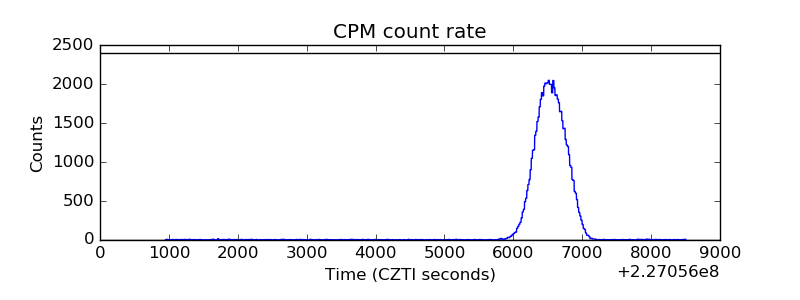 |
| CZT Counter | 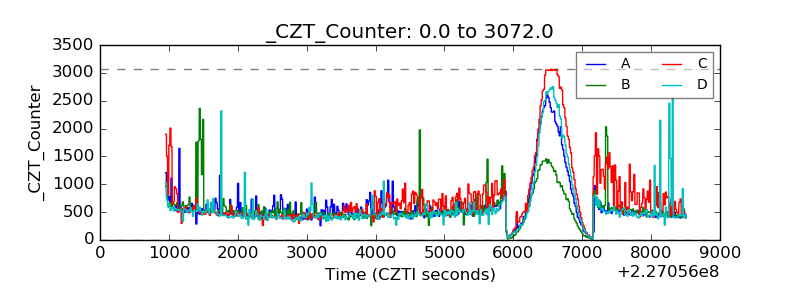 |
| +2.5 Volts monitor |  |
| +5 Volts monitor |  |
| _ROLL_ROT | 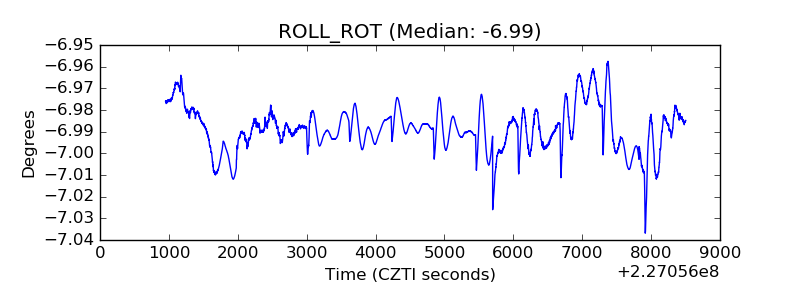 |
| _Roll_DEC | 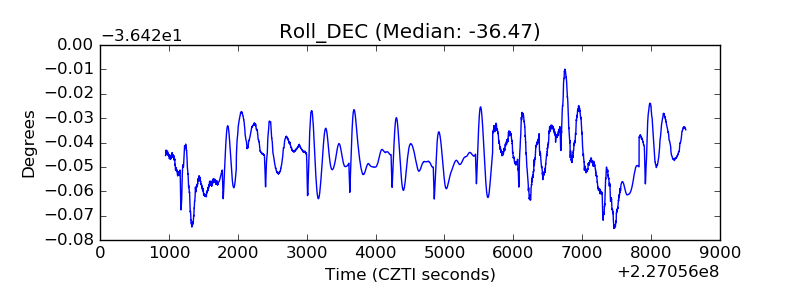 |
| _Roll_RA | 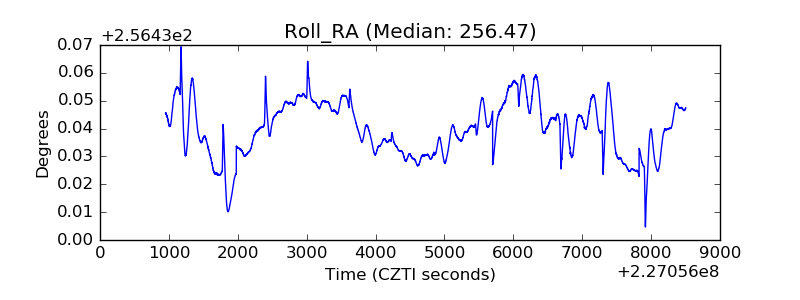 |
| Veto Counter | 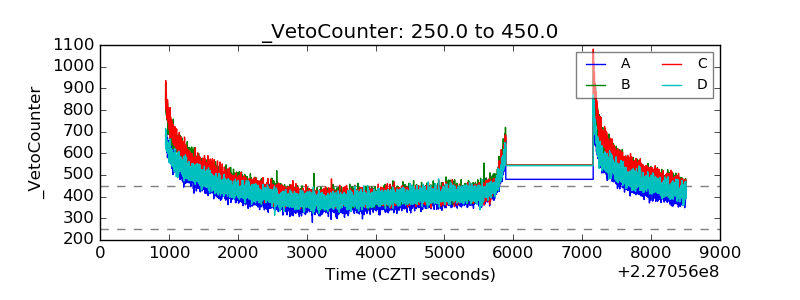 |