| Param | Original file | Final file |
|---|---|---|
| Filename | modeM0/AS1A02_071T01_9000001078_07874cztM0_level2.evt | modeM0/AS1A02_071T01_9000001078_07874cztM0_level2_quad_clean.evt |
| Size (bytes) | 462,942,720 | 92,960,640 |
| Size | 441.5 MB | 88.7 MB |
| Events in quadrant A | 3,164,932 | 592,092 |
| Events in quadrant B | 3,137,367 | 616,646 |
| Events in quadrant C | 4,190,574 | 598,941 |
| Events in quadrant D | 3,100,796 | 568,942 |
| Mode SS | |||
|---|---|---|---|
| Quadrant | BADHDUFLAG | Total packets | Discarded packets |
| A | 0 | 128 | 0 |
| B | 0 | 128 | 0 |
| C | 0 | 128 | 0 |
| D | 0 | 128 | 0 |
| Mode M0 | |||
|---|---|---|---|
| Quadrant | BADHDUFLAG | Total packets | Discarded packets |
| A | 0 | 13551 | 2 |
| B | 0 | 13476 | 1 |
| C | 0 | 16789 | 1 |
| D | 0 | 13588 | 1 |
| Mode M9 | |||
|---|---|---|---|
| Quadrant | BADHDUFLAG | Total packets | Discarded packets |
| A | 0 | 13 | 0 |
| B | 0 | 13 | 0 |
| C | 0 | 13 | 0 |
| D | 0 | 13 | 0 |
| Quadrant | Total seconds | Saturated seconds | Saturation percentage |
|---|---|---|---|
| A | 6283 | 34 | 0.541143% |
| B | 6283 | 66 | 1.050454% |
| C | 6283 | 41 | 0.652555% |
| D | 6283 | 39 | 0.620723% |
Noise dominated data is calculated using 1-second bins in cleaned event files. If a bin has >2000 counts, and if more than 50% of those come from <1% of pixels, then it is considered to be noise-dominated and hence unusable.
| Quadrant | # 1 sec bins | Bins with >0 counts | Bins with >2000 counts | High rate bins dominated by noise | Noise dominated (total time) | Noise dominated (detector-on time) | Marked lightcurve |
|---|---|---|---|---|---|---|---|
| A | 7563 | 6284 | 8 | 8 | 0.11% | 0.13% | 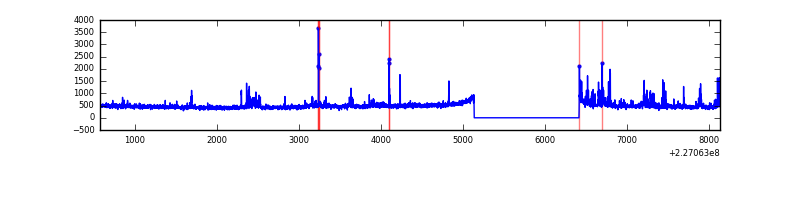 |
| B | 7563 | 6284 | 8 | 8 | 0.11% | 0.13% | 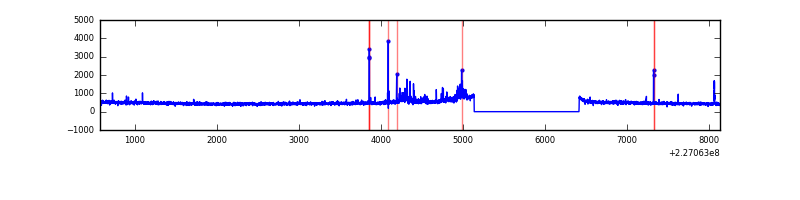 |
| C | 7563 | 6284 | 2 | 2 | 0.03% | 0.03% | 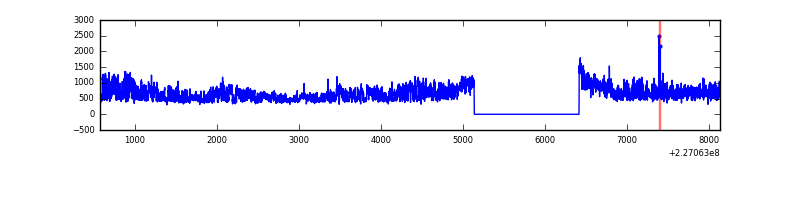 |
| D | 7563 | 6284 | 28 | 28 | 0.37% | 0.45% | 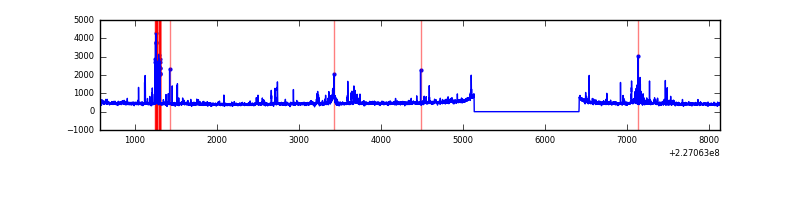 |
Top three noisy pixels from each quadrant. If the there are fewer than three noisy pixels in the level2.evt file, extra rows are filled as -1
| Pixel properties | Quadrant properties | ||||||
|---|---|---|---|---|---|---|---|
| Quadrant | DetID | PixID | Counts | Sigma | Mean | Median | Sigma |
| A | 15 | 239 | 143070 | 945.81 | 745 | 730 | 150.5 |
| A | 2 | 79 | 125946 | 832.03 | 745 | 730 | 150.5 |
| A | 15 | 223 | 14469 | 91.29 | 745 | 730 | 150.5 |
| B | 4 | 239 | 125757 | 873.17 | 761 | 745 | 143.2 |
| B | 11 | 51 | 21877 | 147.6 | 761 | 745 | 143.2 |
| B | 10 | 16 | 20211 | 135.96 | 761 | 745 | 143.2 |
| C | 1 | 16 | 1240767 | 7183.96 | 746 | 752 | 172.6 |
| C | 8 | 229 | 18230 | 101.26 | 746 | 752 | 172.6 |
| C | 10 | 22 | 13368 | 73.09 | 746 | 752 | 172.6 |
| D | 1 | 52 | 104407 | 578.71 | 736 | 714 | 179.2 |
| D | 2 | 14 | 90341 | 500.21 | 736 | 714 | 179.2 |
| D | 14 | 34 | 53790 | 296.22 | 736 | 714 | 179.2 |
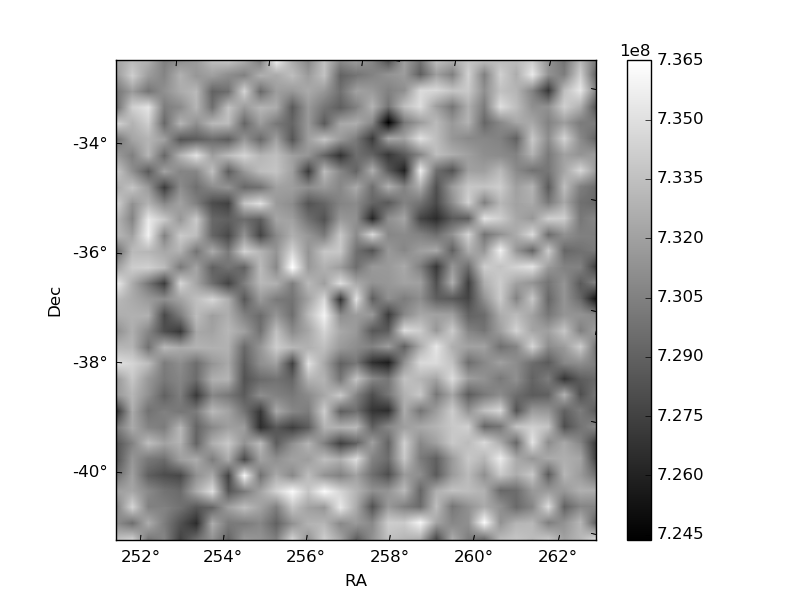
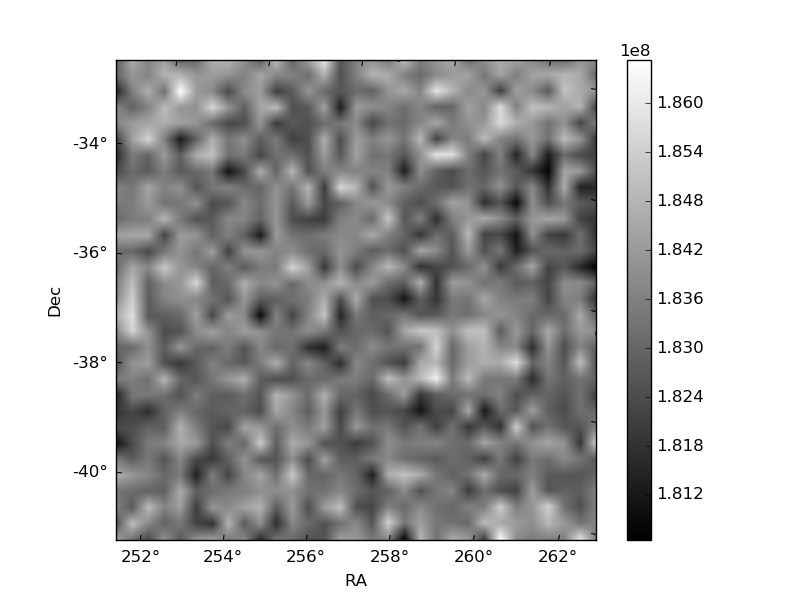
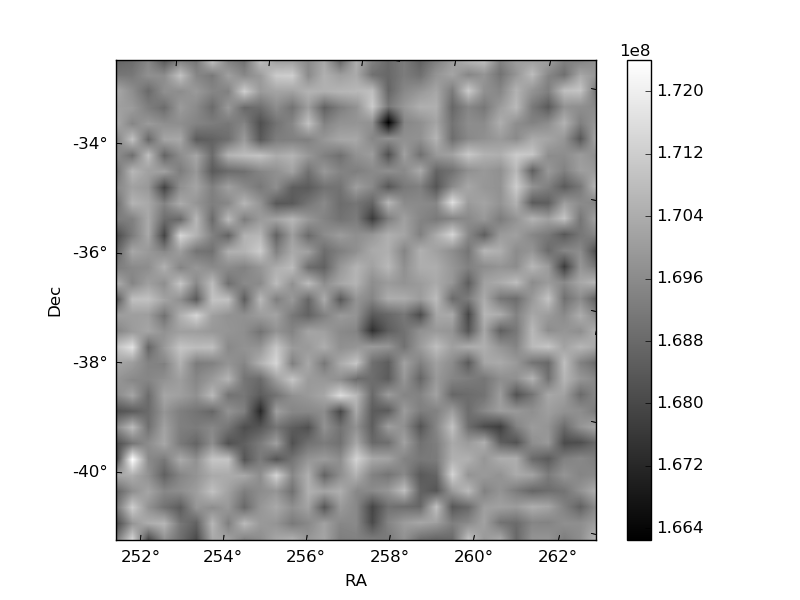
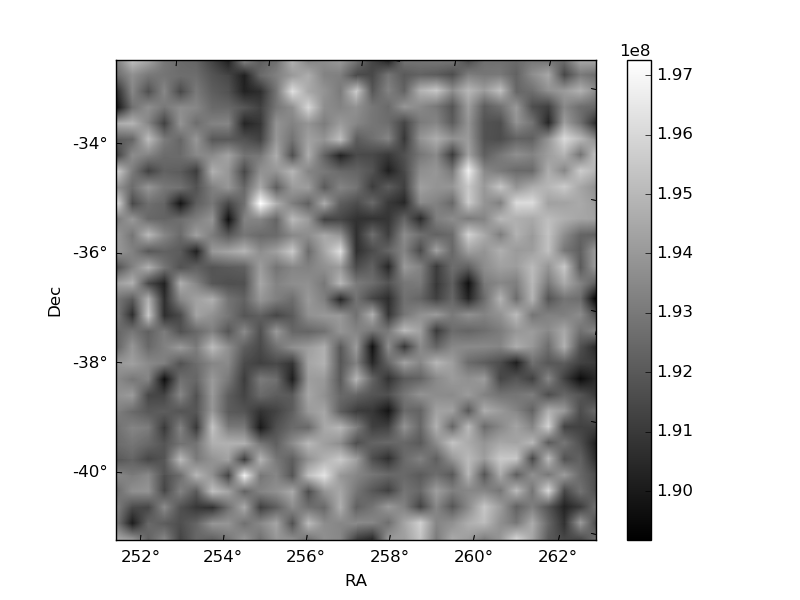
Histogram calculated using DETX and DETY for each event in the final _common_clean file
| Quadrant A | 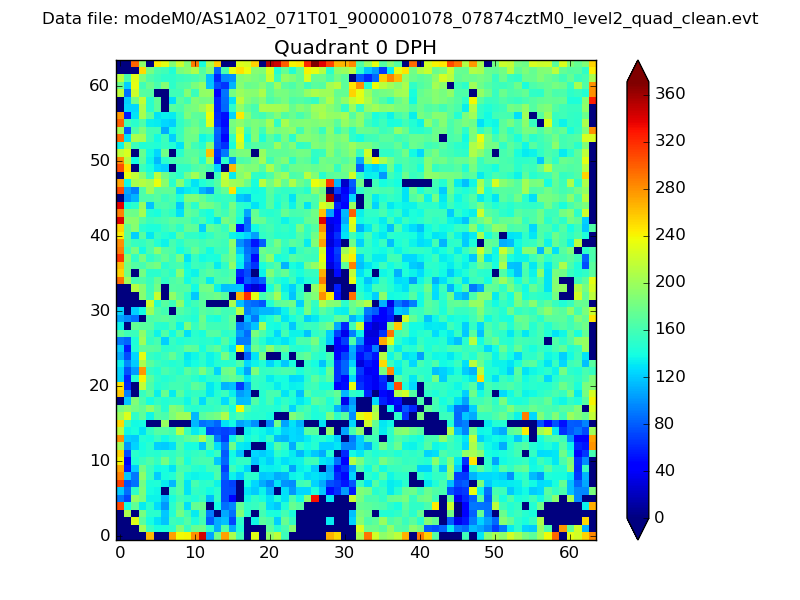 |
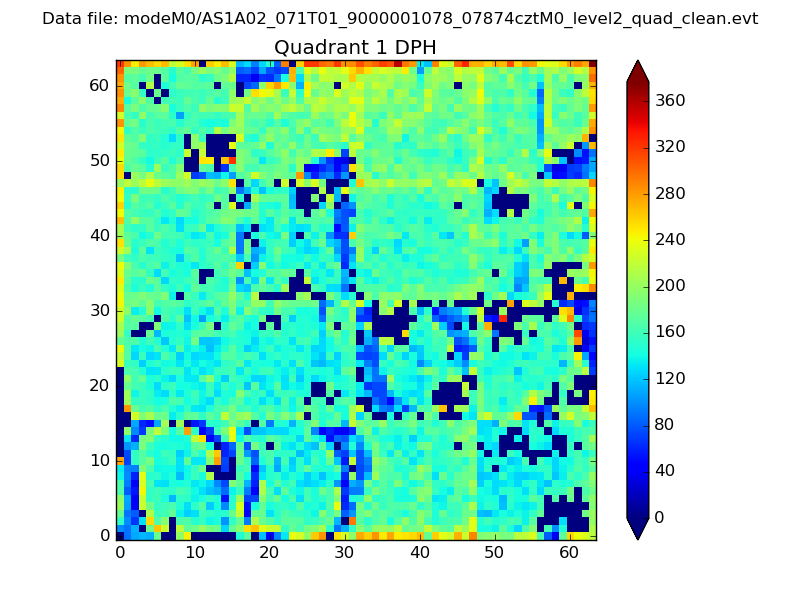 |
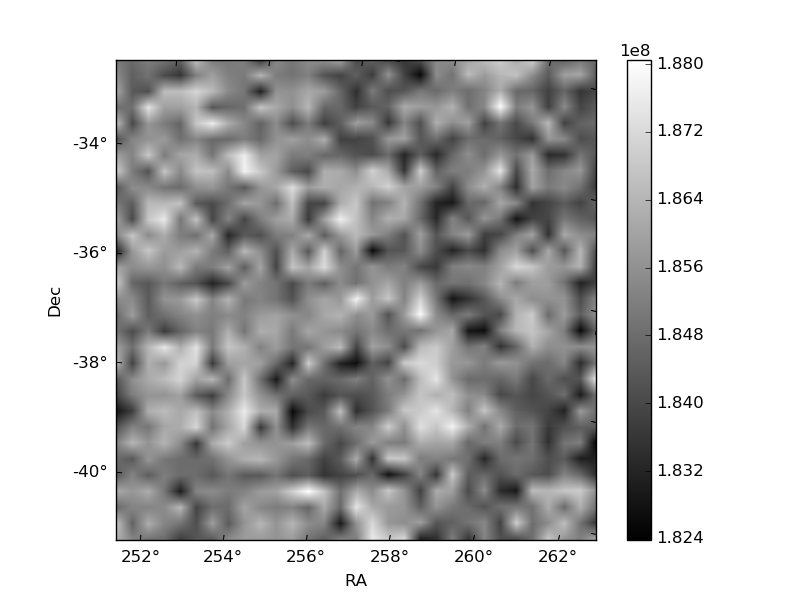
Quadrant B |
|---|---|---|---|
| Quadrant D | 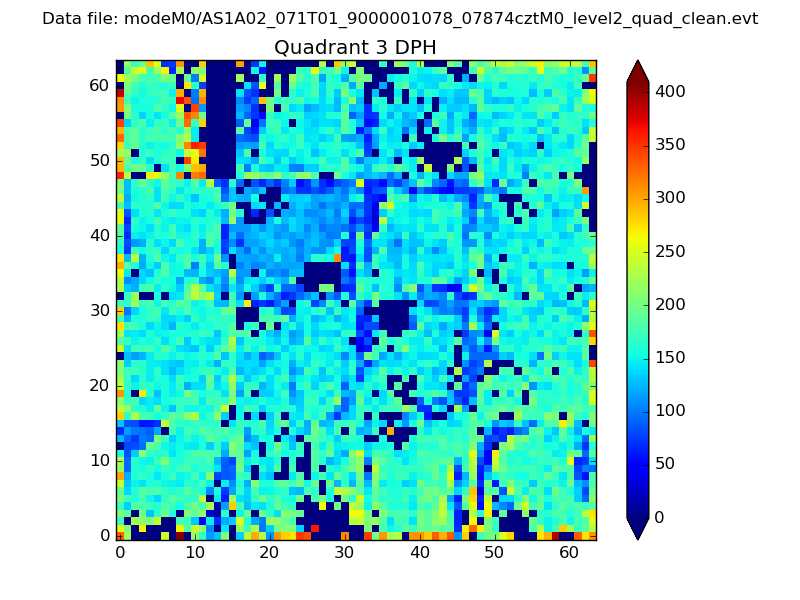 |
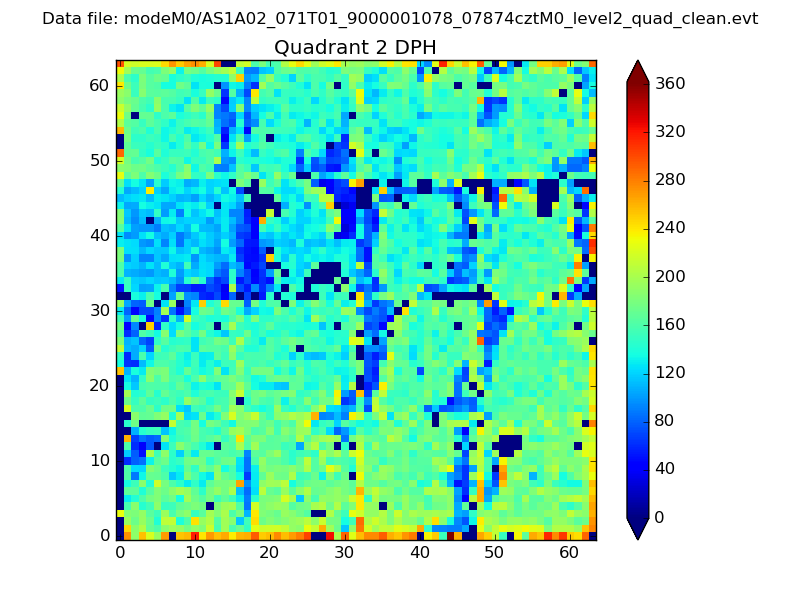 |
Quadrant C |
| Plot type | Count rate plots | Images |
|---|---|---|
| Comparison with Poisson distribution Blue bars denote a histogram of data divided into 1 sec bins. Red curve is a Poisson curve with rate = median count rate of data. |
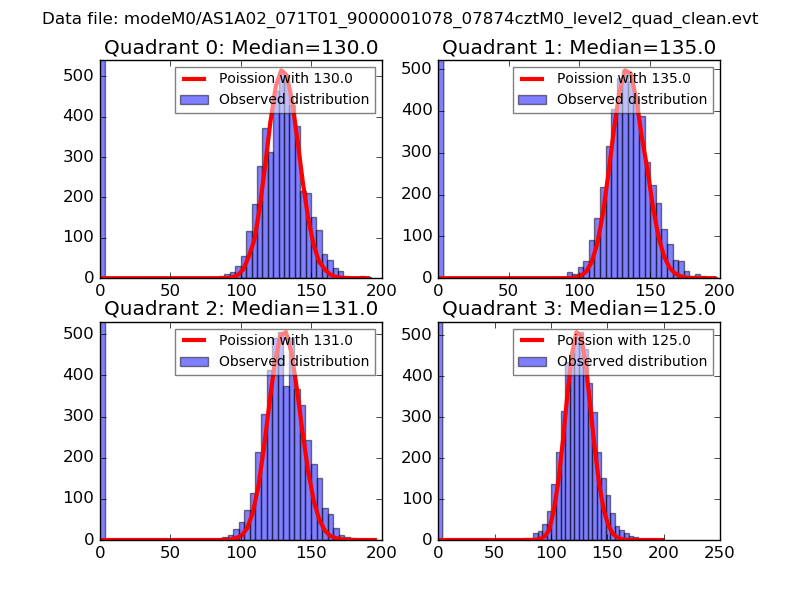 |
 |
| Quadrant-wise count rates Data is divided into 100 sec bins |
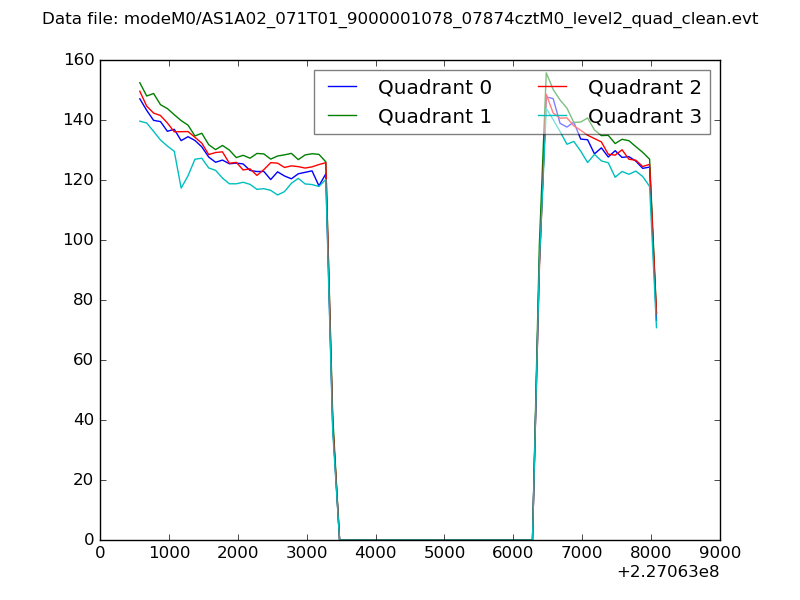 |
|
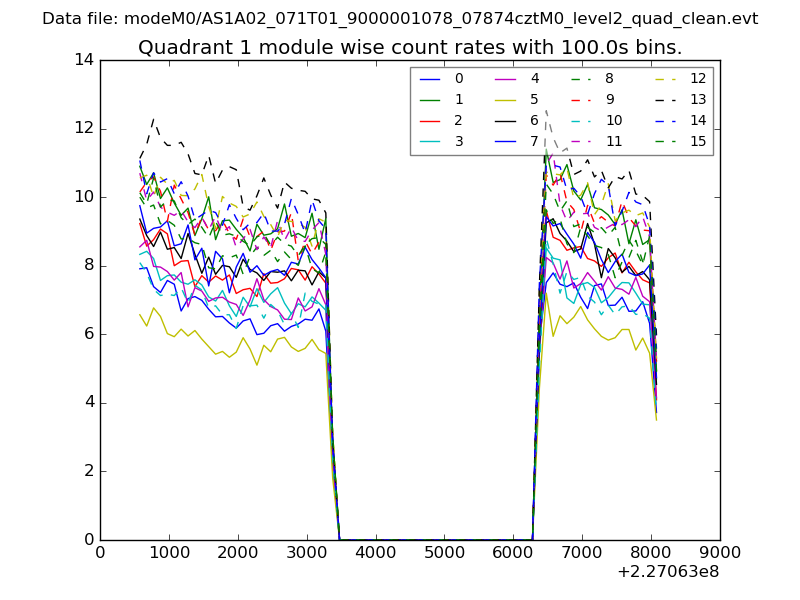
| Module-wise count rates for Quadrant A Data is divided into 100 sec bins |
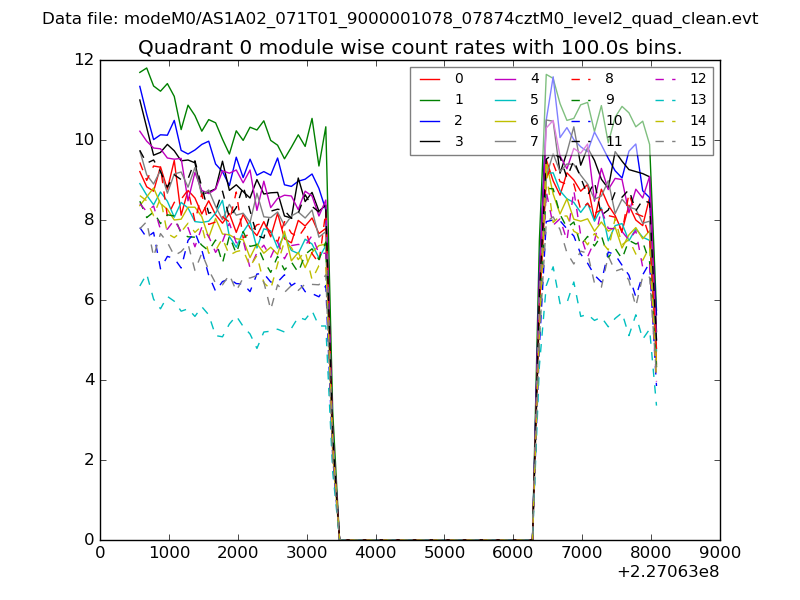 |
 |
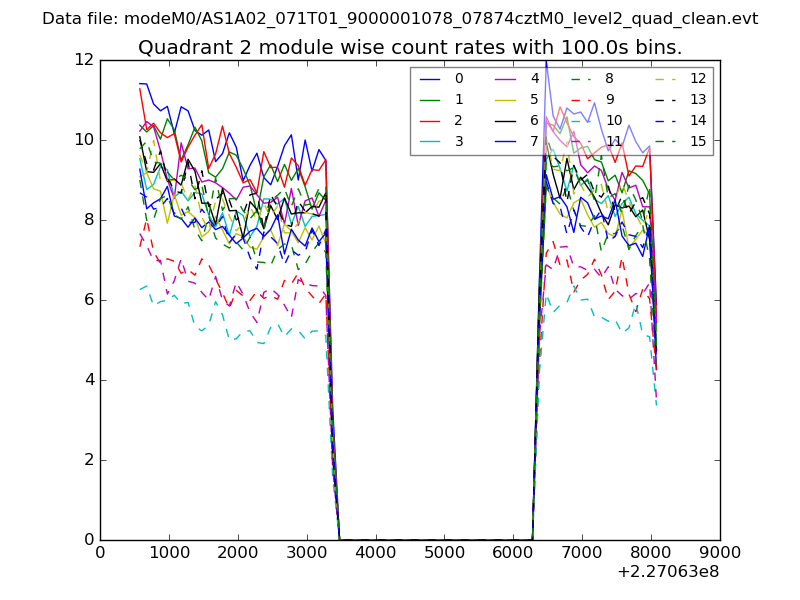
| Module-wise count rates for Quadrant B Data is divided into 100 sec bins |
 |
 |
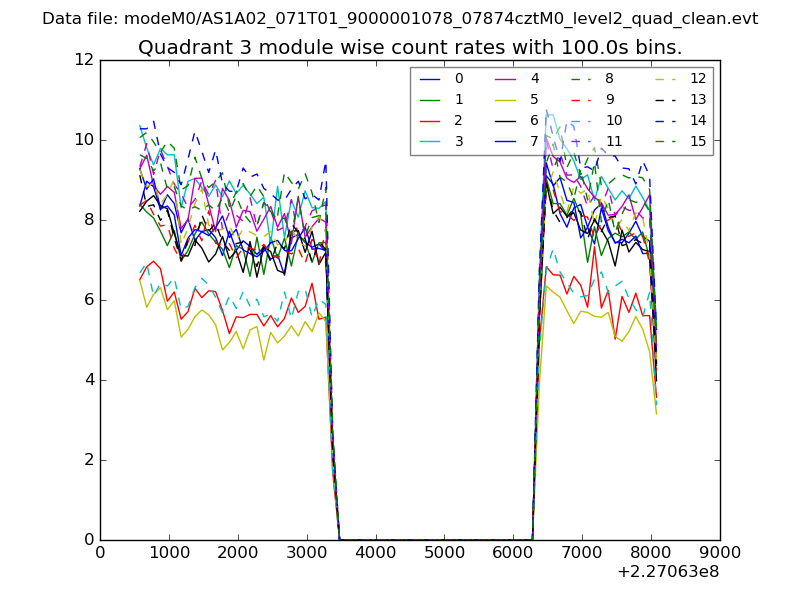
| Module-wise count rates for Quadrant C Data is divided into 100 sec bins |
 |
 |
| Module-wise count rates for Quadrant D Data is divided into 100 sec bins |
 |
 |
| Parameter | Plot |
|---|---|
| CZT HV Monitor | 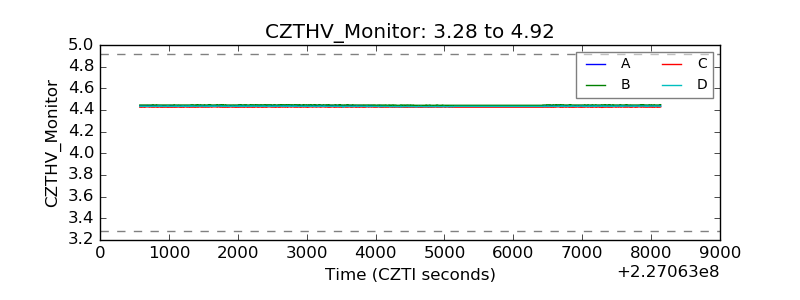 |
| D_VDD | 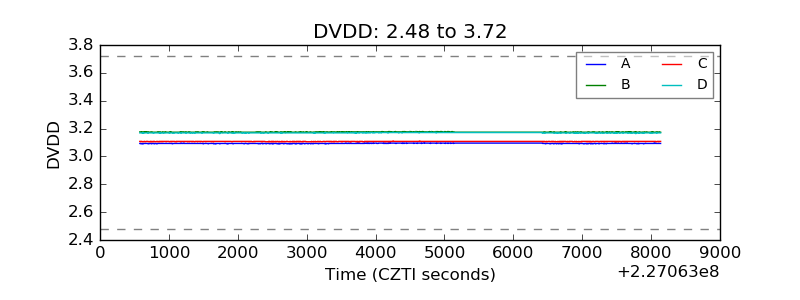 |
| Temperature 1 | 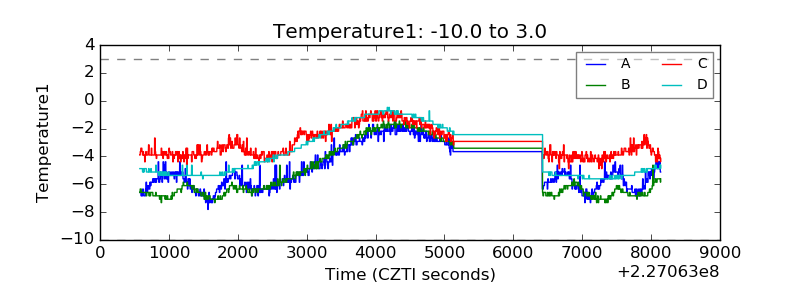 |
| Veto HV Monitor | 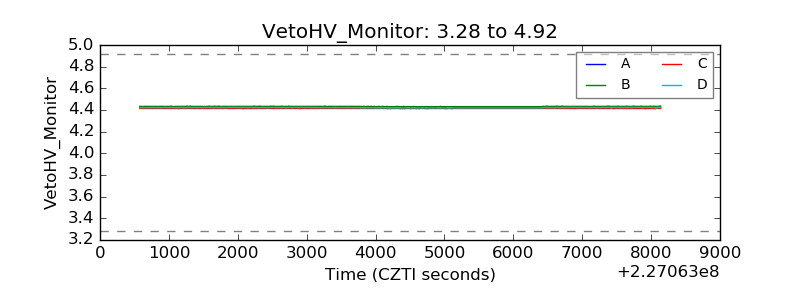 |
| Veto LLD | 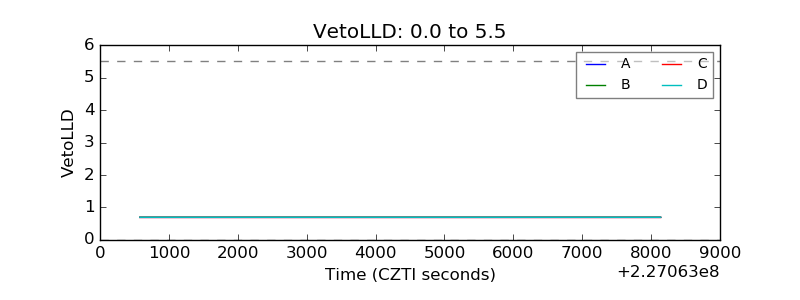 |
| Alpha Counter | 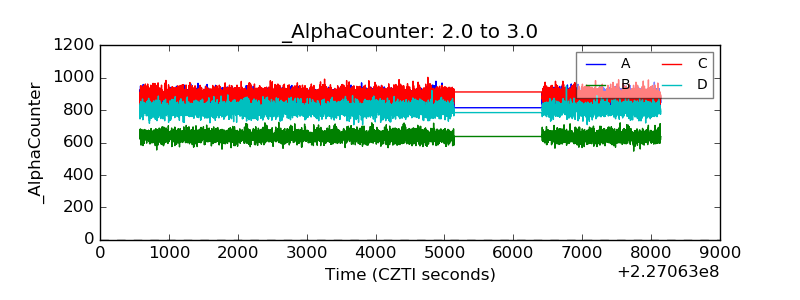 |
| _CPM_Rate | 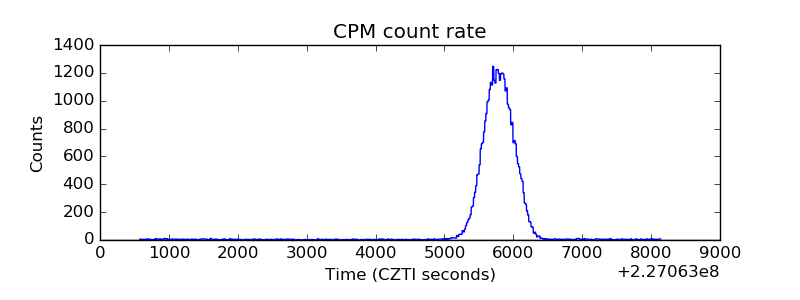 |
| CZT Counter | 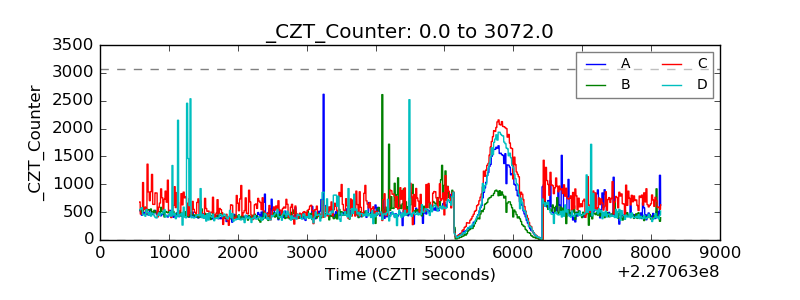 |
| +2.5 Volts monitor | 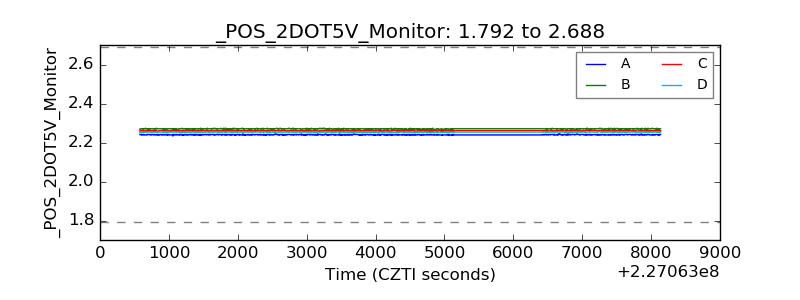 |
| +5 Volts monitor |  |
| _ROLL_ROT | 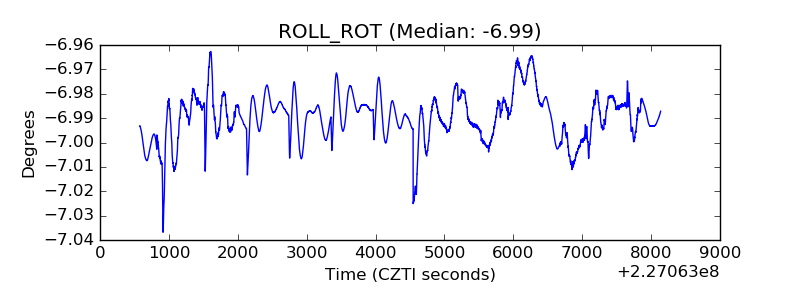 |
| _Roll_DEC | 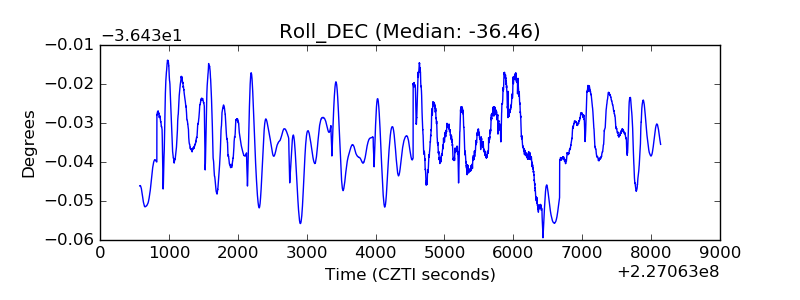 |
| _Roll_RA | 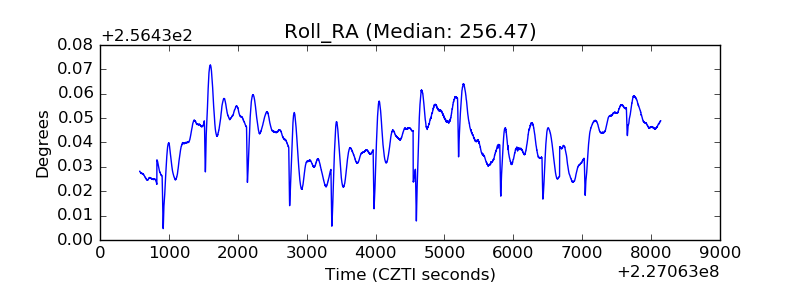 |
| Veto Counter | 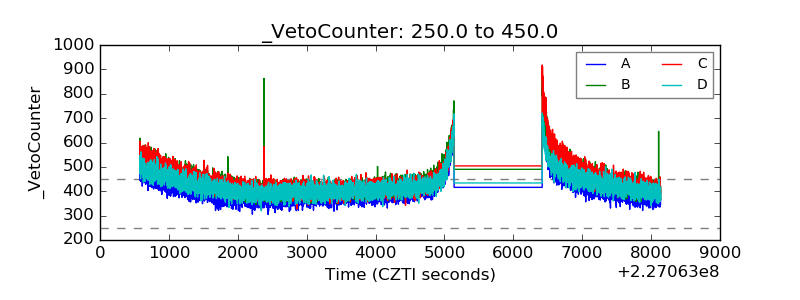 |