| Param | Original file | Final file |
|---|---|---|
| Filename | modeM0/AS1A02_071T01_9000001078_07876cztM0_level2.evt | modeM0/AS1A02_071T01_9000001078_07876cztM0_level2_quad_clean.evt |
| Size (bytes) | 487,869,120 | 91,077,120 |
| Size | 465.3 MB | 86.9 MB |
| Events in quadrant A | 3,241,333 | 576,582 |
| Events in quadrant B | 3,337,972 | 594,803 |
| Events in quadrant C | 3,869,507 | 578,353 |
| Events in quadrant D | 3,869,914 | 540,070 |
| Mode SS | |||
|---|---|---|---|
| Quadrant | BADHDUFLAG | Total packets | Discarded packets |
| A | 0 | 136 | 0 |
| B | 0 | 136 | 0 |
| C | 0 | 136 | 0 |
| D | 0 | 136 | 0 |
| Mode M0 | |||
|---|---|---|---|
| Quadrant | BADHDUFLAG | Total packets | Discarded packets |
| A | 0 | 14254 | 2 |
| B | 0 | 14442 | 1 |
| C | 0 | 15927 | 1 |
| D | 0 | 16172 | 1 |
| Mode M9 | |||
|---|---|---|---|
| Quadrant | BADHDUFLAG | Total packets | Discarded packets |
| A | 0 | 8 | 0 |
| B | 0 | 8 | 0 |
| C | 0 | 8 | 0 |
| D | 0 | 8 | 0 |
| Quadrant | Total seconds | Saturated seconds | Saturation percentage |
|---|---|---|---|
| A | 6716 | 128 | 1.905896% |
| B | 6716 | 154 | 2.293032% |
| C | 6716 | 140 | 2.084574% |
| D | 6716 | 355 | 5.285884% |
Noise dominated data is calculated using 1-second bins in cleaned event files. If a bin has >2000 counts, and if more than 50% of those come from <1% of pixels, then it is considered to be noise-dominated and hence unusable.
| Quadrant | # 1 sec bins | Bins with >0 counts | Bins with >2000 counts | High rate bins dominated by noise | Noise dominated (total time) | Noise dominated (detector-on time) | Marked lightcurve |
|---|---|---|---|---|---|---|---|
| A | 7491 | 6717 | 10 | 10 | 0.13% | 0.15% | 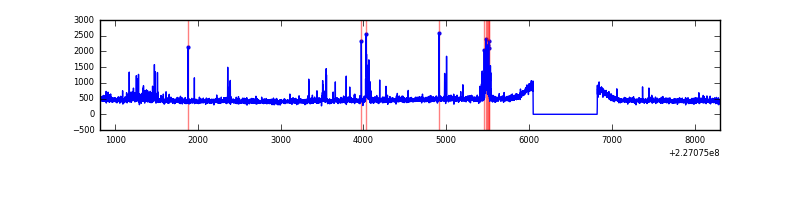 |
| B | 7491 | 6717 | 27 | 27 | 0.36% | 0.40% | 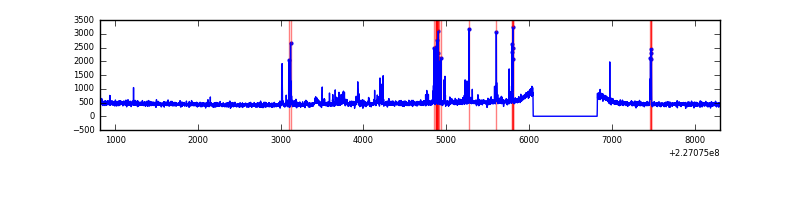 |
| C | 7491 | 6717 | 1 | 1 | 0.01% | 0.01% | 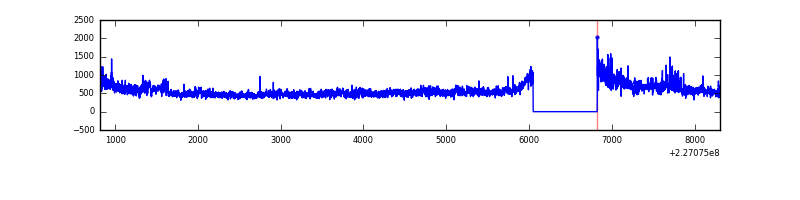 |
| D | 7491 | 6717 | 215 | 215 | 2.87% | 3.20% | 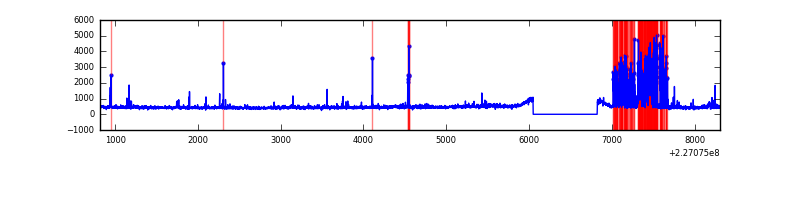 |
Top three noisy pixels from each quadrant. If the there are fewer than three noisy pixels in the level2.evt file, extra rows are filled as -1
| Pixel properties | Quadrant properties | ||||||
|---|---|---|---|---|---|---|---|
| Quadrant | DetID | PixID | Counts | Sigma | Mean | Median | Sigma |
| A | 2 | 79 | 105704 | 652.41 | 788 | 771 | 160.8 |
| A | 15 | 239 | 68834 | 423.18 | 788 | 771 | 160.8 |
| A | 3 | 1 | 14952 | 88.17 | 788 | 771 | 160.8 |
| B | 4 | 239 | 159993 | 1043.69 | 798 | 778 | 152.6 |
| B | 0 | 214 | 30725 | 196.31 | 798 | 778 | 152.6 |
| B | 4 | 81 | 27950 | 178.12 | 798 | 778 | 152.6 |
| C | 1 | 16 | 814468 | 4461.2 | 781 | 783 | 182.4 |
| C | 12 | 4 | 6152 | 29.44 | 781 | 783 | 182.4 |
| C | 13 | 61 | 6000 | 28.6 | 781 | 783 | 182.4 |
| D | 14 | 34 | 747321 | 3954.18 | 768 | 744 | 188.8 |
| D | 2 | 152 | 76571 | 401.61 | 768 | 744 | 188.8 |
| D | 7 | 55 | 28800 | 148.6 | 768 | 744 | 188.8 |
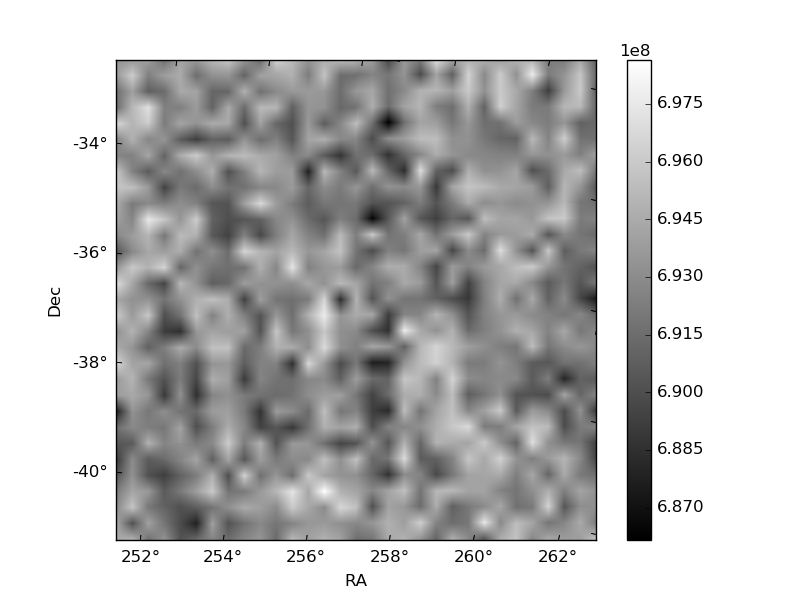
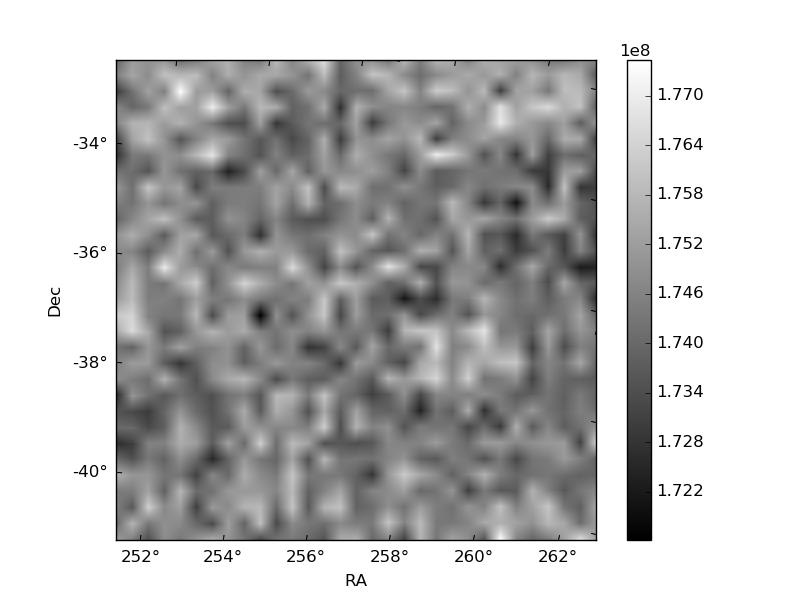
Histogram calculated using DETX and DETY for each event in the final _common_clean file
| Quadrant A | 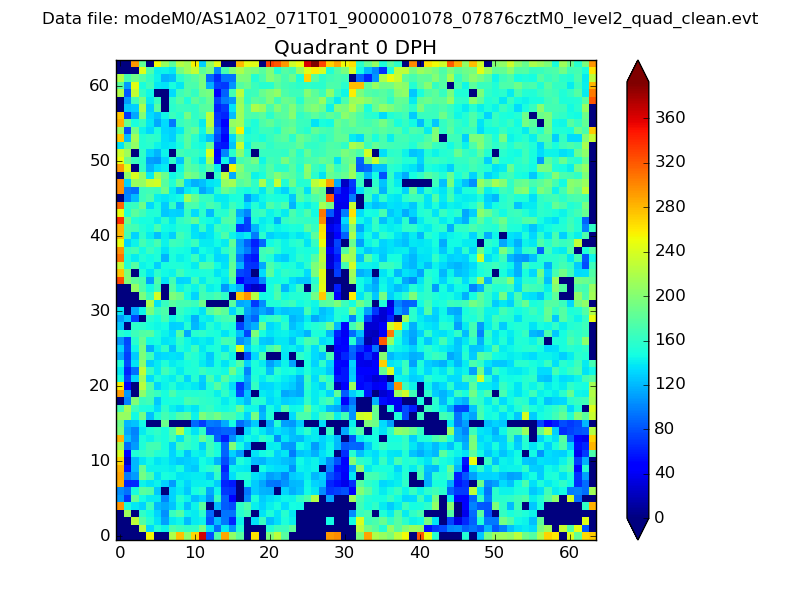 |
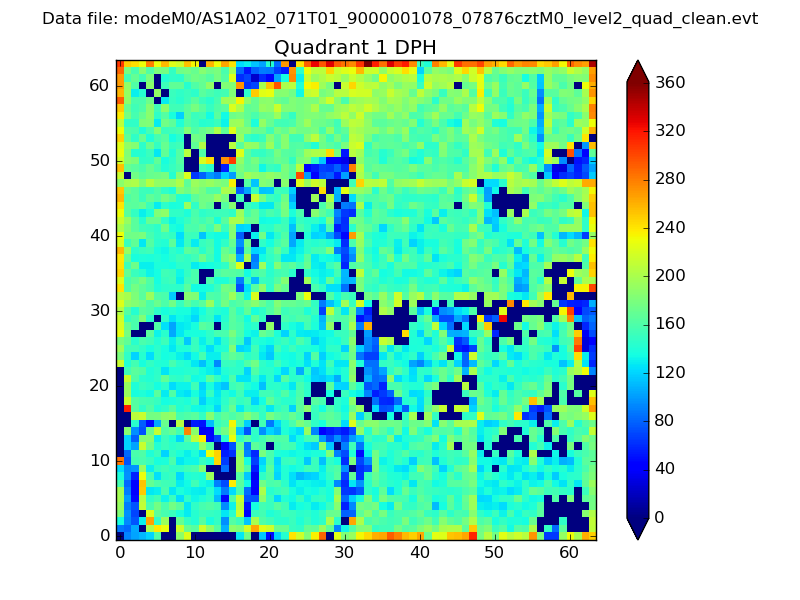 |
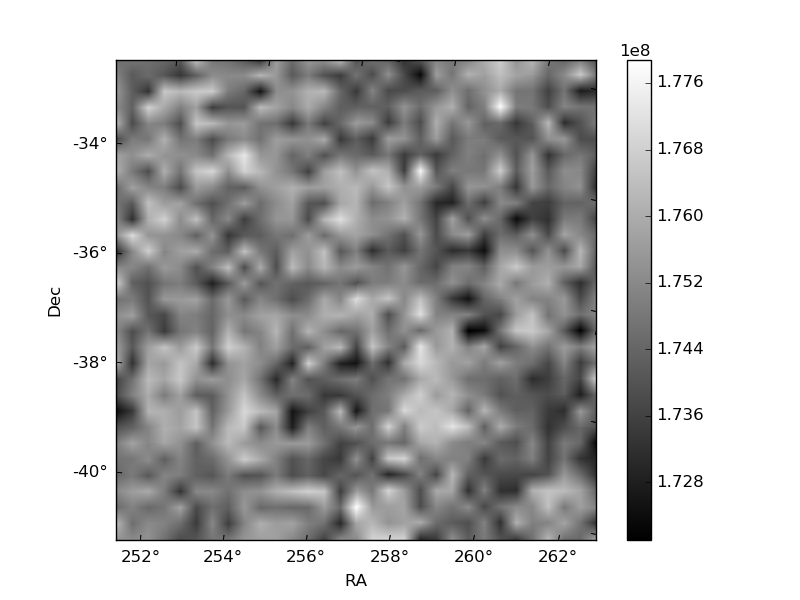
Quadrant B |
|---|---|---|---|
| Quadrant D | 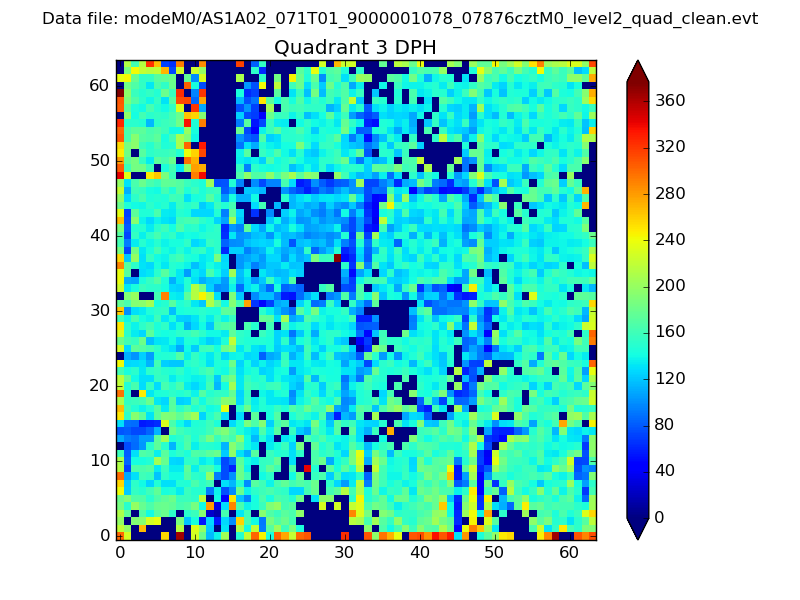 |
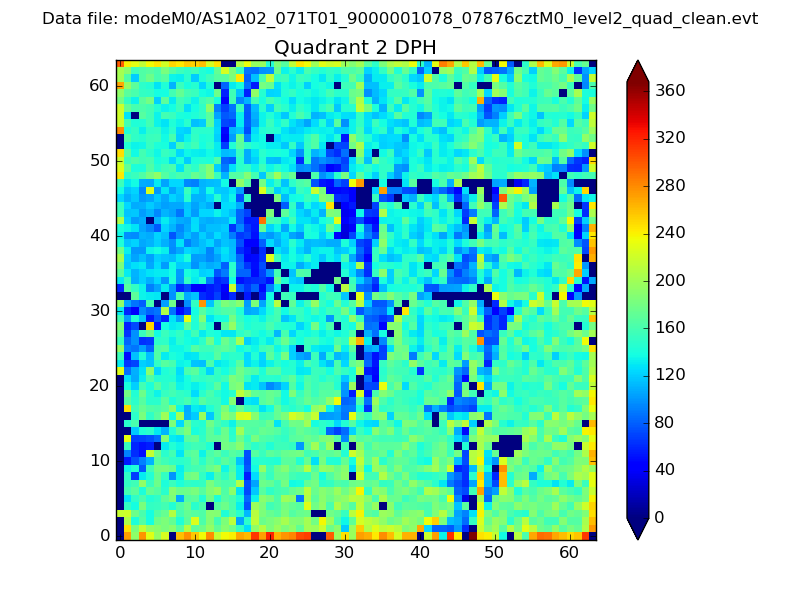 |
Quadrant C |
| Plot type | Count rate plots | Images |
|---|---|---|
| Comparison with Poisson distribution Blue bars denote a histogram of data divided into 1 sec bins. Red curve is a Poisson curve with rate = median count rate of data. |
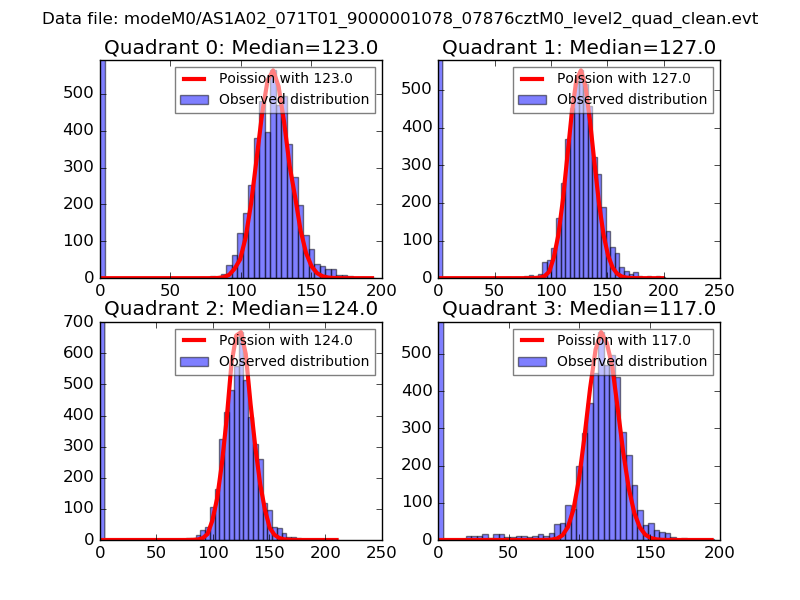 |
 |
| Quadrant-wise count rates Data is divided into 100 sec bins |
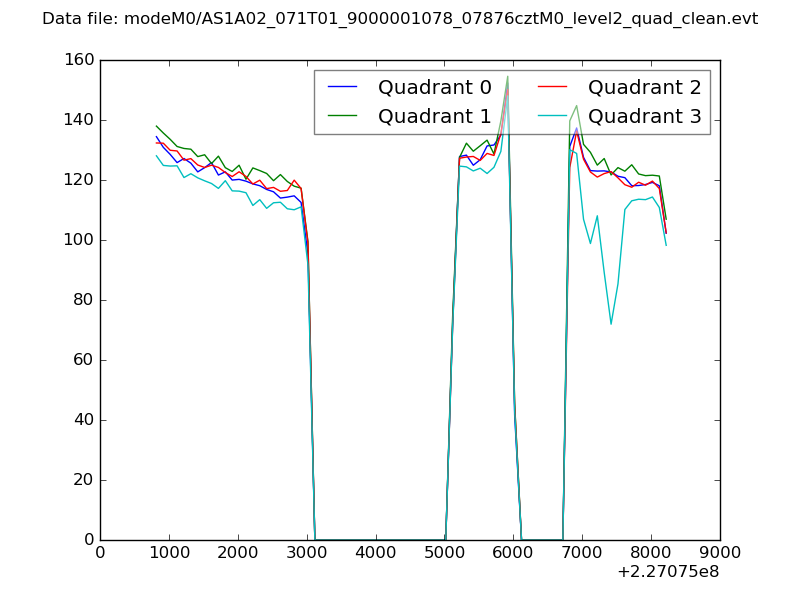 |
|
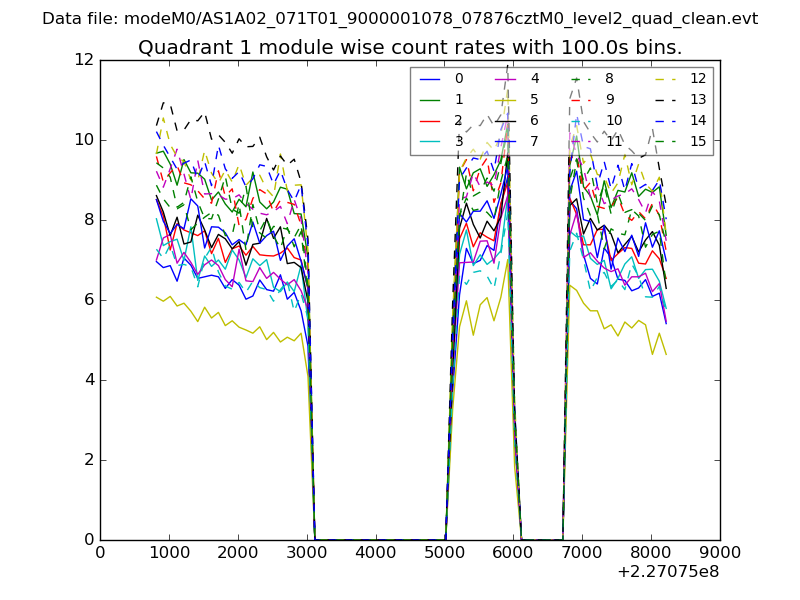
| Module-wise count rates for Quadrant A Data is divided into 100 sec bins |
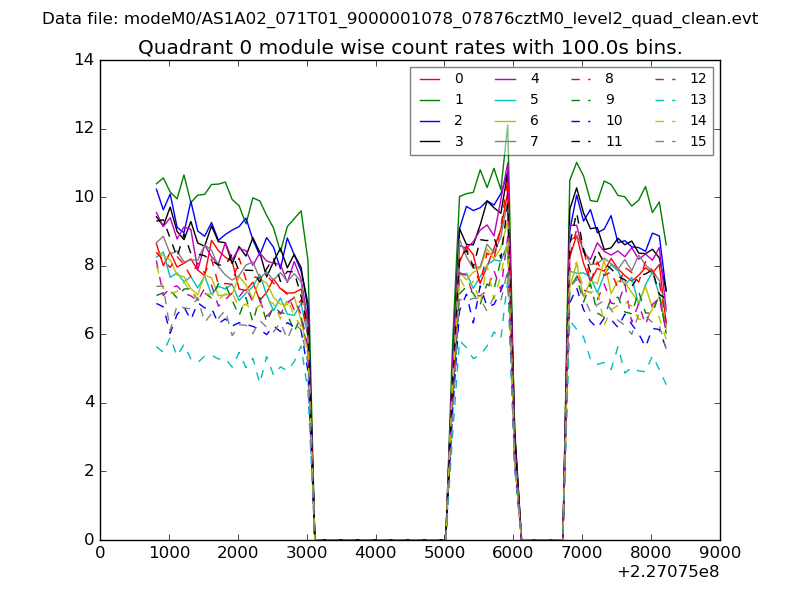 |
 |
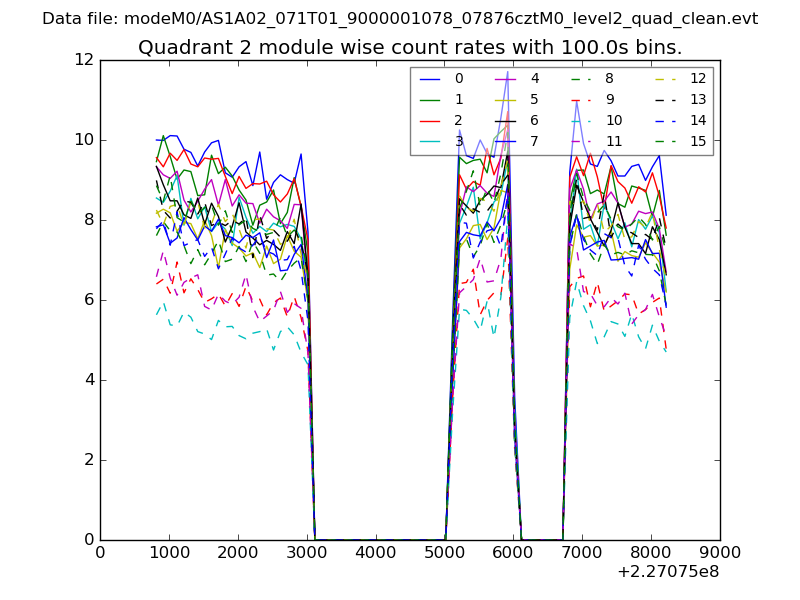
| Module-wise count rates for Quadrant B Data is divided into 100 sec bins |
 |
 |
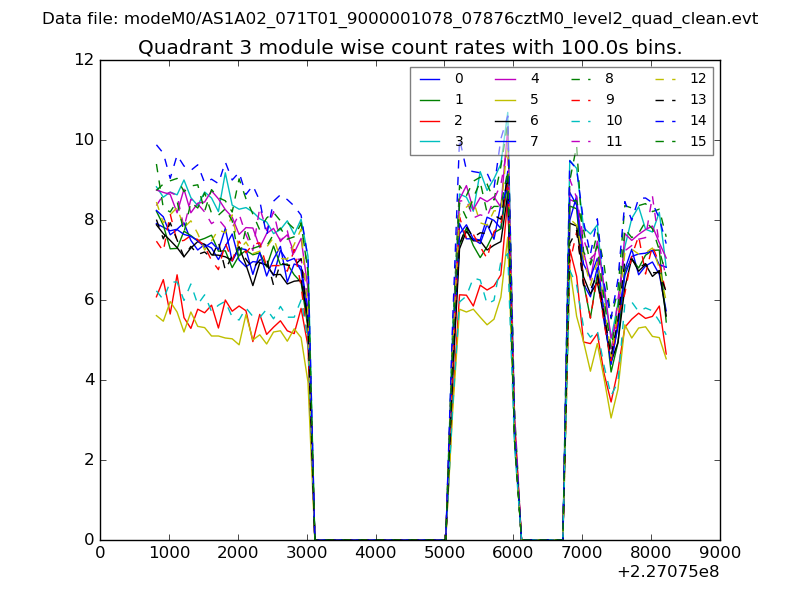
| Module-wise count rates for Quadrant C Data is divided into 100 sec bins |
 |
 |
| Module-wise count rates for Quadrant D Data is divided into 100 sec bins |
 |
 |
| Parameter | Plot |
|---|---|
| CZT HV Monitor | 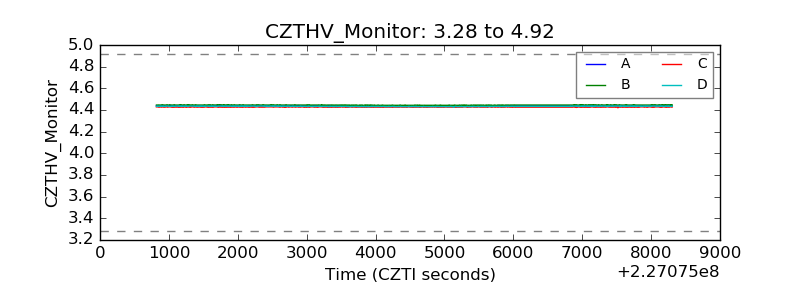 |
| D_VDD |  |
| Temperature 1 | 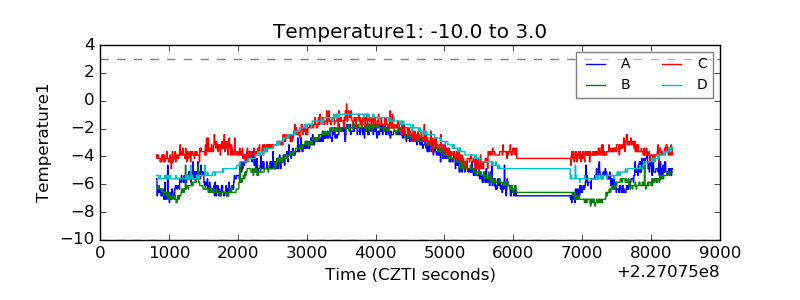 |
| Veto HV Monitor | 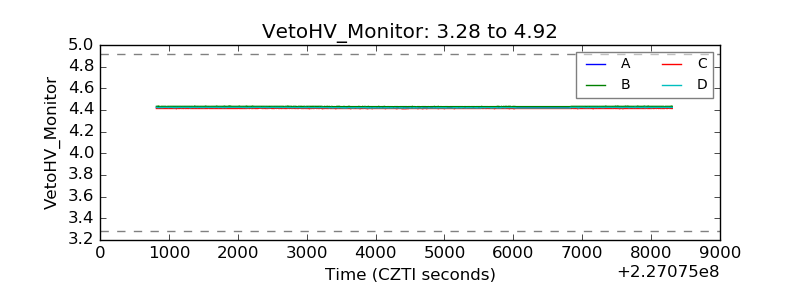 |
| Veto LLD | 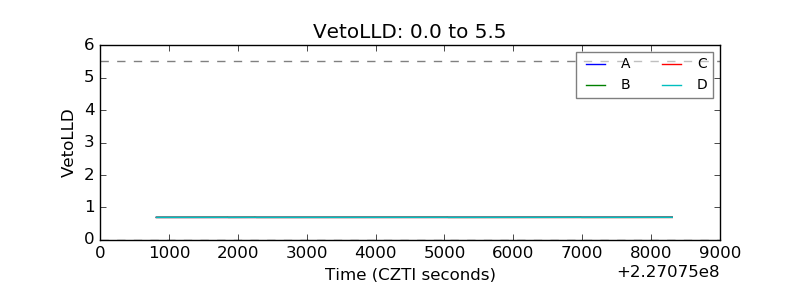 |
| Alpha Counter | 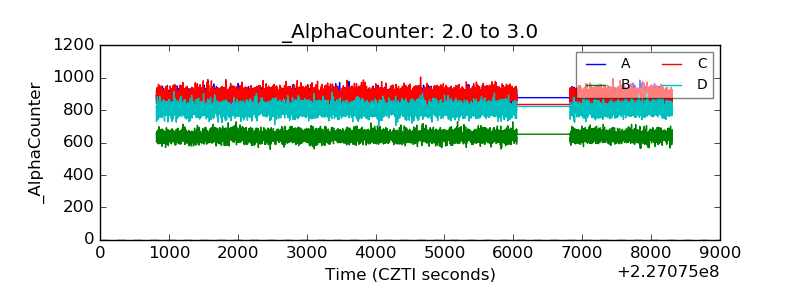 |
| _CPM_Rate | 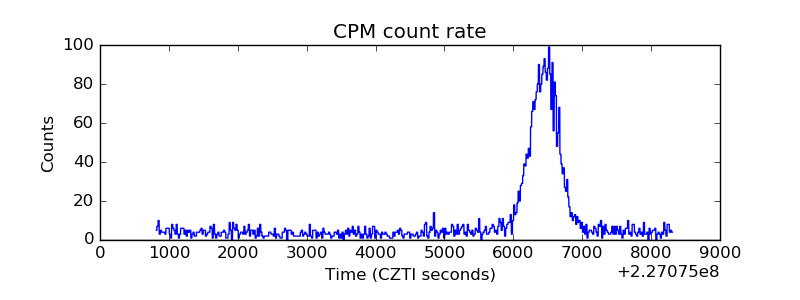 |
| CZT Counter | 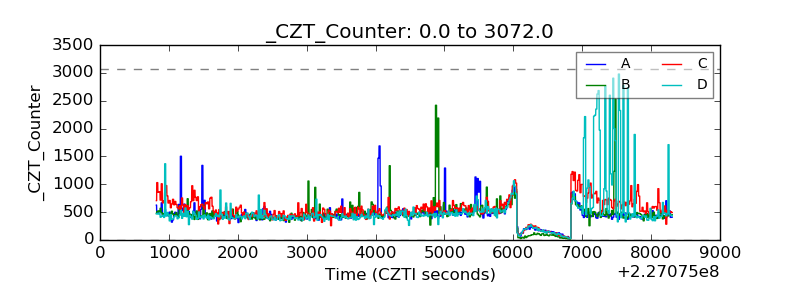 |
| +2.5 Volts monitor |  |
| +5 Volts monitor |  |
| _ROLL_ROT | 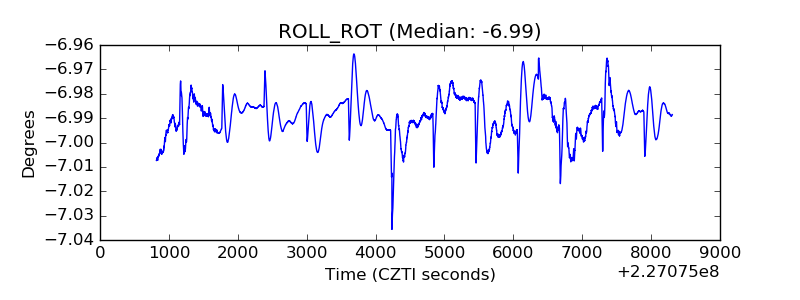 |
| _Roll_DEC | 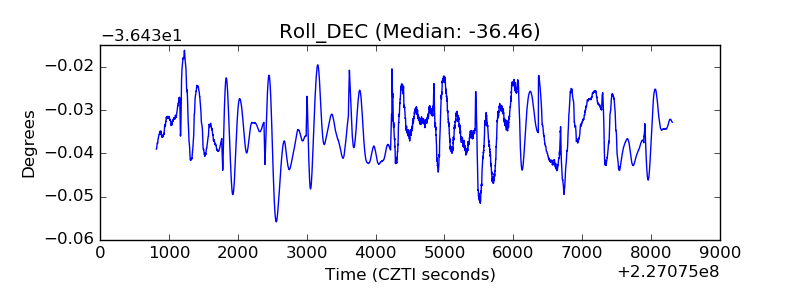 |
| _Roll_RA | 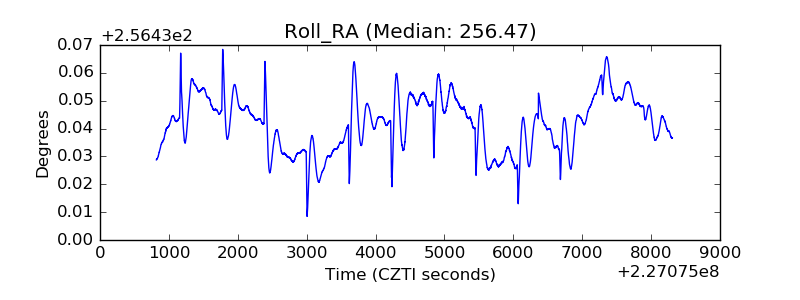 |
| Veto Counter | 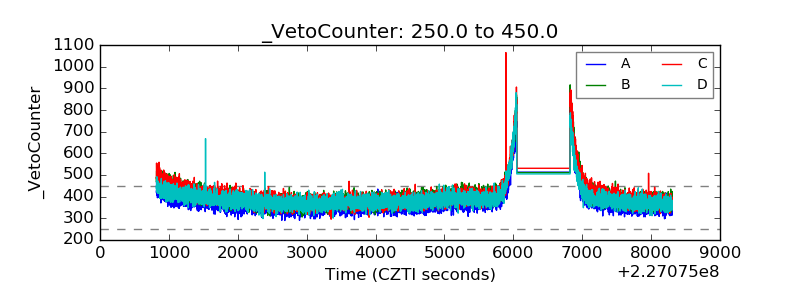 |