| Param | Original file | Final file |
|---|---|---|
| Filename | modeM0/AS1A02_071T01_9000001078_07885cztM0_level2.evt | modeM0/AS1A02_071T01_9000001078_07885cztM0_level2_quad_clean.evt |
| Size (bytes) | 449,066,880 | 92,494,080 |
| Size | 428.3 MB | 88.2 MB |
| Events in quadrant A | 3,059,327 | 594,540 |
| Events in quadrant B | 3,586,083 | 604,273 |
| Events in quadrant C | 3,078,070 | 592,536 |
| Events in quadrant D | 3,436,497 | 558,246 |
| Mode SS | |||
|---|---|---|---|
| Quadrant | BADHDUFLAG | Total packets | Discarded packets |
| A | 0 | 130 | 0 |
| B | 0 | 130 | 0 |
| C | 0 | 130 | 0 |
| D | 0 | 130 | 0 |
| Mode M0 | |||
|---|---|---|---|
| Quadrant | BADHDUFLAG | Total packets | Discarded packets |
| A | 0 | 13367 | 2 |
| B | 0 | 14912 | 1 |
| C | 0 | 13434 | 1 |
| D | 0 | 14675 | 1 |
| Mode M9 | |||
|---|---|---|---|
| Quadrant | BADHDUFLAG | Total packets | Discarded packets |
| A | 0 | 11 | 0 |
| B | 0 | 11 | 0 |
| C | 0 | 11 | 0 |
| D | 0 | 11 | 0 |
| Quadrant | Total seconds | Saturated seconds | Saturation percentage |
|---|---|---|---|
| A | 6478 | 43 | 0.663785% |
| B | 6478 | 213 | 3.288052% |
| C | 6478 | 25 | 0.385922% |
| D | 6478 | 98 | 1.512813% |
Noise dominated data is calculated using 1-second bins in cleaned event files. If a bin has >2000 counts, and if more than 50% of those come from <1% of pixels, then it is considered to be noise-dominated and hence unusable.
| Quadrant | # 1 sec bins | Bins with >0 counts | Bins with >2000 counts | High rate bins dominated by noise | Noise dominated (total time) | Noise dominated (detector-on time) | Marked lightcurve |
|---|---|---|---|---|---|---|---|
| A | 7578 | 6479 | 3 | 3 | 0.04% | 0.05% | 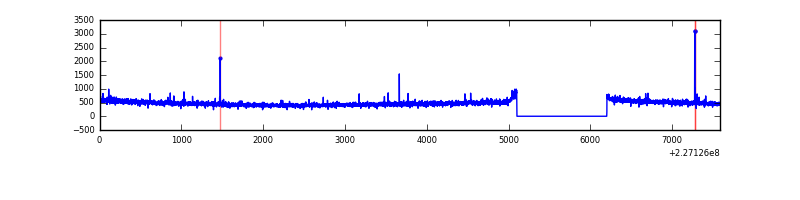 |
| B | 7578 | 6479 | 88 | 88 | 1.16% | 1.36% | 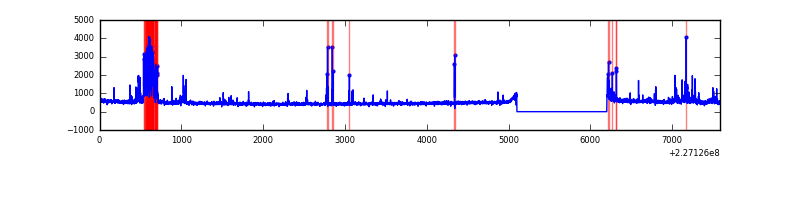 |
| C | 7578 | 6479 | 0 | 0 | 0.00% | 0.00% | 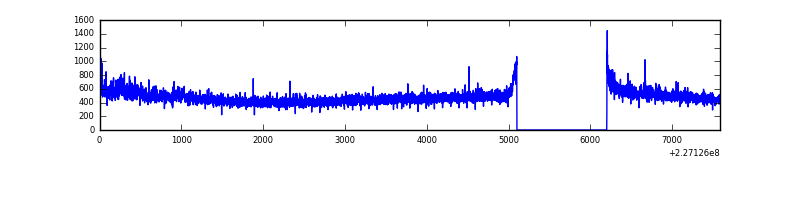 |
| D | 7578 | 6479 | 94 | 94 | 1.24% | 1.45% | 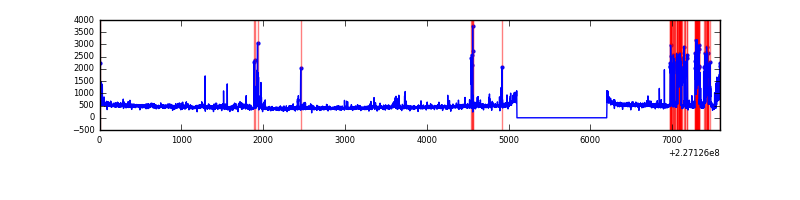 |
Top three noisy pixels from each quadrant. If the there are fewer than three noisy pixels in the level2.evt file, extra rows are filled as -1
| Pixel properties | Quadrant properties | ||||||
|---|---|---|---|---|---|---|---|
| Quadrant | DetID | PixID | Counts | Sigma | Mean | Median | Sigma |
| A | 15 | 174 | 11895 | 70.3 | 784 | 768 | 158.3 |
| A | 15 | 223 | 11477 | 67.66 | 784 | 768 | 158.3 |
| A | 3 | 1 | 8781 | 50.63 | 784 | 768 | 158.3 |
| B | 4 | 239 | 362003 | 2430.91 | 783 | 767 | 148.6 |
| B | 10 | 16 | 53639 | 355.8 | 783 | 767 | 148.6 |
| B | 4 | 81 | 48851 | 323.58 | 783 | 767 | 148.6 |
| C | 1 | 16 | 98657 | 557.33 | 763 | 769 | 175.6 |
| C | 13 | 61 | 5729 | 28.24 | 763 | 769 | 175.6 |
| C | 8 | 222 | 2335 | 8.92 | 763 | 769 | 175.6 |
| D | 1 | 20 | 310869 | 1687.0 | 755 | 733 | 183.8 |
| D | 2 | 152 | 100654 | 543.52 | 755 | 733 | 183.8 |
| D | 13 | 104 | 79615 | 429.08 | 755 | 733 | 183.8 |
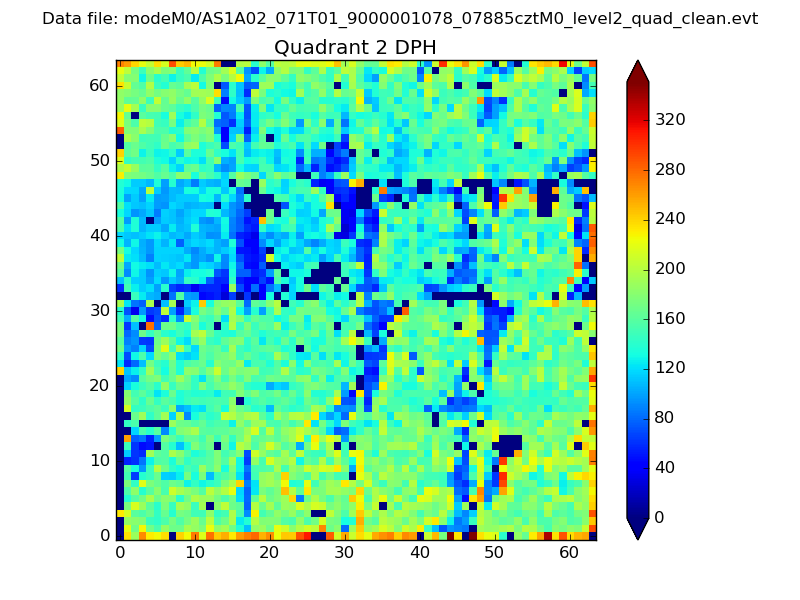
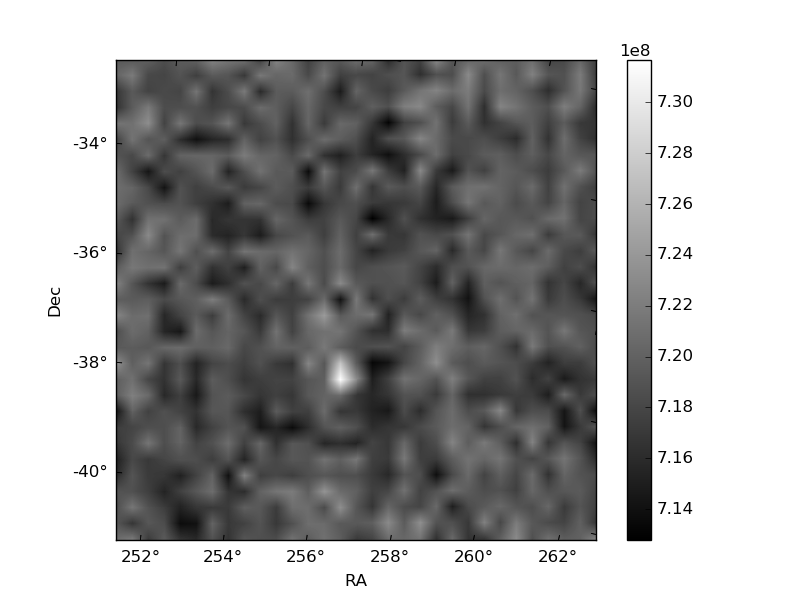
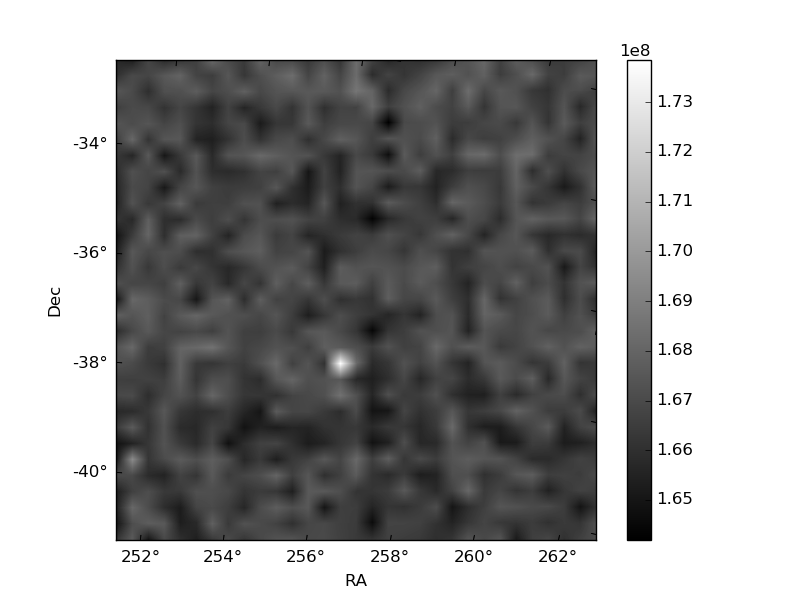
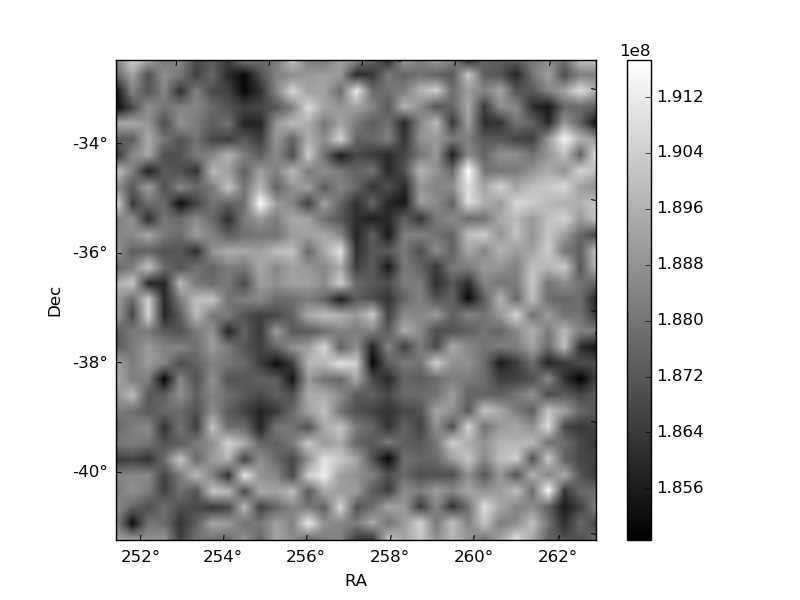
Histogram calculated using DETX and DETY for each event in the final _common_clean file
| Quadrant A | 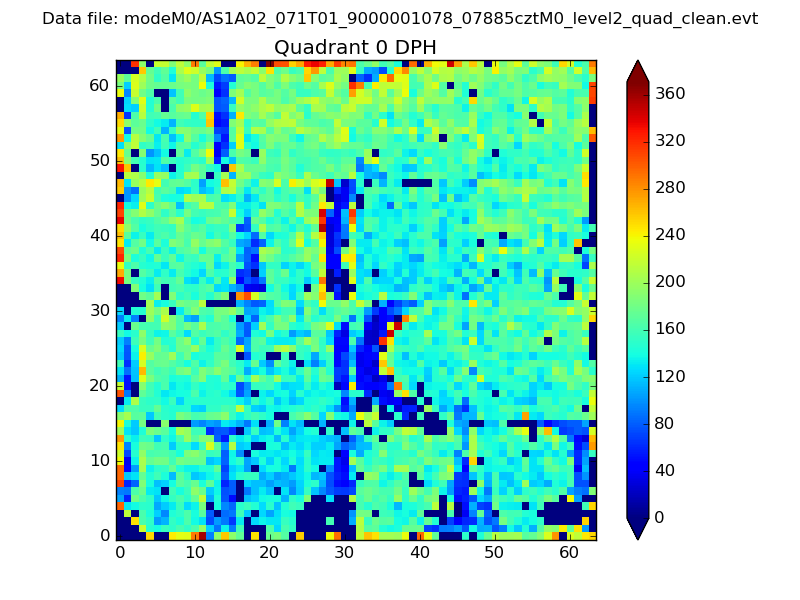 |
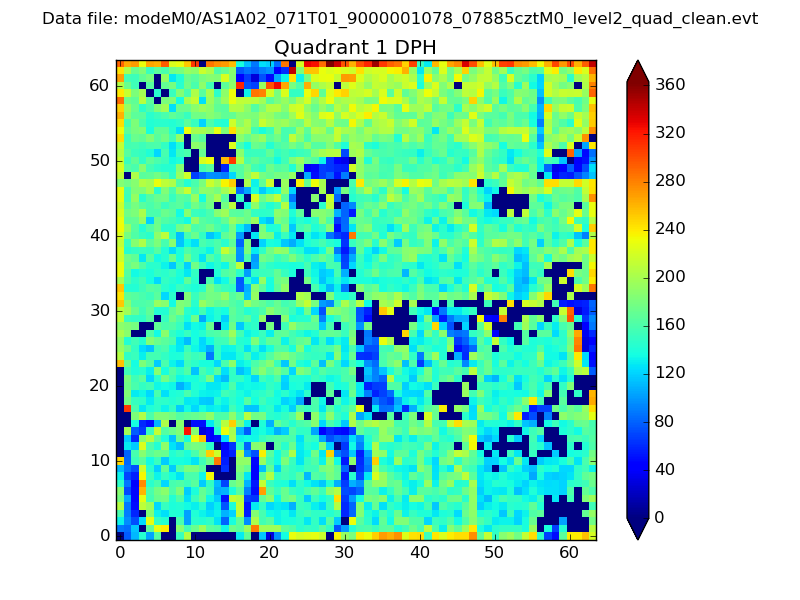 |
Quadrant B |
|---|---|---|---|
| Quadrant D | 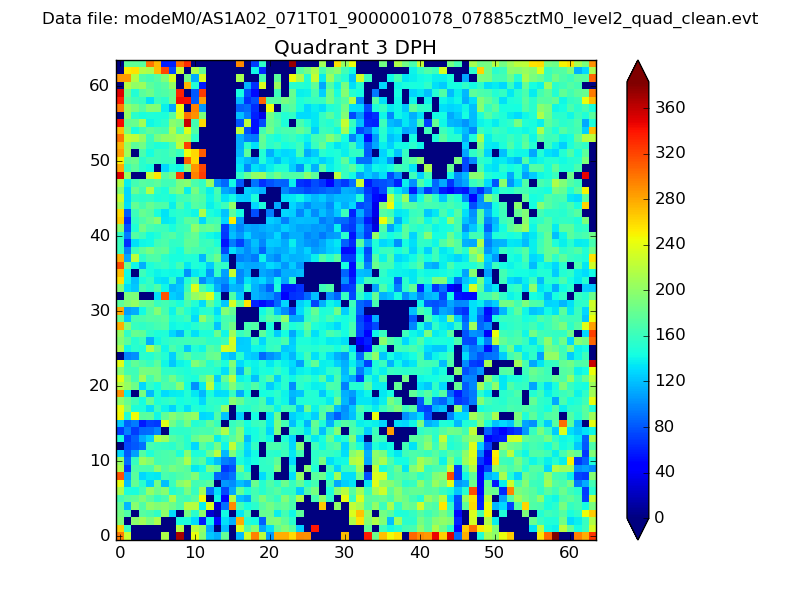 |
 |
Quadrant C |
| Plot type | Count rate plots | Images |
|---|---|---|
| Comparison with Poisson distribution Blue bars denote a histogram of data divided into 1 sec bins. Red curve is a Poisson curve with rate = median count rate of data. |
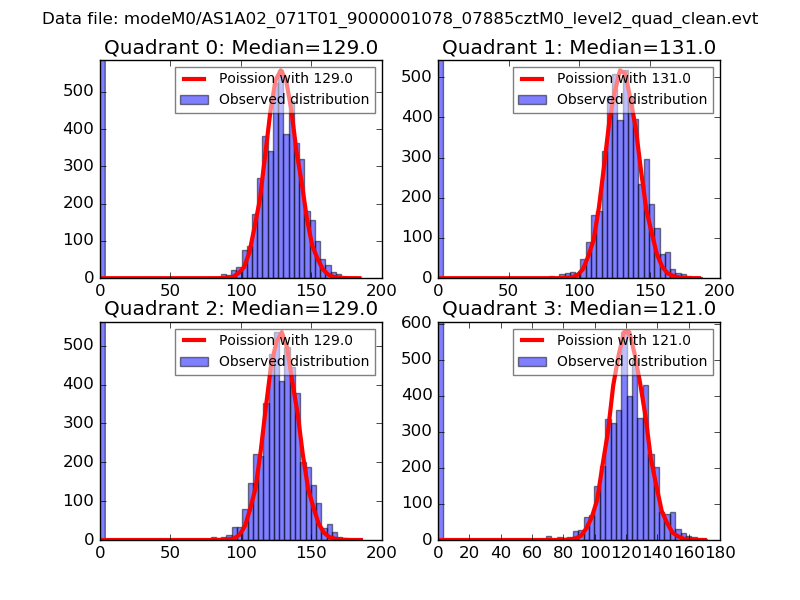 |
 |
| Quadrant-wise count rates Data is divided into 100 sec bins |
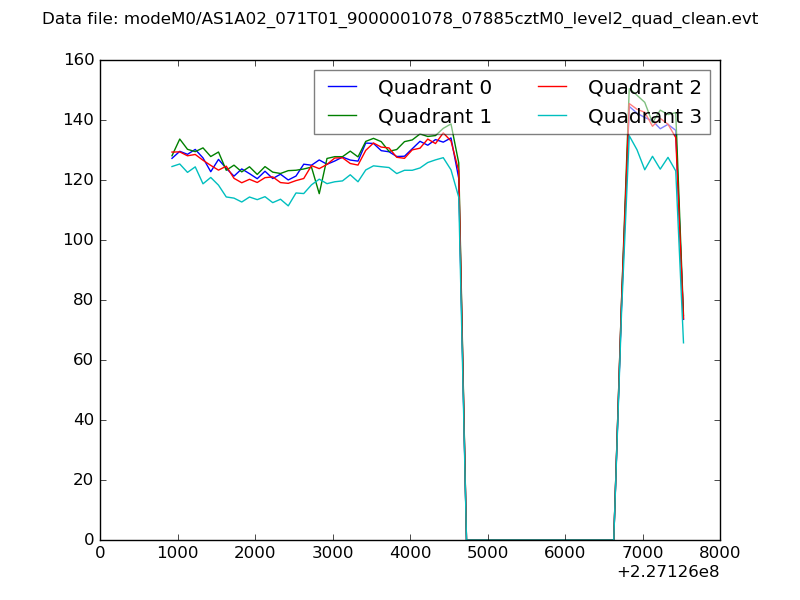 |
|
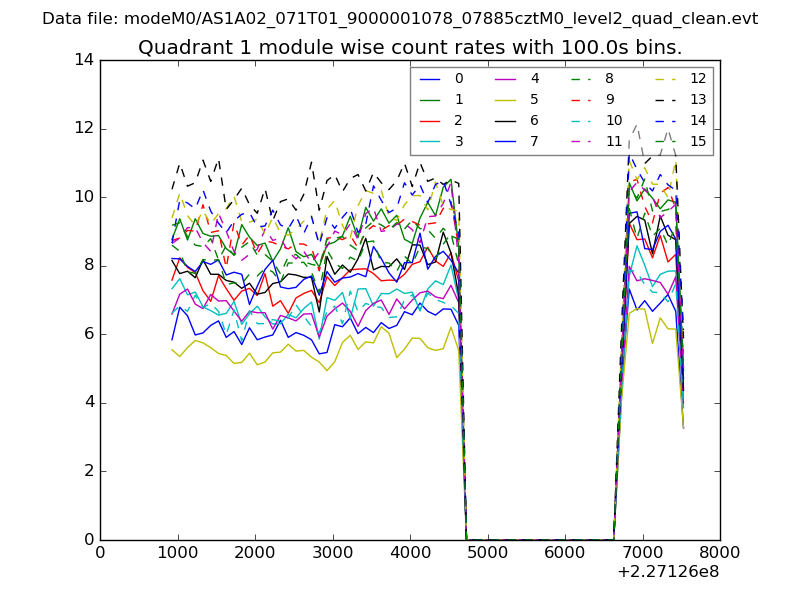
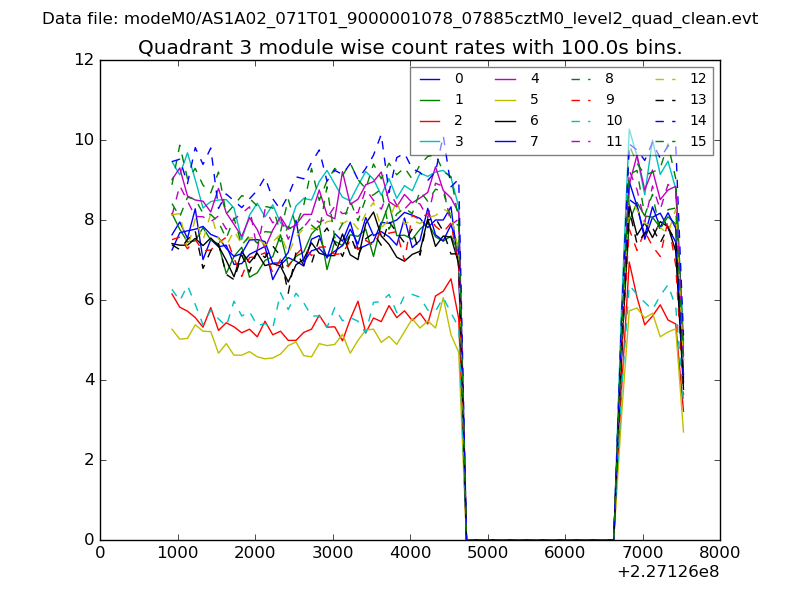
| Module-wise count rates for Quadrant A Data is divided into 100 sec bins |
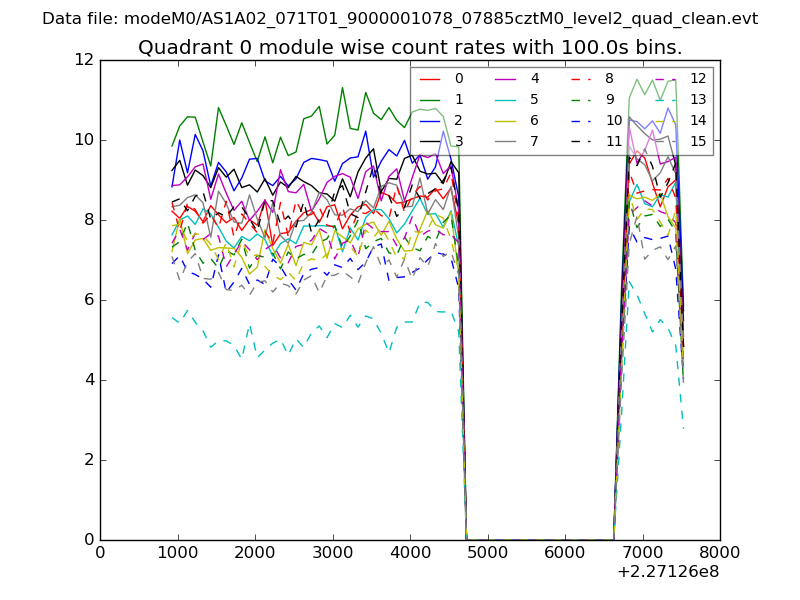 |
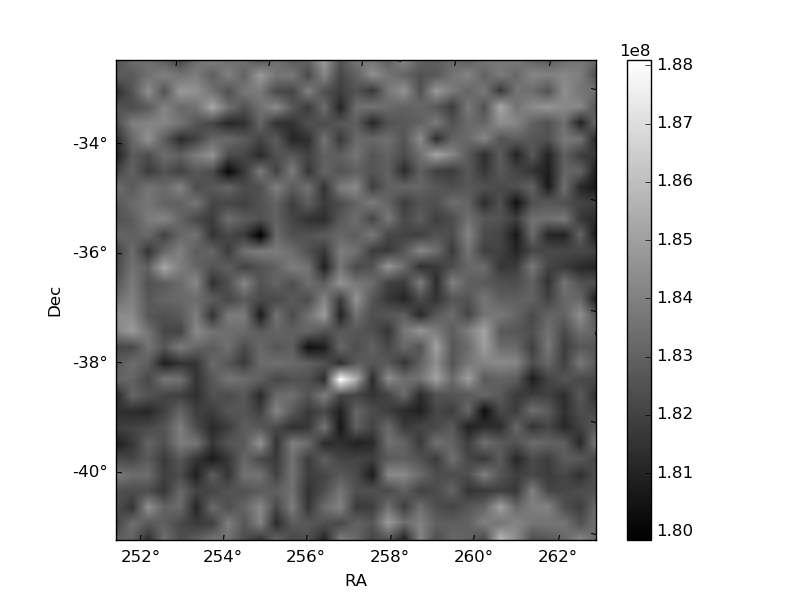 |
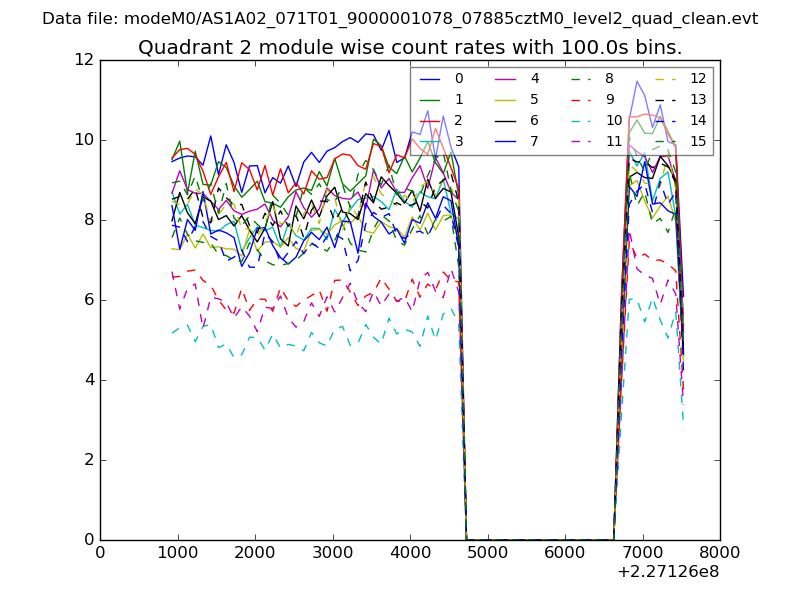
| Module-wise count rates for Quadrant B Data is divided into 100 sec bins |
 |
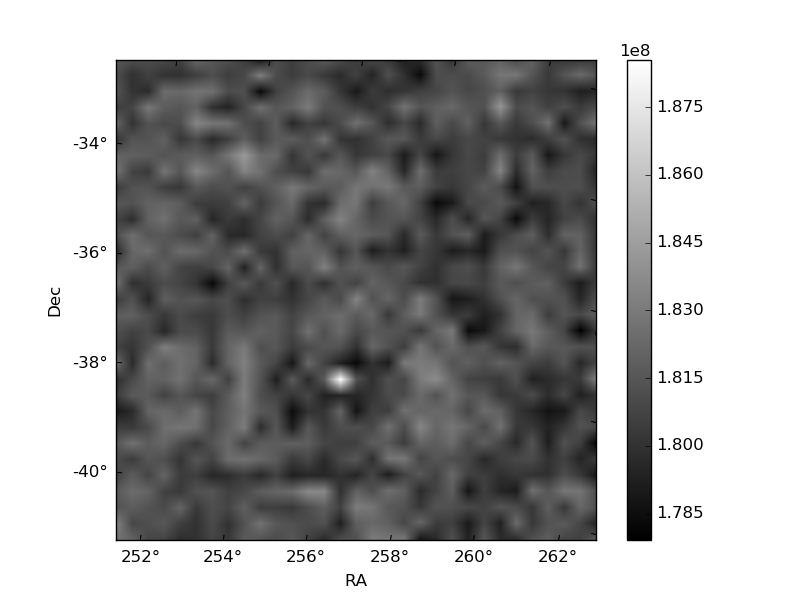 |
| Module-wise count rates for Quadrant C Data is divided into 100 sec bins |
 |
 |
| Module-wise count rates for Quadrant D Data is divided into 100 sec bins |
 |
 |
| Parameter | Plot |
|---|---|
| CZT HV Monitor | 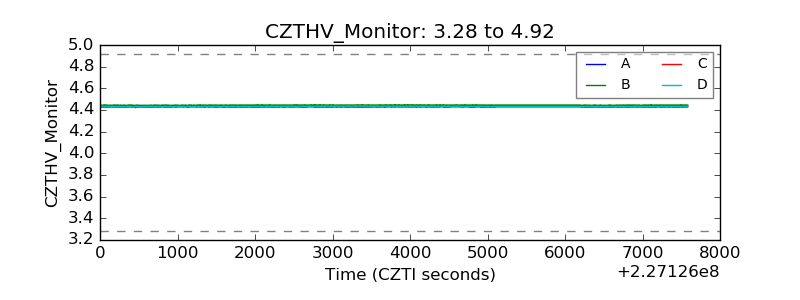 |
| D_VDD | 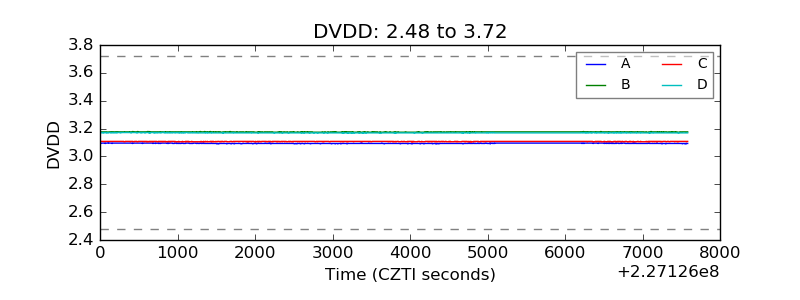 |
| Temperature 1 | 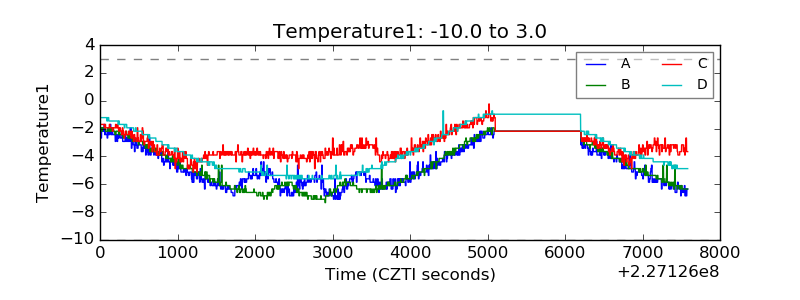 |
| Veto HV Monitor | 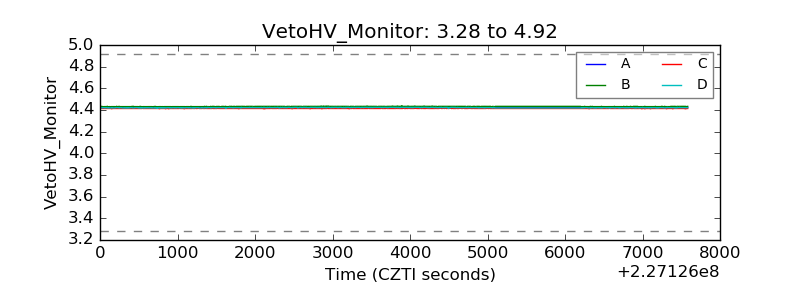 |
| Veto LLD | 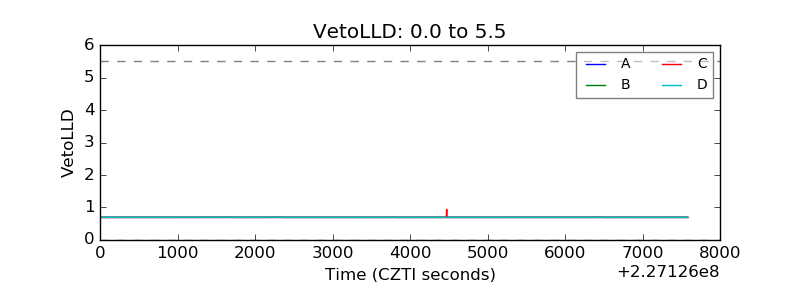 |
| Alpha Counter | 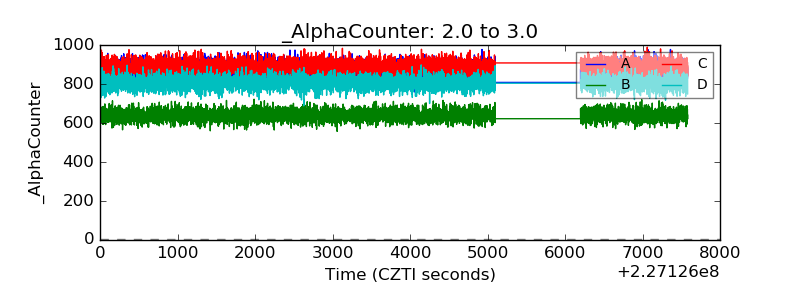 |
| _CPM_Rate | 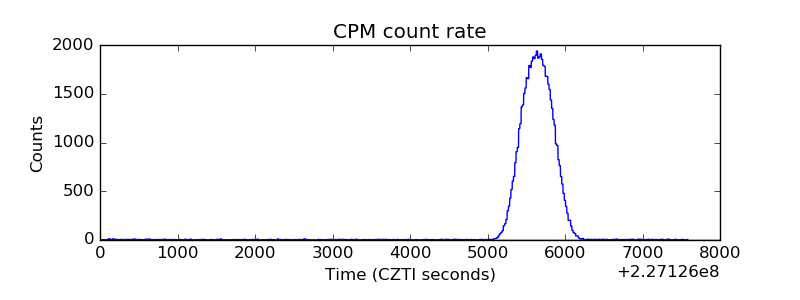 |
| CZT Counter | 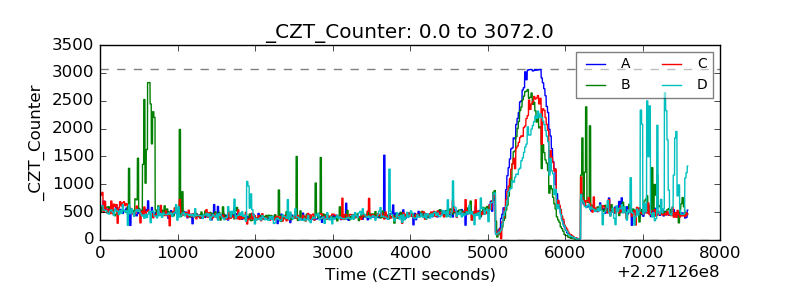 |
| +2.5 Volts monitor |  |
| +5 Volts monitor |  |
| _ROLL_ROT | 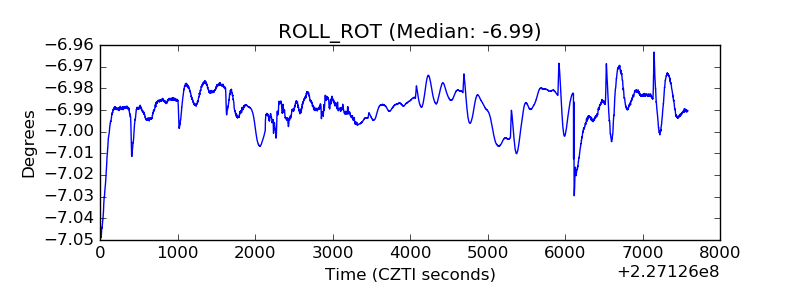 |
| _Roll_DEC | 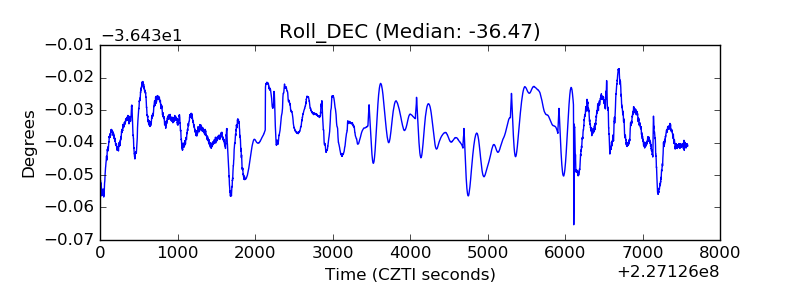 |
| _Roll_RA | 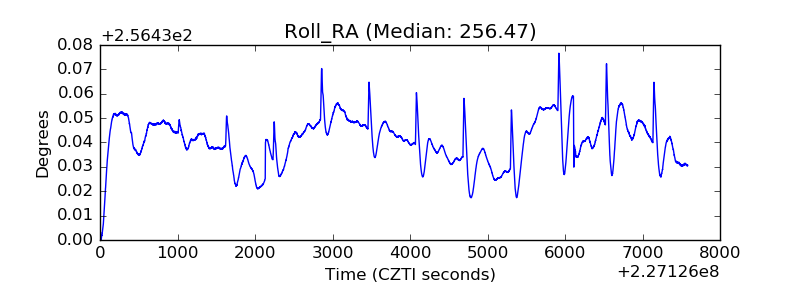 |
| Veto Counter | 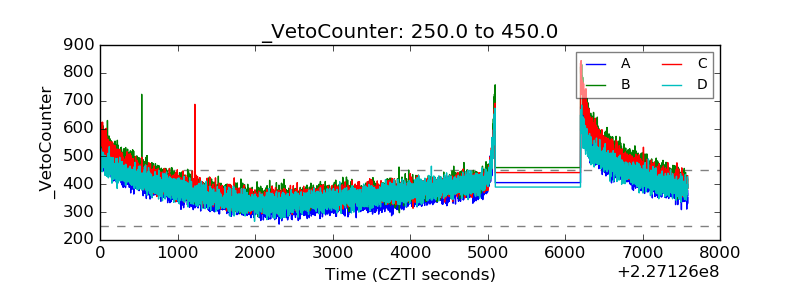 |