| Param | Original file | Final file |
|---|---|---|
| Filename | modeM0/AS1A02_071T01_9000001078_07886cztM0_level2.evt | modeM0/AS1A02_071T01_9000001078_07886cztM0_level2_quad_clean.evt |
| Size (bytes) | 466,110,720 | 100,344,960 |
| Size | 444.5 MB | 95.7 MB |
| Events in quadrant A | 2,931,515 | 663,128 |
| Events in quadrant B | 3,076,971 | 682,782 |
| Events in quadrant C | 2,923,349 | 666,686 |
| Events in quadrant D | 4,774,042 | 604,174 |
| Mode SS | |||
|---|---|---|---|
| Quadrant | BADHDUFLAG | Total packets | Discarded packets |
| A | 0 | 124 | 0 |
| B | 0 | 124 | 0 |
| C | 0 | 124 | 0 |
| D | 0 | 124 | 0 |
| Mode M0 | |||
|---|---|---|---|
| Quadrant | BADHDUFLAG | Total packets | Discarded packets |
| A | 0 | 12631 | 2 |
| B | 0 | 13073 | 1 |
| C | 0 | 12532 | 1 |
| D | 0 | 18264 | 1 |
| Mode M9 | |||
|---|---|---|---|
| Quadrant | BADHDUFLAG | Total packets | Discarded packets |
| A | 0 | 12 | 0 |
| B | 0 | 12 | 0 |
| C | 0 | 12 | 0 |
| D | 0 | 12 | 0 |
| Quadrant | Total seconds | Saturated seconds | Saturation percentage |
|---|---|---|---|
| A | 6040 | 25 | 0.413907% |
| B | 6040 | 48 | 0.794702% |
| C | 6040 | 8 | 0.132450% |
| D | 6040 | 370 | 6.125828% |
Noise dominated data is calculated using 1-second bins in cleaned event files. If a bin has >2000 counts, and if more than 50% of those come from <1% of pixels, then it is considered to be noise-dominated and hence unusable.
| Quadrant | # 1 sec bins | Bins with >0 counts | Bins with >2000 counts | High rate bins dominated by noise | Noise dominated (total time) | Noise dominated (detector-on time) | Marked lightcurve |
|---|---|---|---|---|---|---|---|
| A | 7260 | 6041 | 6 | 6 | 0.08% | 0.10% | 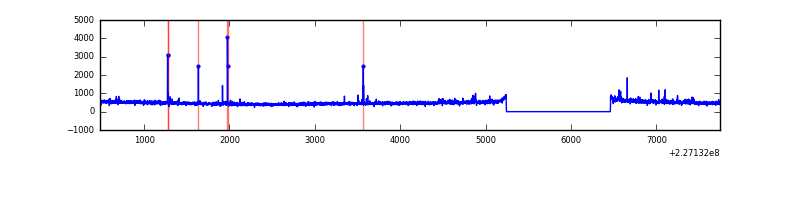 |
| B | 7260 | 6041 | 13 | 13 | 0.18% | 0.22% | 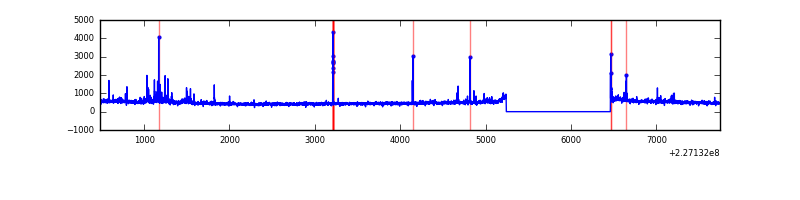 |
| C | 7260 | 6041 | 0 | 0 | 0.00% | 0.00% | 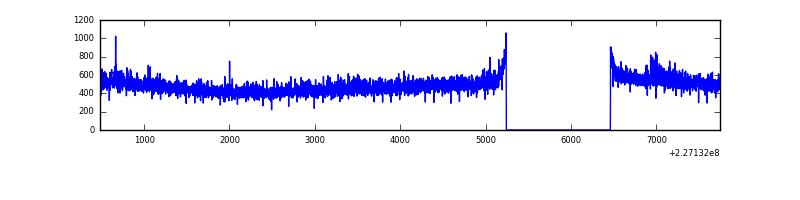 |
| D | 7260 | 6041 | 505 | 505 | 6.96% | 8.36% | 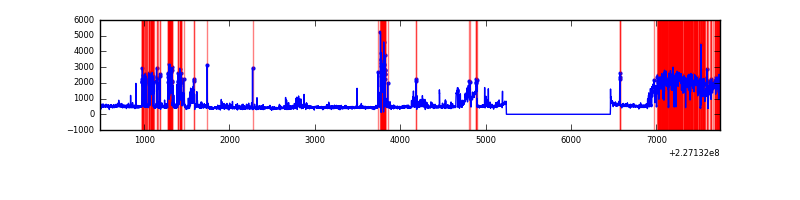 |
Top three noisy pixels from each quadrant. If the there are fewer than three noisy pixels in the level2.evt file, extra rows are filled as -1
| Pixel properties | Quadrant properties | ||||||
|---|---|---|---|---|---|---|---|
| Quadrant | DetID | PixID | Counts | Sigma | Mean | Median | Sigma |
| A | 8 | 15 | 48067 | 316.36 | 735 | 722 | 149.7 |
| A | 15 | 223 | 26515 | 172.35 | 735 | 722 | 149.7 |
| A | 15 | 239 | 11450 | 71.69 | 735 | 722 | 149.7 |
| B | 4 | 81 | 42712 | 298.36 | 746 | 731 | 140.7 |
| B | 11 | 51 | 39586 | 276.15 | 746 | 731 | 140.7 |
| B | 4 | 239 | 38618 | 269.27 | 746 | 731 | 140.7 |
| C | 1 | 16 | 106053 | 634.37 | 722 | 729 | 166.0 |
| C | 13 | 61 | 5557 | 29.08 | 722 | 729 | 166.0 |
| C | 3 | 202 | 1793 | 6.41 | 722 | 729 | 166.0 |
| D | 1 | 52 | 1491712 | 8898.21 | 698 | 682 | 167.6 |
| D | 1 | 20 | 316412 | 1884.22 | 698 | 682 | 167.6 |
| D | 2 | 152 | 183808 | 1092.86 | 698 | 682 | 167.6 |
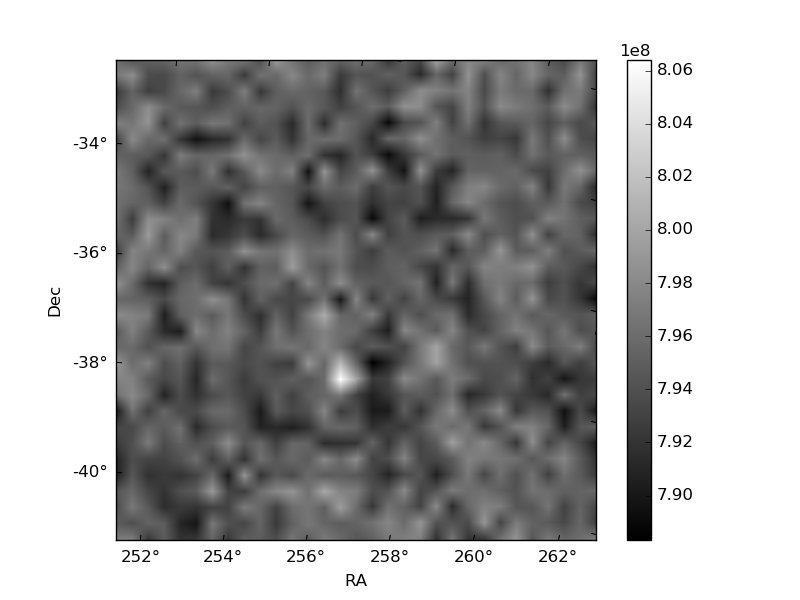
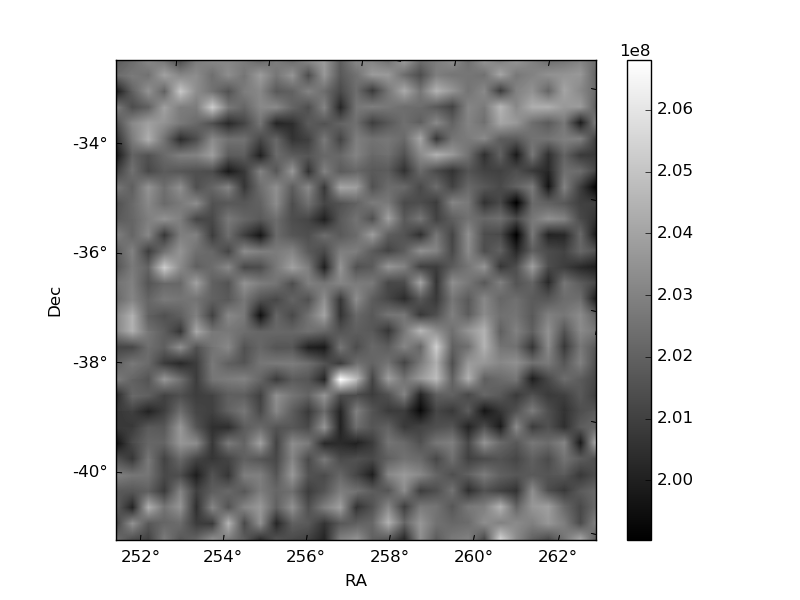
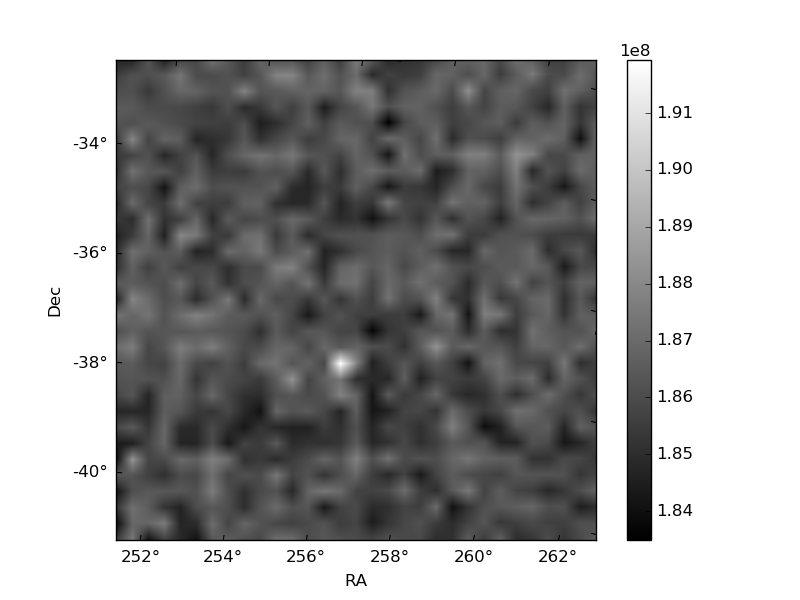
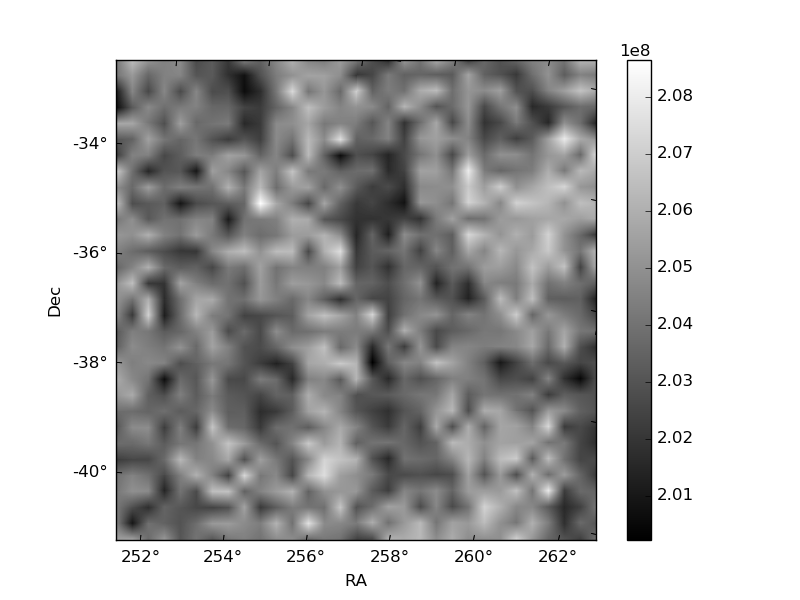
Histogram calculated using DETX and DETY for each event in the final _common_clean file
| Quadrant A | 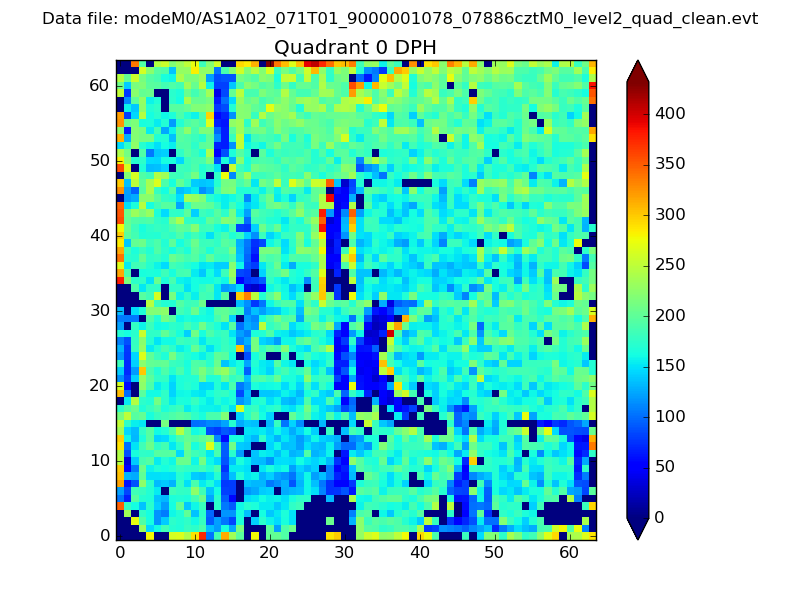 |
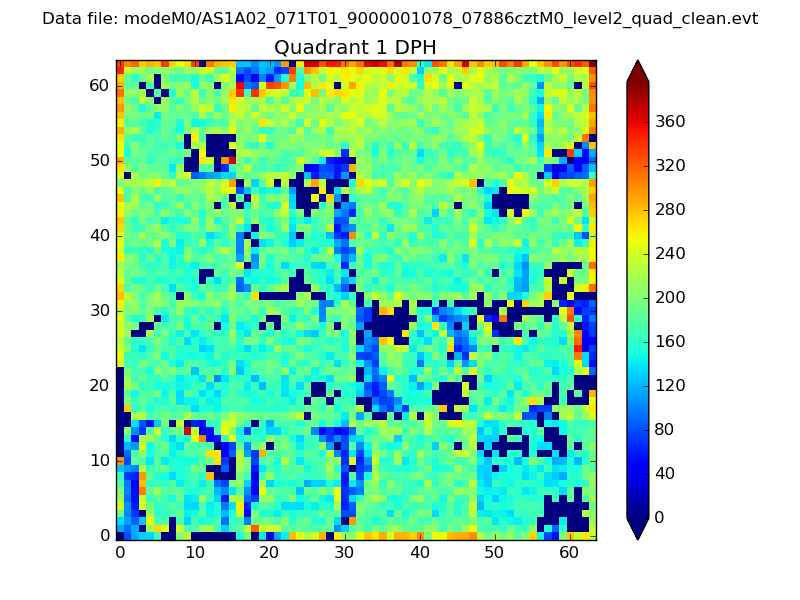 |
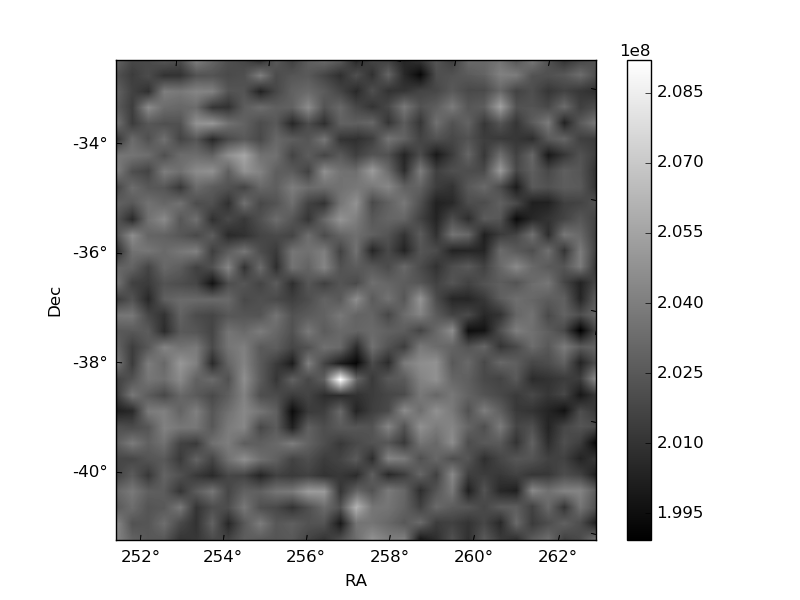
Quadrant B |
|---|---|---|---|
| Quadrant D | 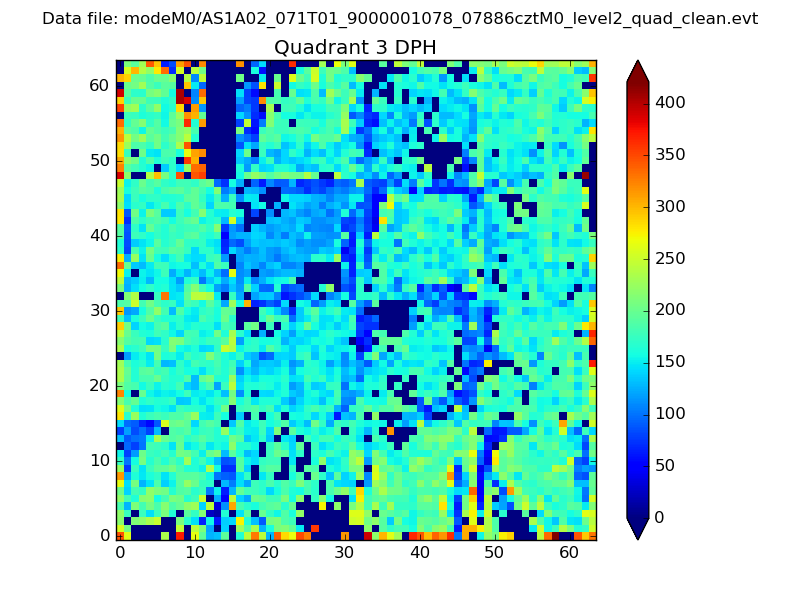 |
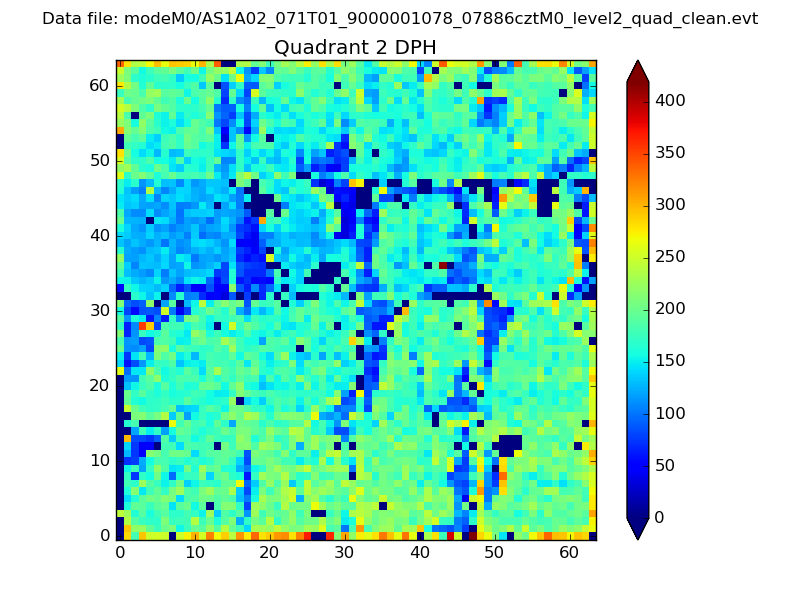 |
Quadrant C |
| Plot type | Count rate plots | Images |
|---|---|---|
| Comparison with Poisson distribution Blue bars denote a histogram of data divided into 1 sec bins. Red curve is a Poisson curve with rate = median count rate of data. |
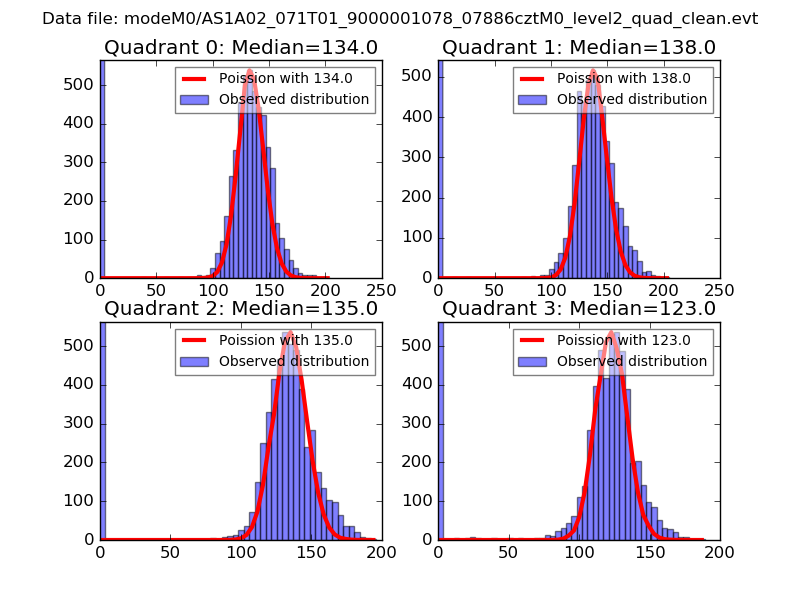 |
 |
| Quadrant-wise count rates Data is divided into 100 sec bins |
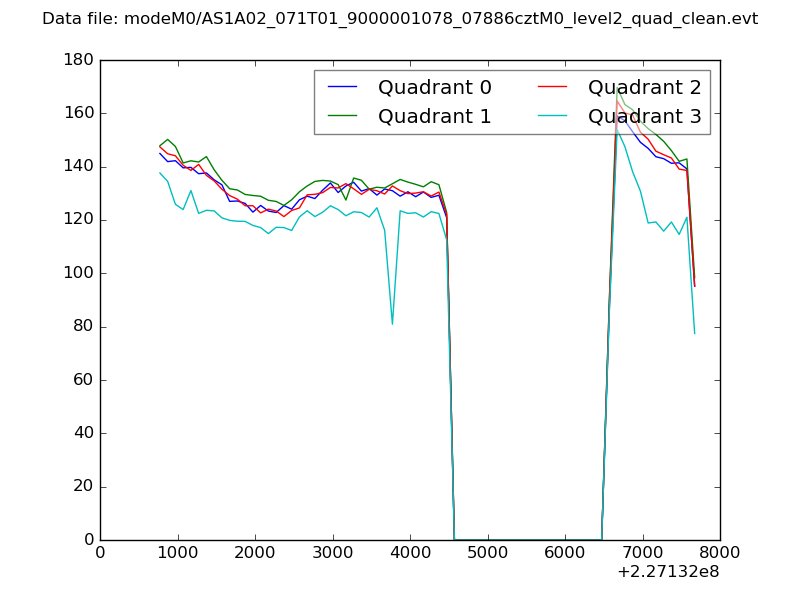 |
|
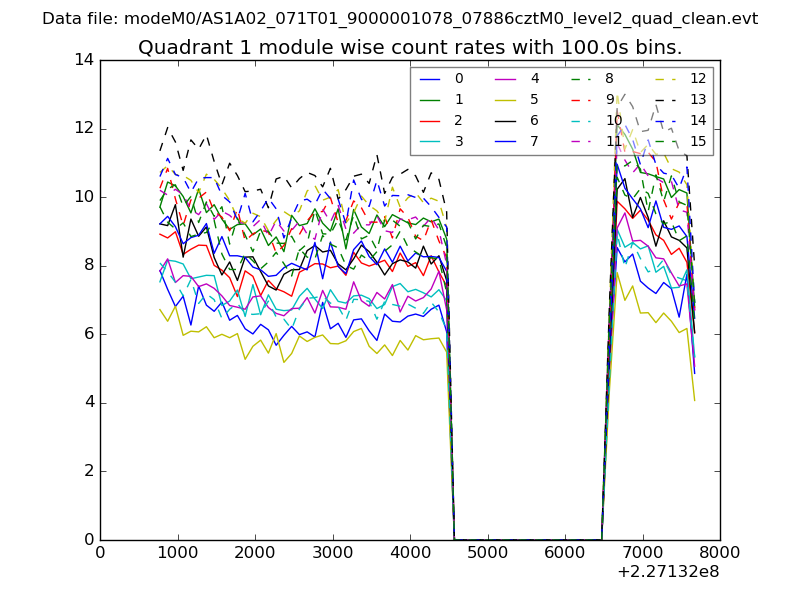
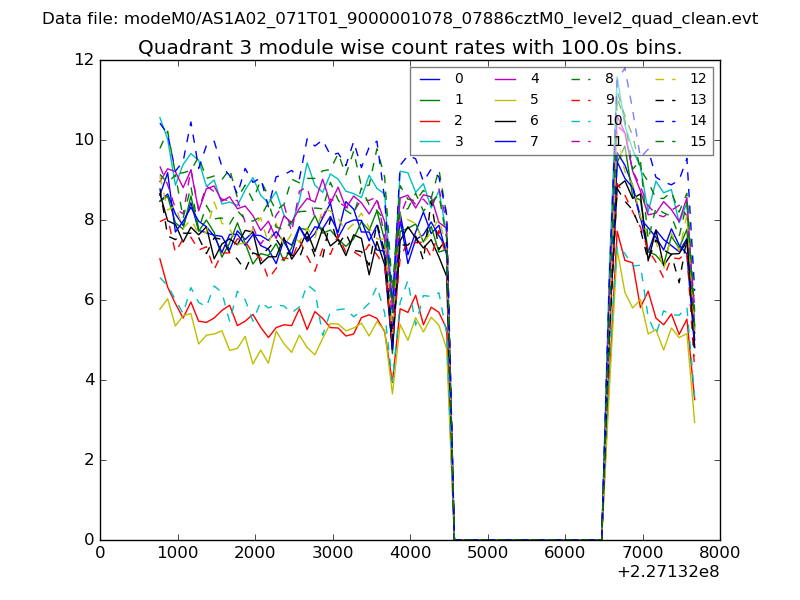
| Module-wise count rates for Quadrant A Data is divided into 100 sec bins |
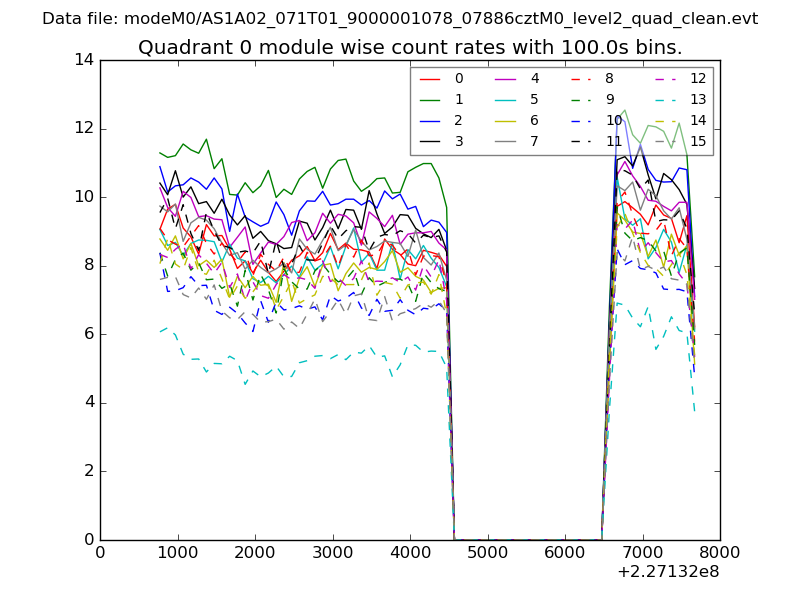 |
 |
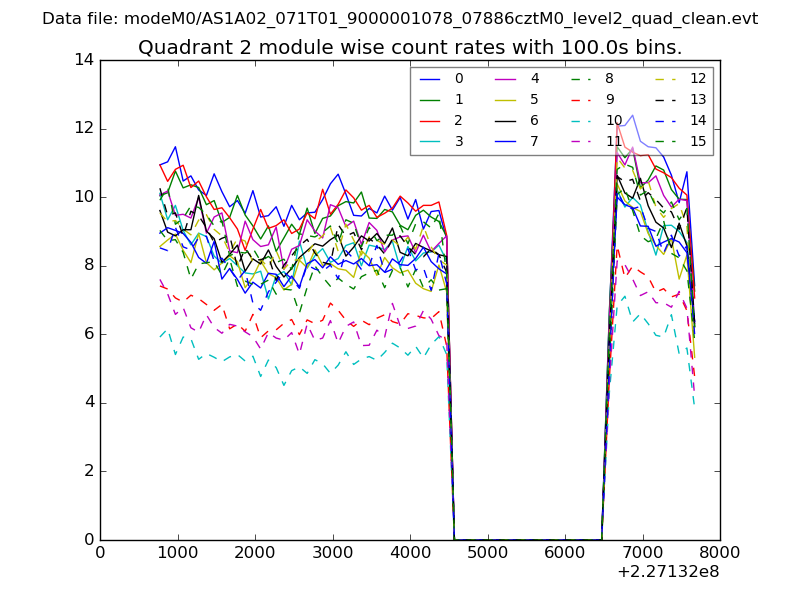
| Module-wise count rates for Quadrant B Data is divided into 100 sec bins |
 |
 |
| Module-wise count rates for Quadrant C Data is divided into 100 sec bins |
 |
 |
| Module-wise count rates for Quadrant D Data is divided into 100 sec bins |
 |
 |
| Parameter | Plot |
|---|---|
| CZT HV Monitor | 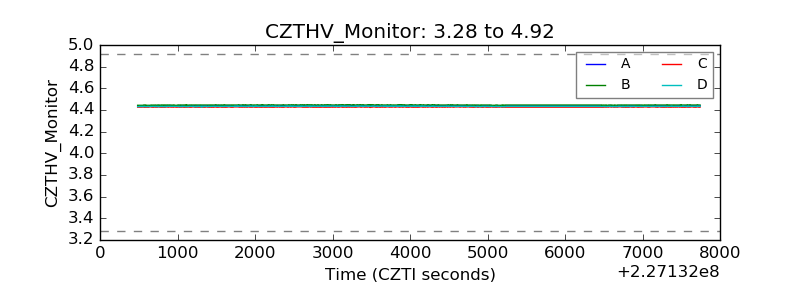 |
| D_VDD | 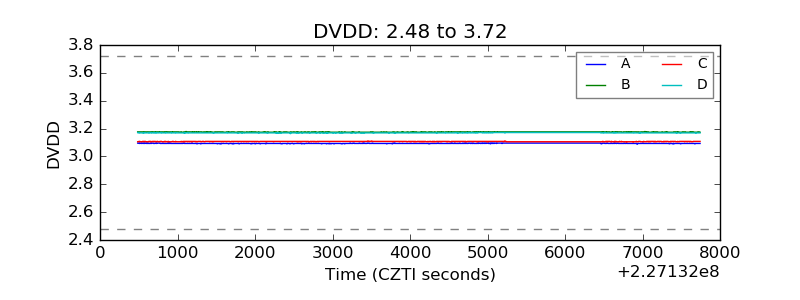 |
| Temperature 1 | 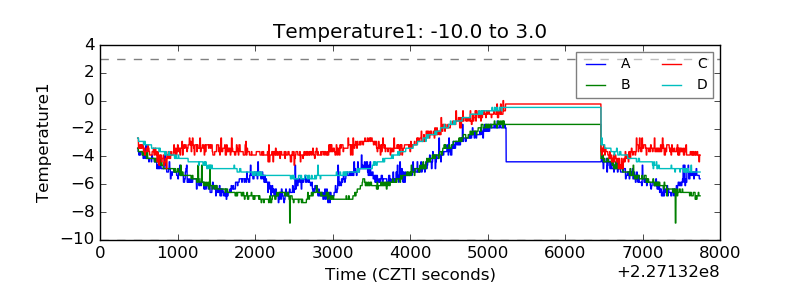 |
| Veto HV Monitor | 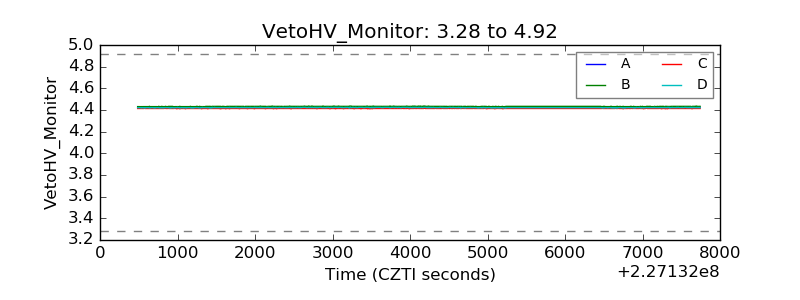 |
| Veto LLD | 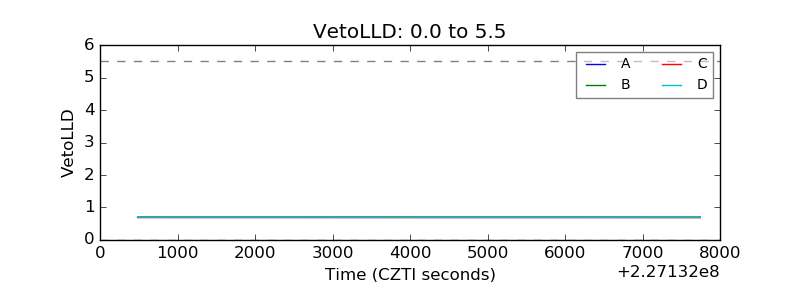 |
| Alpha Counter | 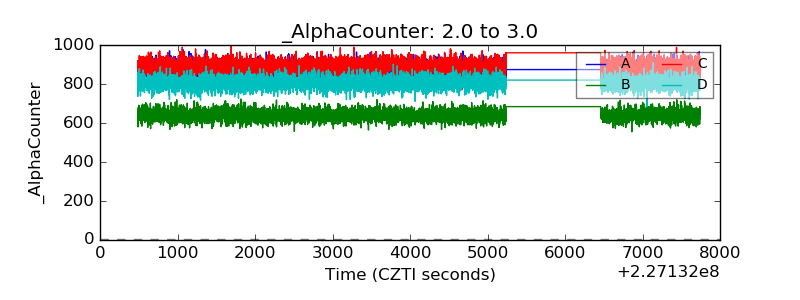 |
| _CPM_Rate | 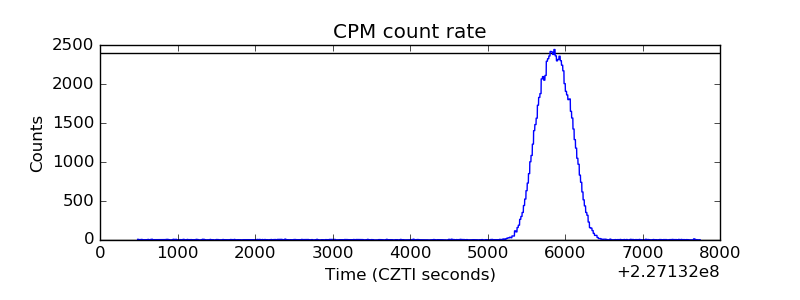 |
| CZT Counter | 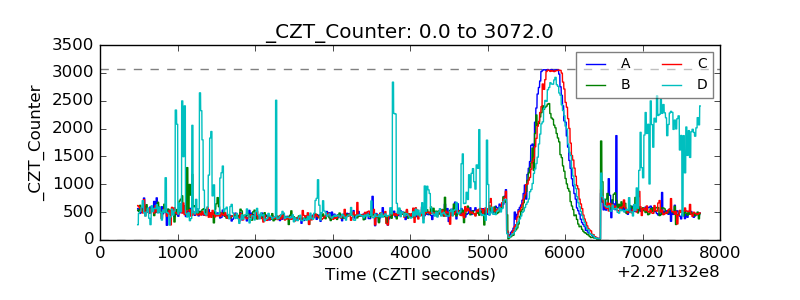 |
| +2.5 Volts monitor |  |
| +5 Volts monitor |  |
| _ROLL_ROT | 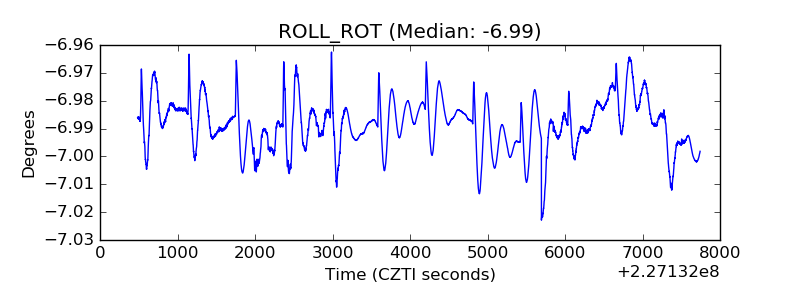 |
| _Roll_DEC | 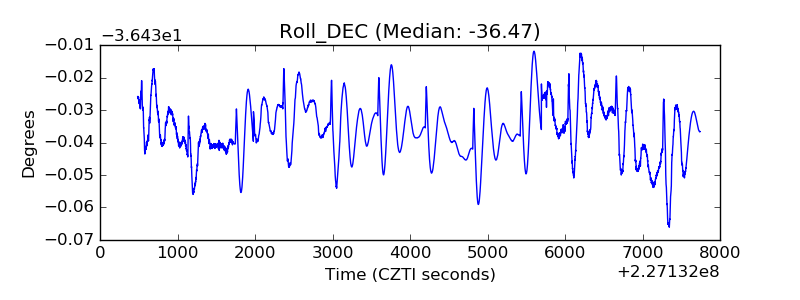 |
| _Roll_RA | 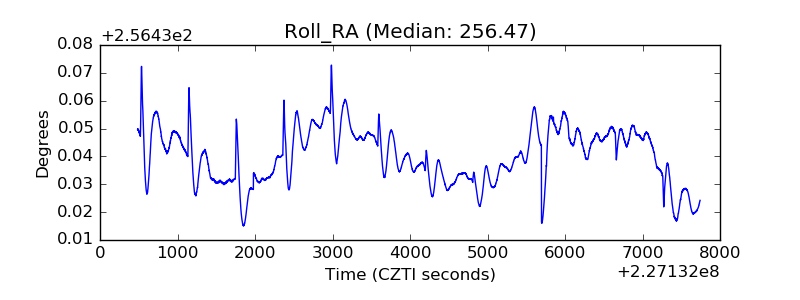 |
| Veto Counter | 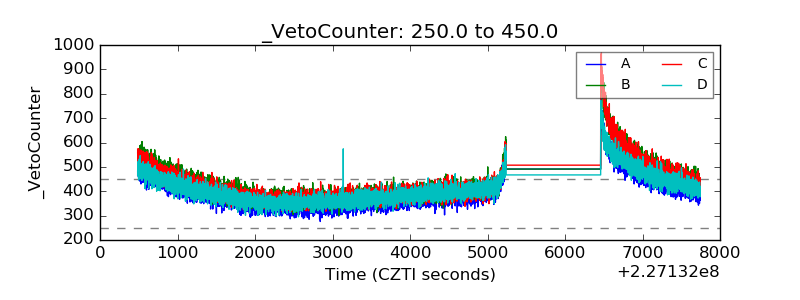 |