| Param | Original file | Final file |
|---|---|---|
| Filename | modeM0/AS1A02_071T01_9000001078_07888cztM0_level2.evt | modeM0/AS1A02_071T01_9000001078_07888cztM0_level2_quad_clean.evt |
| Size (bytes) | 459,927,360 | 100,607,040 |
| Size | 438.6 MB | 95.9 MB |
| Events in quadrant A | 3,488,148 | 648,512 |
| Events in quadrant B | 3,334,407 | 679,049 |
| Events in quadrant C | 3,536,459 | 662,673 |
| Events in quadrant D | 3,148,213 | 623,420 |
| Mode SS | |||
|---|---|---|---|
| Quadrant | BADHDUFLAG | Total packets | Discarded packets |
| A | 0 | 126 | 0 |
| B | 0 | 126 | 0 |
| C | 0 | 126 | 0 |
| D | 0 | 126 | 0 |
| Mode M0 | |||
|---|---|---|---|
| Quadrant | BADHDUFLAG | Total packets | Discarded packets |
| A | 0 | 14442 | 3 |
| B | 0 | 13858 | 2 |
| C | 0 | 14472 | 2 |
| D | 0 | 13579 | 2 |
| Mode M9 | |||
|---|---|---|---|
| Quadrant | BADHDUFLAG | Total packets | Discarded packets |
| A | 0 | 24 | 0 |
| B | 0 | 24 | 0 |
| C | 0 | 24 | 0 |
| D | 0 | 25 | 0 |
| Quadrant | Total seconds | Saturated seconds | Saturation percentage |
|---|---|---|---|
| A | 6209 | 157 | 2.528588% |
| B | 6209 | 134 | 2.158158% |
| C | 6209 | 47 | 0.756966% |
| D | 6209 | 48 | 0.773071% |
Noise dominated data is calculated using 1-second bins in cleaned event files. If a bin has >2000 counts, and if more than 50% of those come from <1% of pixels, then it is considered to be noise-dominated and hence unusable.
| Quadrant | # 1 sec bins | Bins with >0 counts | Bins with >2000 counts | High rate bins dominated by noise | Noise dominated (total time) | Noise dominated (detector-on time) | Marked lightcurve |
|---|---|---|---|---|---|---|---|
| A | 7509 | 6210 | 108 | 108 | 1.44% | 1.74% | 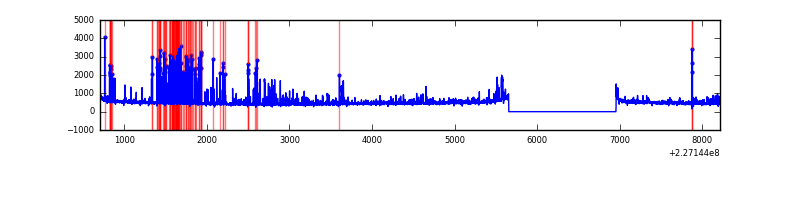 |
| B | 7509 | 6210 | 41 | 41 | 0.55% | 0.66% | 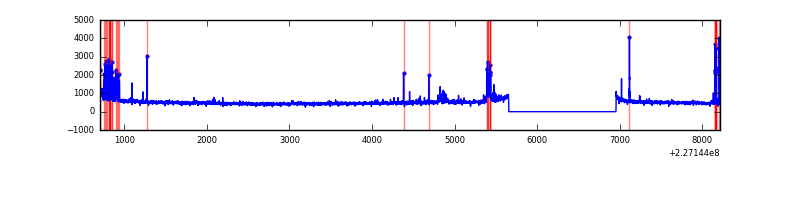 |
| C | 7509 | 6210 | 10 | 10 | 0.13% | 0.16% | 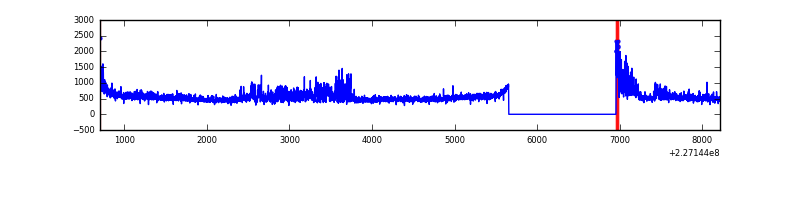 |
| D | 7509 | 6210 | 35 | 35 | 0.47% | 0.56% | 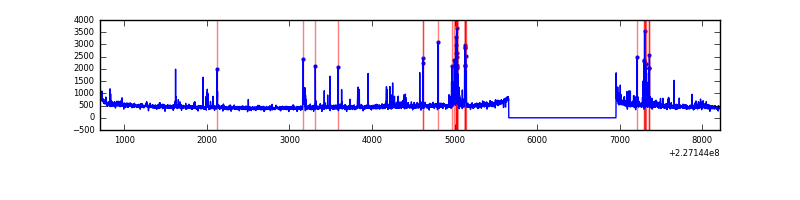 |
Top three noisy pixels from each quadrant. If the there are fewer than three noisy pixels in the level2.evt file, extra rows are filled as -1
| Pixel properties | Quadrant properties | ||||||
|---|---|---|---|---|---|---|---|
| Quadrant | DetID | PixID | Counts | Sigma | Mean | Median | Sigma |
| A | 15 | 239 | 569526 | 3724.68 | 756 | 740 | 152.7 |
| A | 0 | 226 | 6921 | 40.48 | 756 | 740 | 152.7 |
| A | 12 | 194 | 6445 | 37.36 | 756 | 740 | 152.7 |
| B | 11 | 51 | 124662 | 857.15 | 776 | 760 | 144.6 |
| B | 4 | 239 | 88004 | 603.55 | 776 | 760 | 144.6 |
| B | 4 | 80 | 42669 | 289.93 | 776 | 760 | 144.6 |
| C | 1 | 16 | 573376 | 3258.83 | 759 | 764 | 175.7 |
| C | 13 | 61 | 5713 | 28.17 | 759 | 764 | 175.7 |
| C | 12 | 4 | 3484 | 15.48 | 759 | 764 | 175.7 |
| D | 13 | 104 | 98530 | 538.15 | 744 | 723 | 181.7 |
| D | 12 | 233 | 95417 | 521.02 | 744 | 723 | 181.7 |
| D | 1 | 20 | 47500 | 257.37 | 744 | 723 | 181.7 |
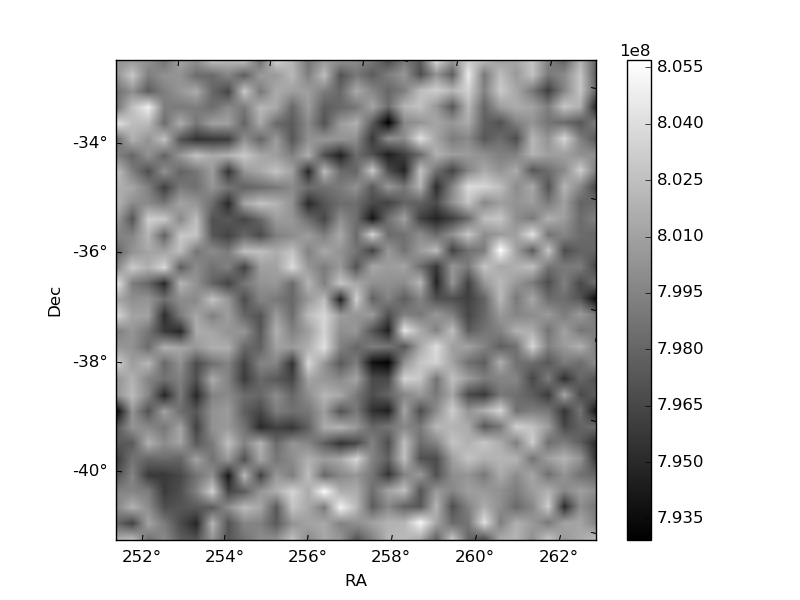
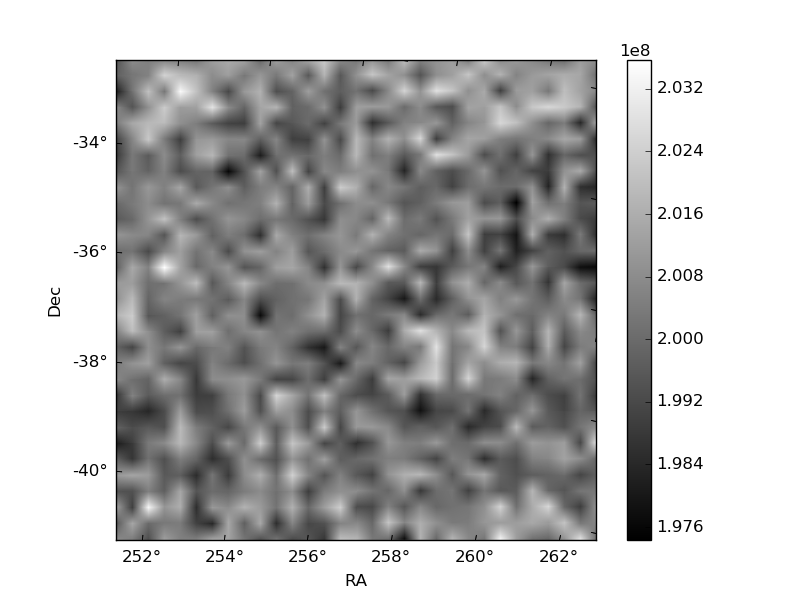
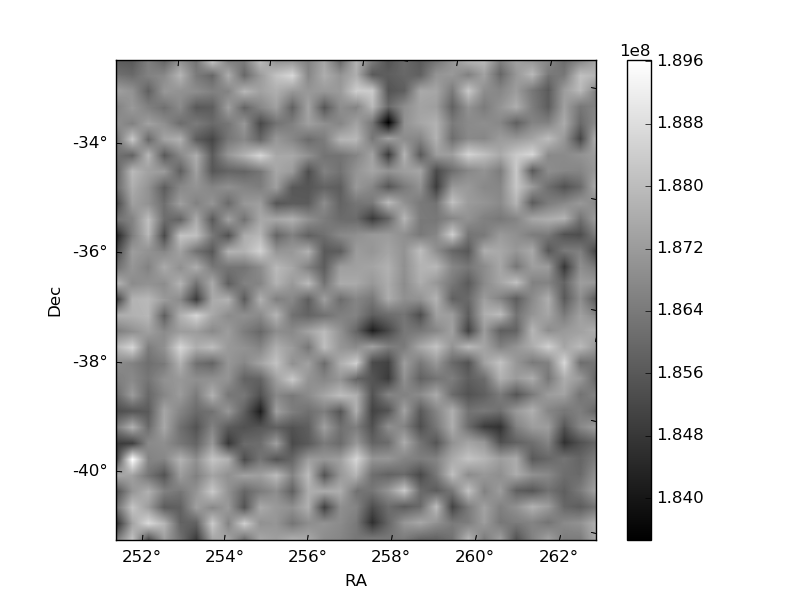
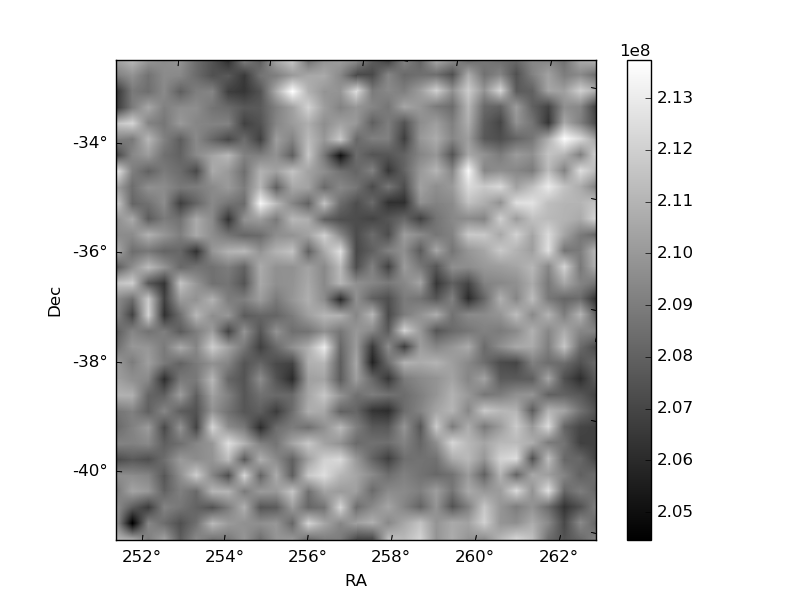
Histogram calculated using DETX and DETY for each event in the final _common_clean file
| Quadrant A | 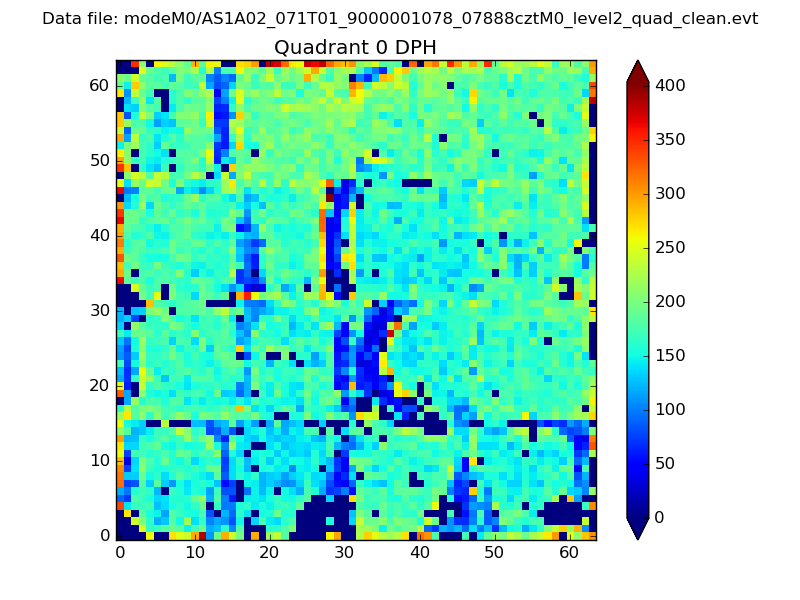 |
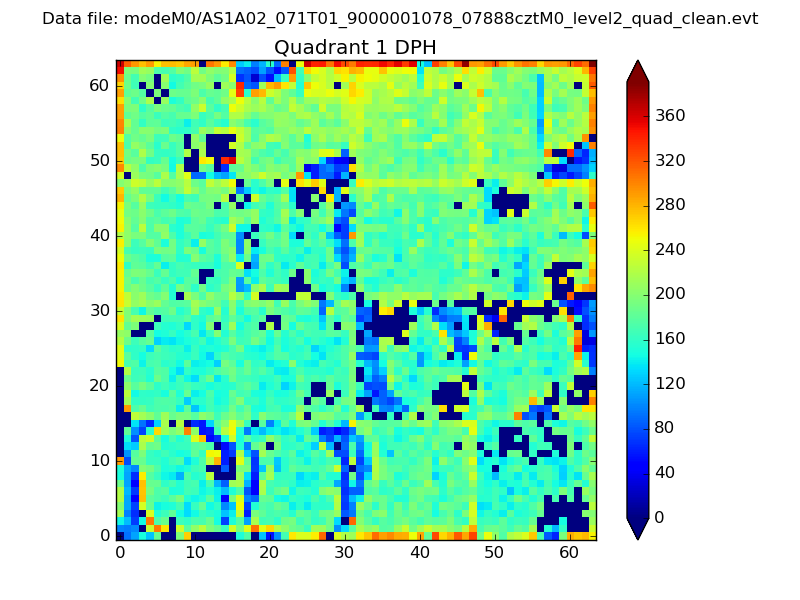 |
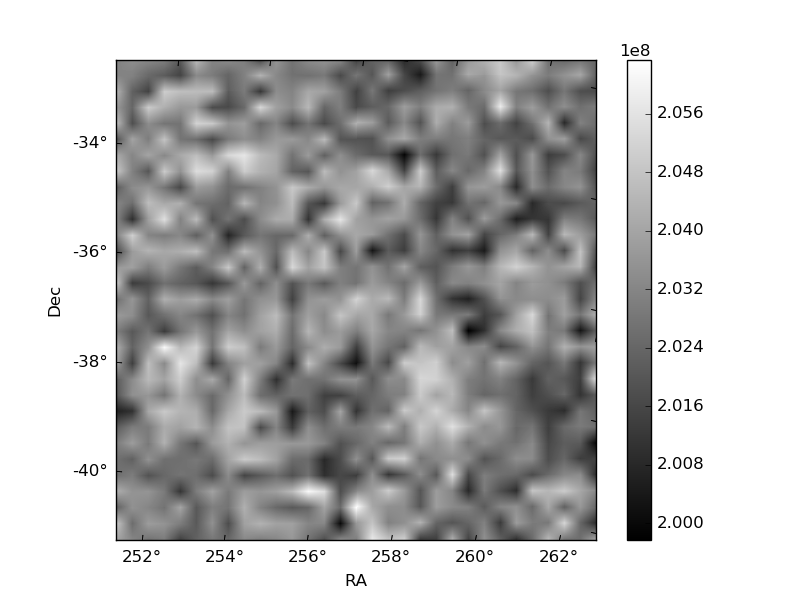
Quadrant B |
|---|---|---|---|
| Quadrant D | 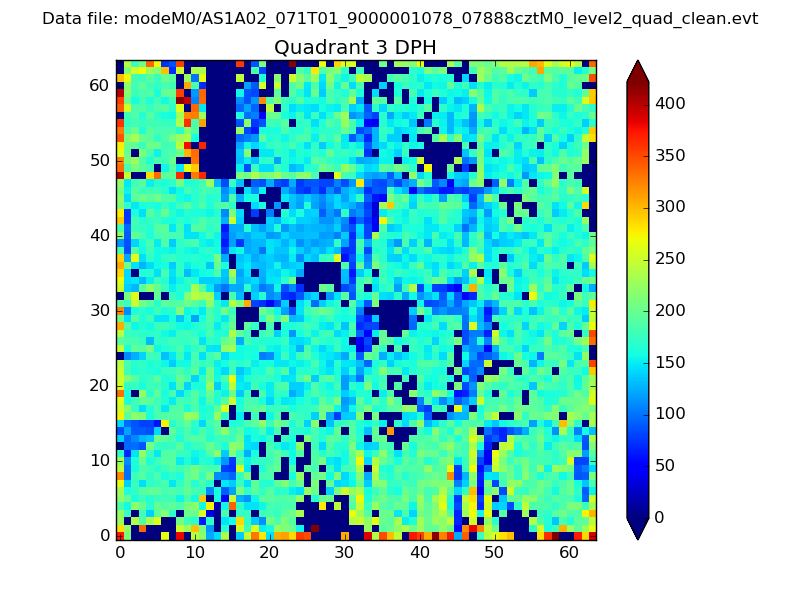 |
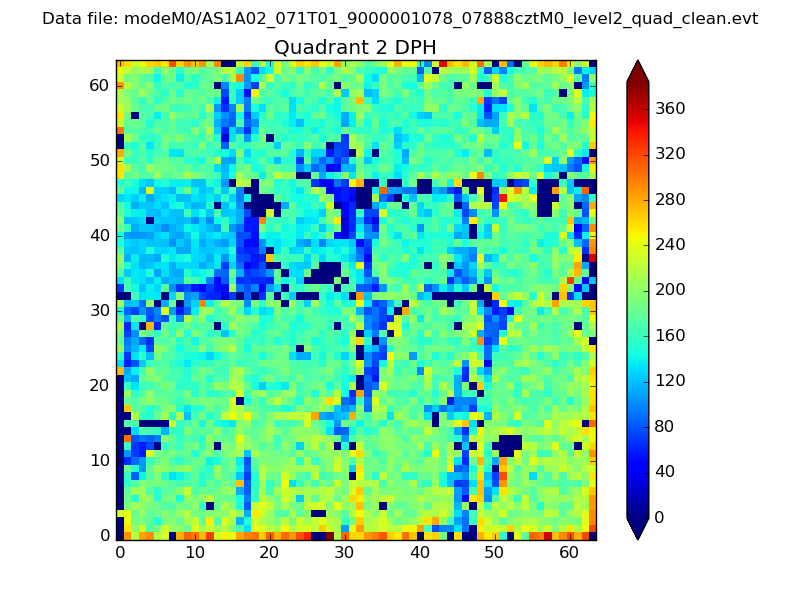 |
Quadrant C |
| Plot type | Count rate plots | Images |
|---|---|---|
| Comparison with Poisson distribution Blue bars denote a histogram of data divided into 1 sec bins. Red curve is a Poisson curve with rate = median count rate of data. |
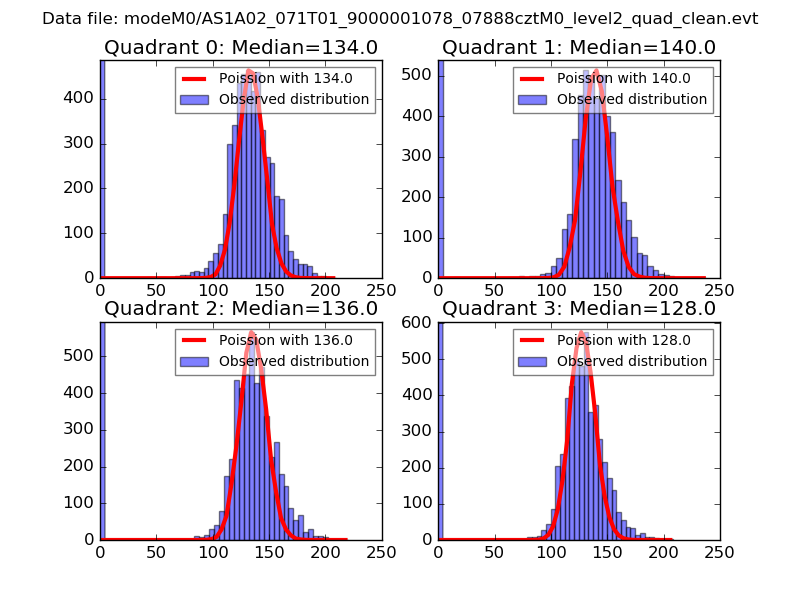 |
 |
| Quadrant-wise count rates Data is divided into 100 sec bins |
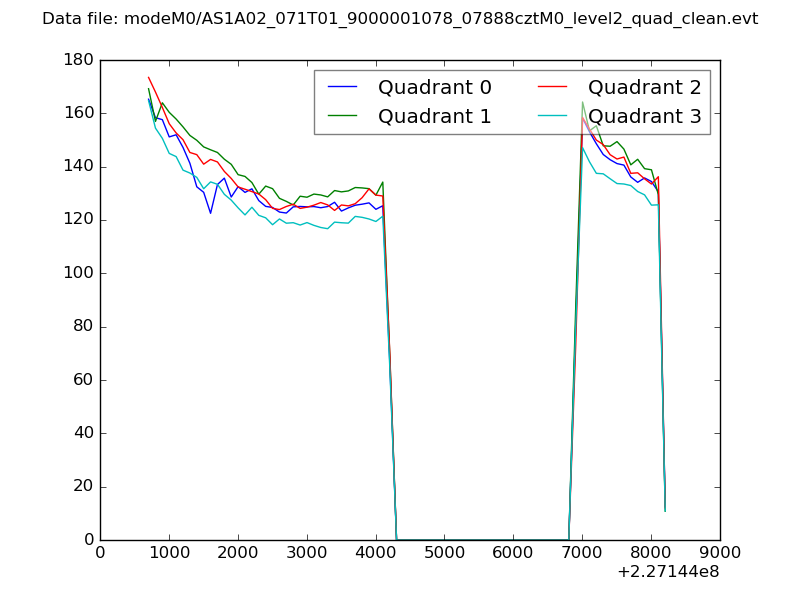 |
|
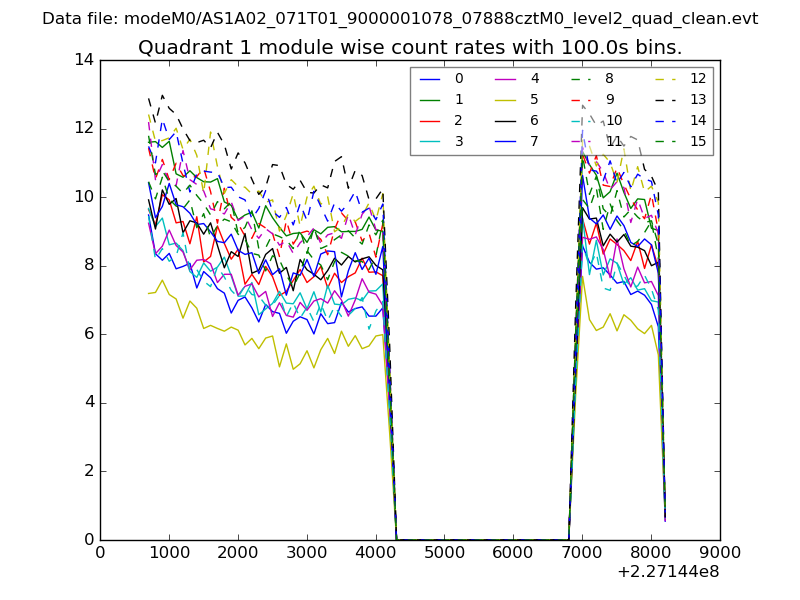
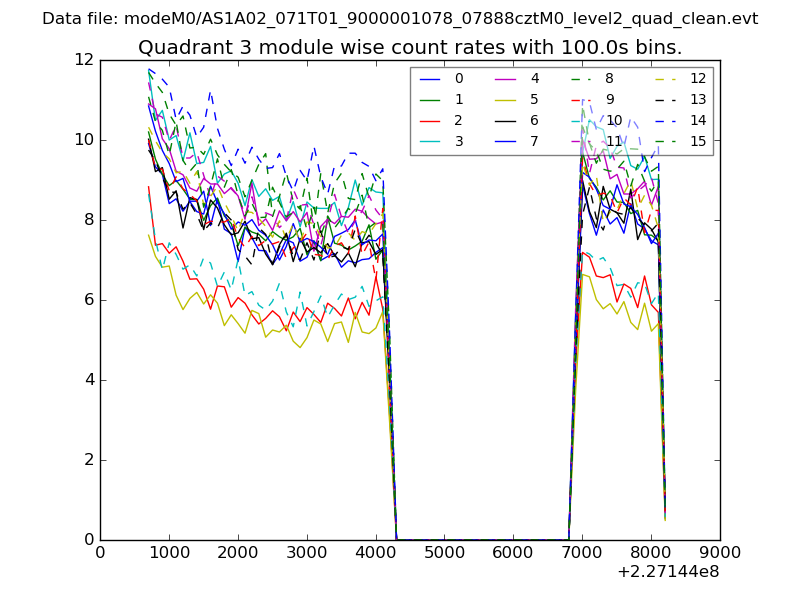
| Module-wise count rates for Quadrant A Data is divided into 100 sec bins |
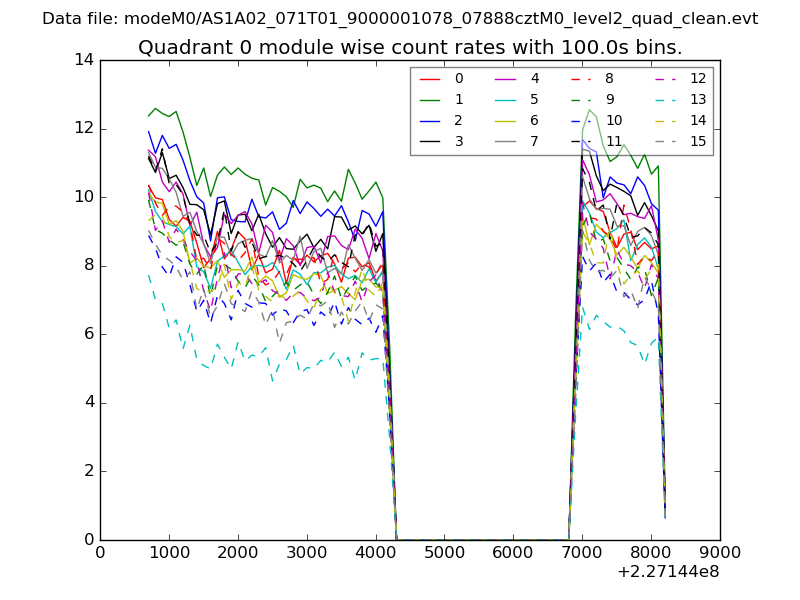 |
 |
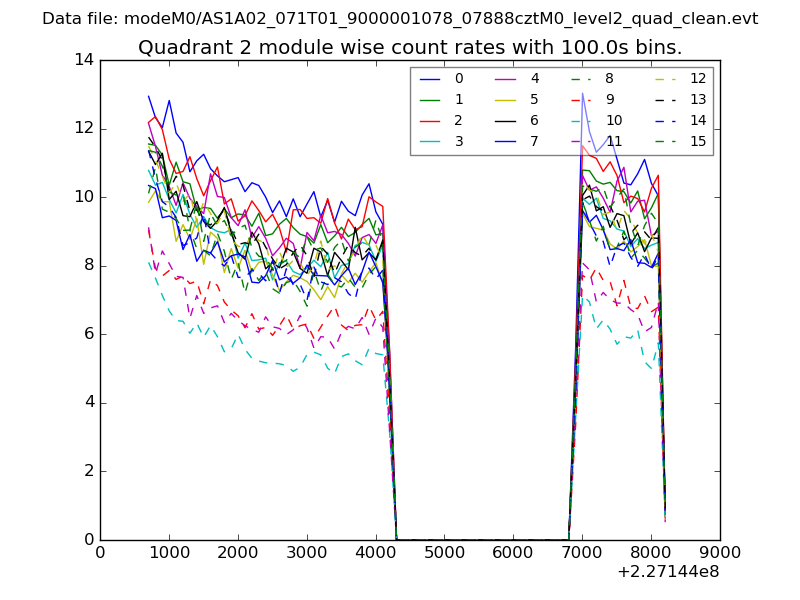
| Module-wise count rates for Quadrant B Data is divided into 100 sec bins |
 |
 |
| Module-wise count rates for Quadrant C Data is divided into 100 sec bins |
 |
 |
| Module-wise count rates for Quadrant D Data is divided into 100 sec bins |
 |
 |
| Parameter | Plot |
|---|---|
| CZT HV Monitor | 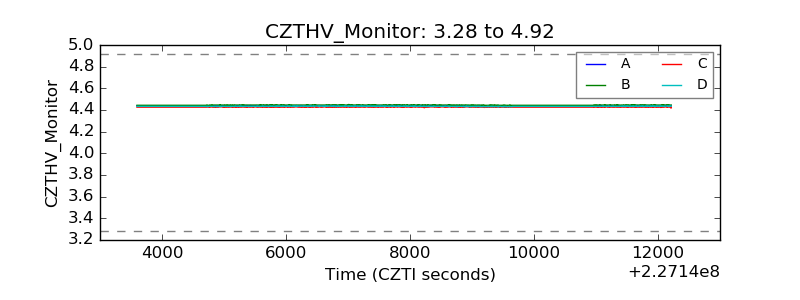 |
| D_VDD | 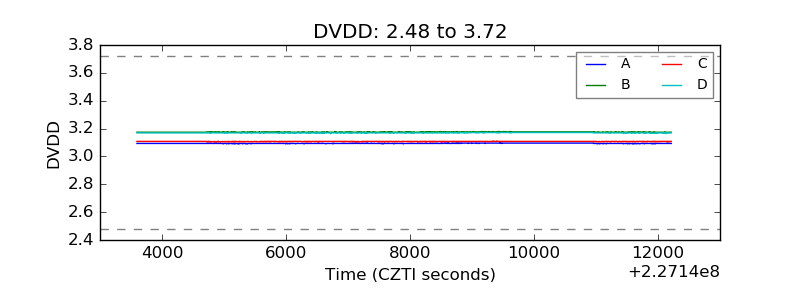 |
| Temperature 1 |  |
| Veto HV Monitor | 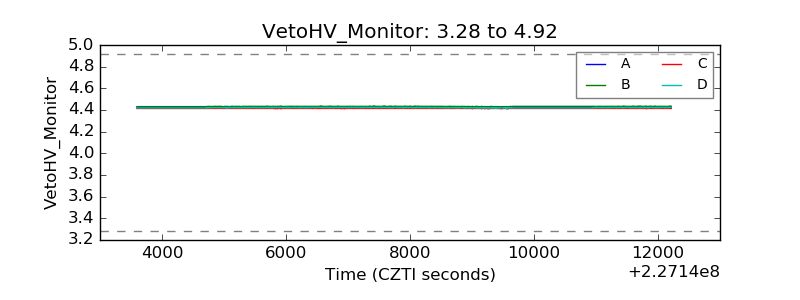 |
| Veto LLD | 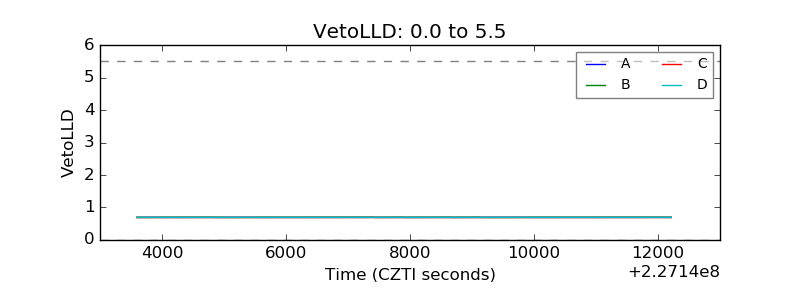 |
| Alpha Counter | 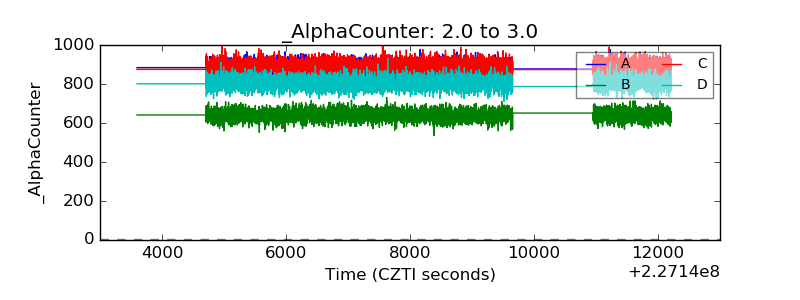 |
| _CPM_Rate | 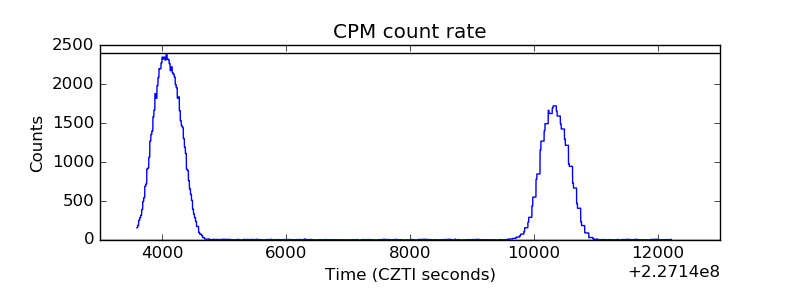 |
| CZT Counter | 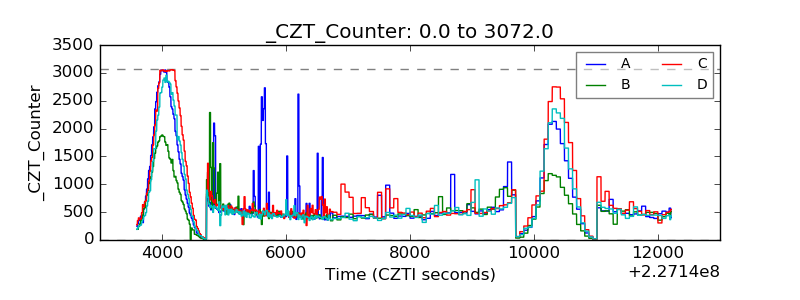 |
| +2.5 Volts monitor |  |
| +5 Volts monitor | 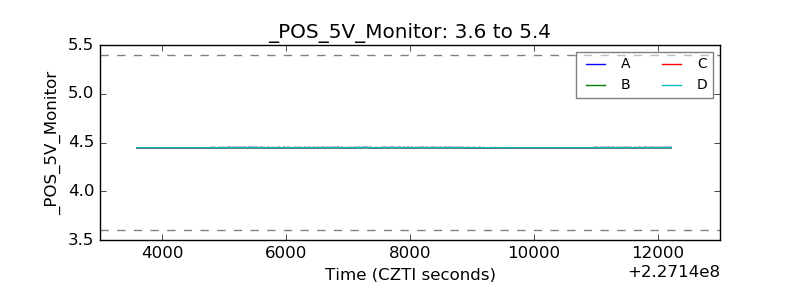 |
| _ROLL_ROT | 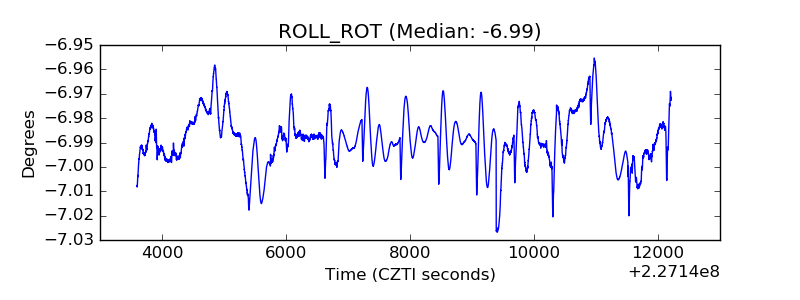 |
| _Roll_DEC | 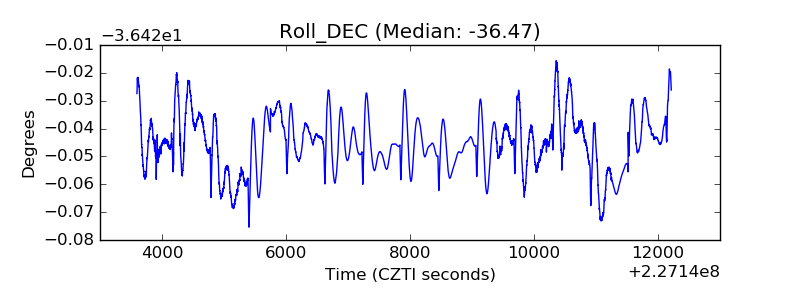 |
| _Roll_RA | 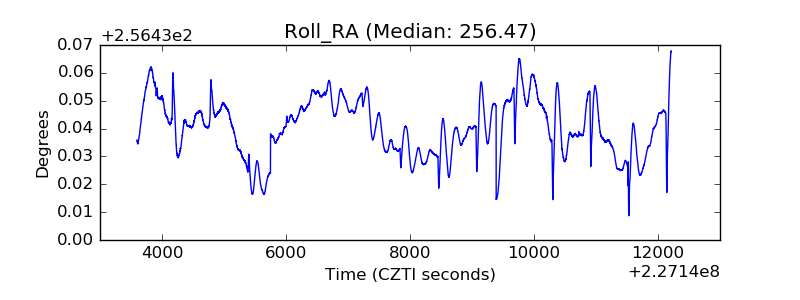 |
| Veto Counter | 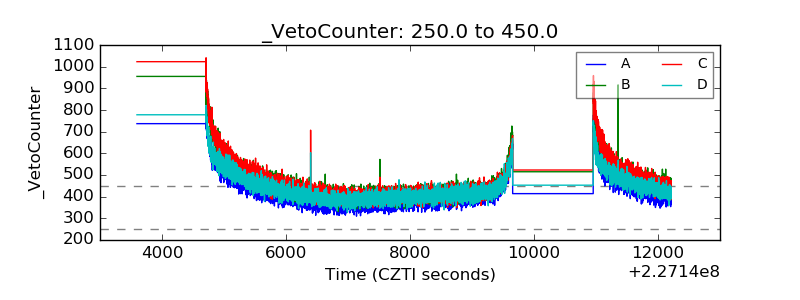 |