| Param | Original file | Final file |
|---|---|---|
| Filename | modeM0/AS1A02_071T01_9000001078_07889cztM0_level2.evt | modeM0/AS1A02_071T01_9000001078_07889cztM0_level2_quad_clean.evt |
| Size (bytes) | 552,893,760 | 98,936,640 |
| Size | 527.3 MB | 94.4 MB |
| Events in quadrant A | 3,449,322 | 635,842 |
| Events in quadrant B | 3,318,092 | 660,351 |
| Events in quadrant C | 5,575,549 | 629,271 |
| Events in quadrant D | 3,946,931 | 603,194 |
| Mode SS | |||
|---|---|---|---|
| Quadrant | BADHDUFLAG | Total packets | Discarded packets |
| A | 0 | 138 | 0 |
| B | 0 | 138 | 0 |
| C | 0 | 138 | 0 |
| D | 0 | 138 | 0 |
| Mode M0 | |||
|---|---|---|---|
| Quadrant | BADHDUFLAG | Total packets | Discarded packets |
| A | 0 | 14738 | 3 |
| B | 0 | 14259 | 2 |
| C | 0 | 21153 | 2 |
| D | 0 | 16284 | 2 |
| Mode M9 | |||
|---|---|---|---|
| Quadrant | BADHDUFLAG | Total packets | Discarded packets |
| A | 0 | 16 | 0 |
| B | 0 | 16 | 0 |
| C | 0 | 16 | 0 |
| D | 0 | 17 | 0 |
| Quadrant | Total seconds | Saturated seconds | Saturation percentage |
|---|---|---|---|
| A | 6701 | 33 | 0.492464% |
| B | 6701 | 58 | 0.865542% |
| C | 6701 | 322 | 4.805253% |
| D | 6701 | 141 | 2.104164% |
Noise dominated data is calculated using 1-second bins in cleaned event files. If a bin has >2000 counts, and if more than 50% of those come from <1% of pixels, then it is considered to be noise-dominated and hence unusable.
| Quadrant | # 1 sec bins | Bins with >0 counts | Bins with >2000 counts | High rate bins dominated by noise | Noise dominated (total time) | Noise dominated (detector-on time) | Marked lightcurve |
|---|---|---|---|---|---|---|---|
| A | 7946 | 6702 | 6 | 6 | 0.08% | 0.09% | 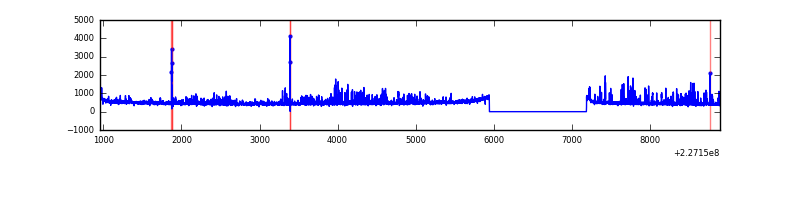 |
| B | 7946 | 6702 | 14 | 14 | 0.18% | 0.21% |  |
| C | 7946 | 6702 | 213 | 213 | 2.68% | 3.18% | 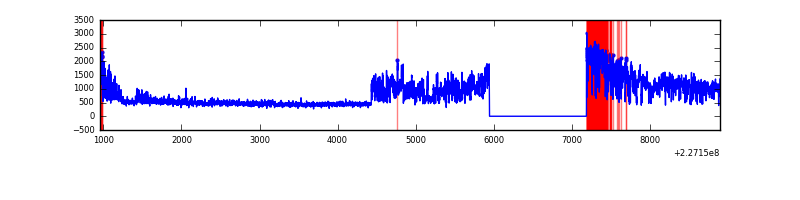 |
| D | 7946 | 6702 | 129 | 129 | 1.62% | 1.92% | 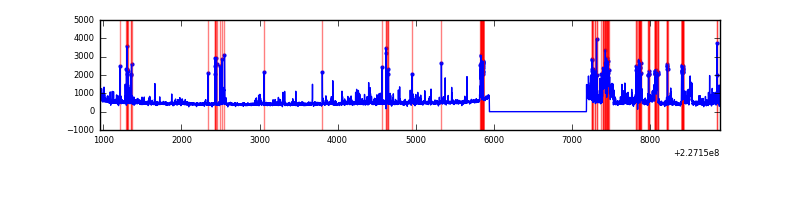 |
Top three noisy pixels from each quadrant. If the there are fewer than three noisy pixels in the level2.evt file, extra rows are filled as -1
| Pixel properties | Quadrant properties | ||||||
|---|---|---|---|---|---|---|---|
| Quadrant | DetID | PixID | Counts | Sigma | Mean | Median | Sigma |
| A | 15 | 239 | 357583 | 2206.22 | 801 | 784 | 161.7 |
| A | 0 | 226 | 7451 | 41.22 | 801 | 784 | 161.7 |
| A | 12 | 194 | 7012 | 38.51 | 801 | 784 | 161.7 |
| B | 4 | 80 | 47552 | 304.21 | 817 | 800 | 153.7 |
| B | 4 | 239 | 36731 | 233.8 | 817 | 800 | 153.7 |
| B | 4 | 81 | 25196 | 158.74 | 817 | 800 | 153.7 |
| C | 1 | 16 | 2495723 | 13713.63 | 789 | 794 | 181.9 |
| C | 13 | 61 | 6096 | 29.14 | 789 | 794 | 181.9 |
| C | 12 | 4 | 2833 | 11.21 | 789 | 794 | 181.9 |
| D | 1 | 52 | 413273 | 2161.26 | 784 | 762 | 190.9 |
| D | 4 | 95 | 216878 | 1132.29 | 784 | 762 | 190.9 |
| D | 14 | 34 | 105083 | 546.57 | 784 | 762 | 190.9 |
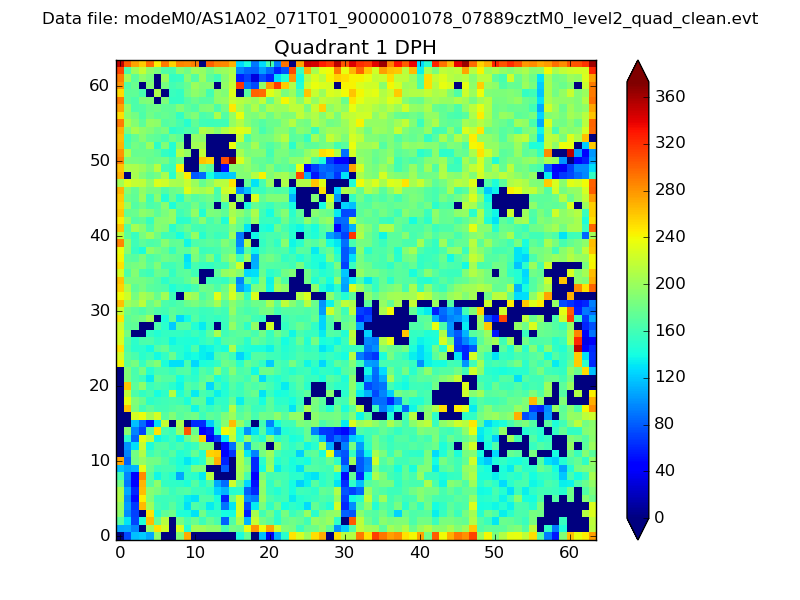
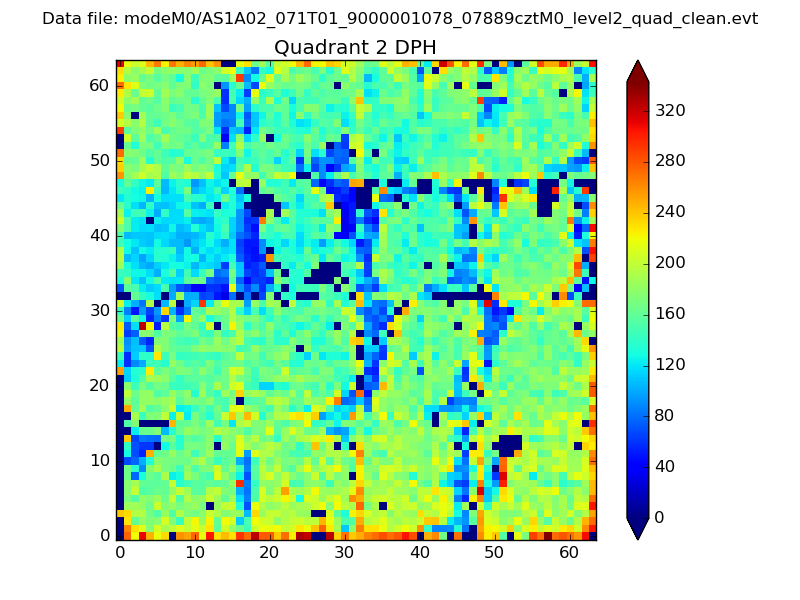
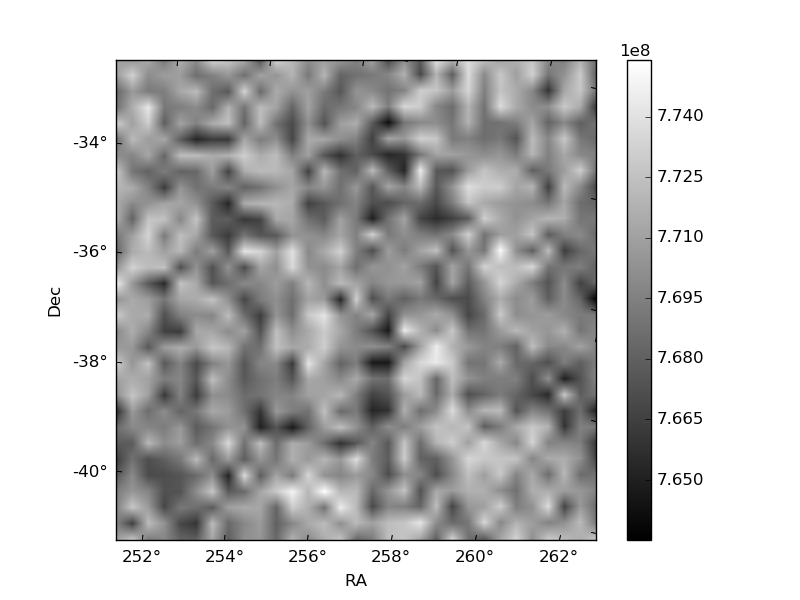
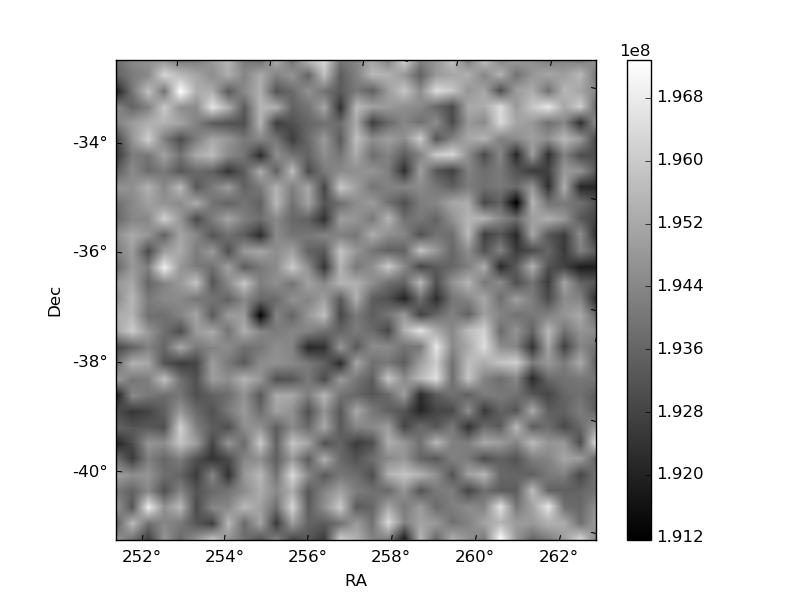
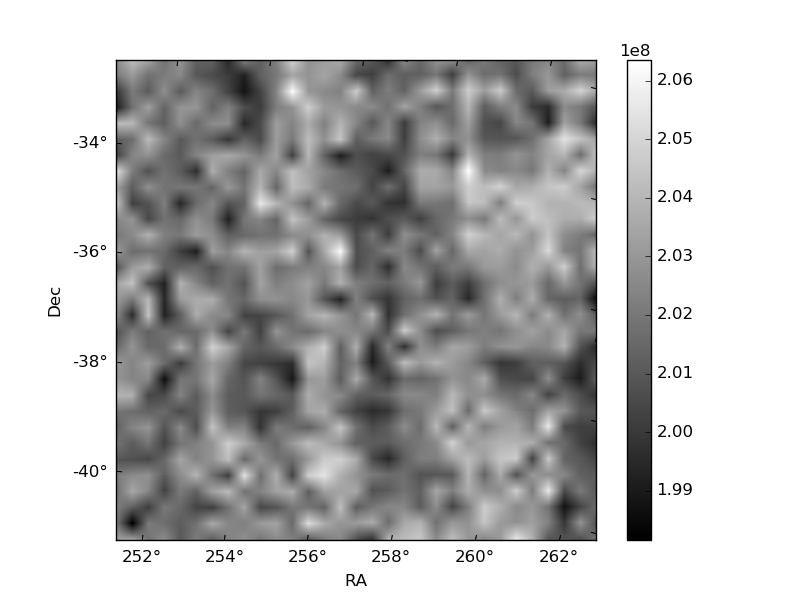
Histogram calculated using DETX and DETY for each event in the final _common_clean file
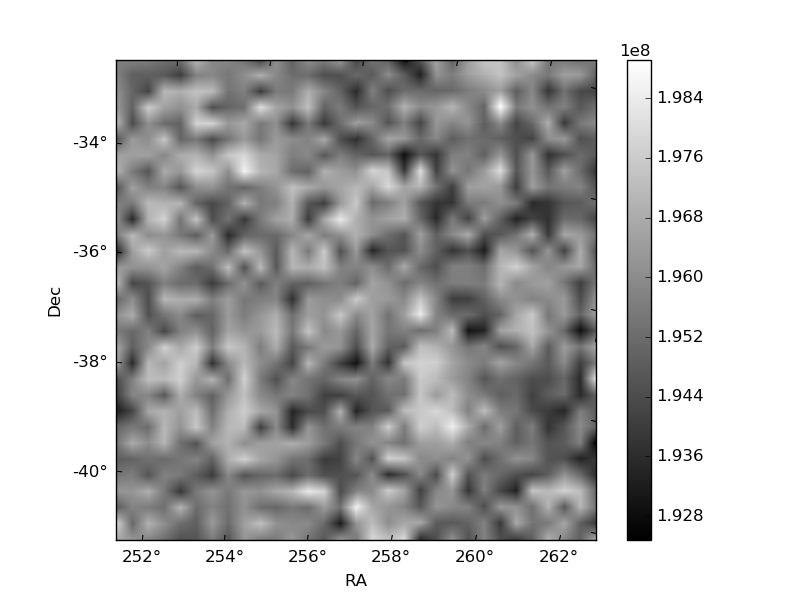
| Quadrant A | 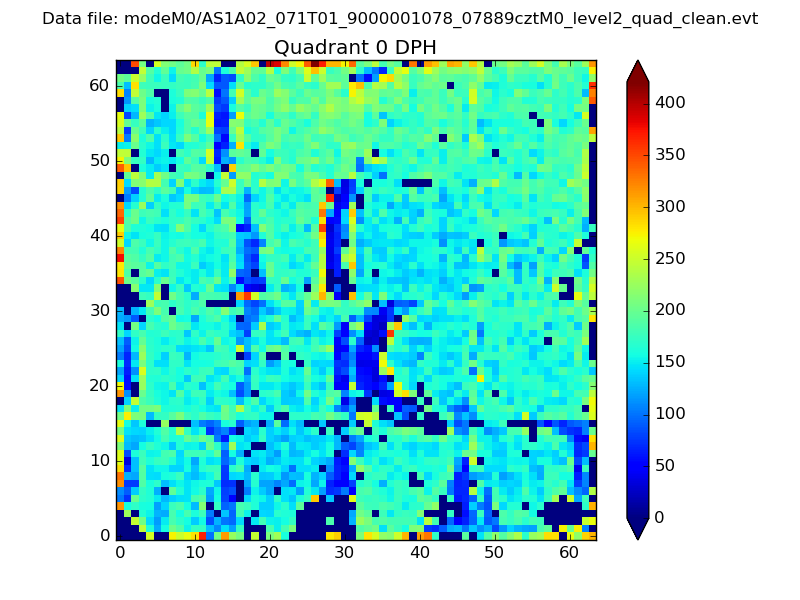 |
 |
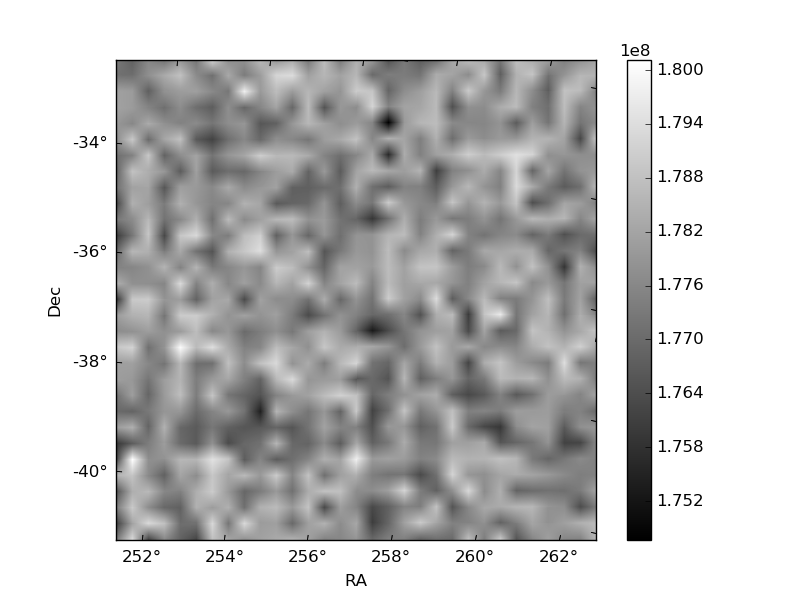
Quadrant B |
|---|---|---|---|
| Quadrant D | 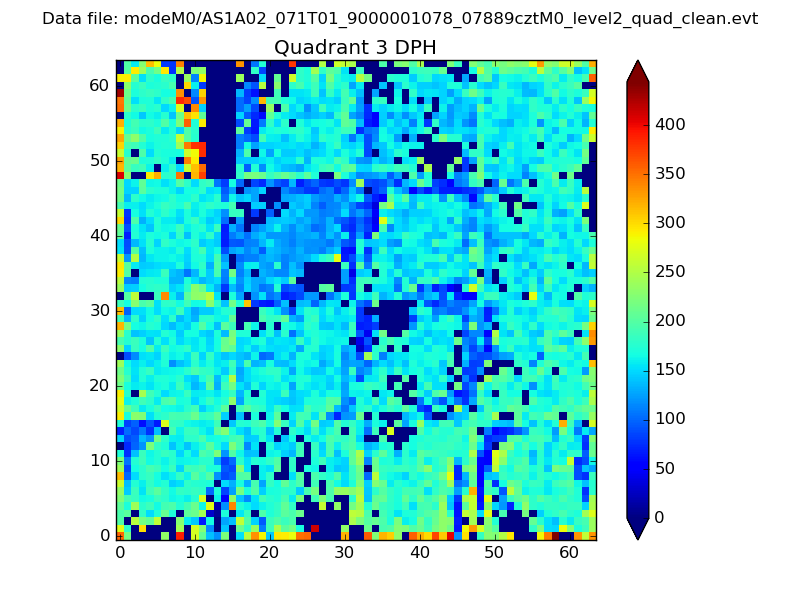 |
 |
Quadrant C |
| Plot type | Count rate plots | Images |
|---|---|---|
| Comparison with Poisson distribution Blue bars denote a histogram of data divided into 1 sec bins. Red curve is a Poisson curve with rate = median count rate of data. |
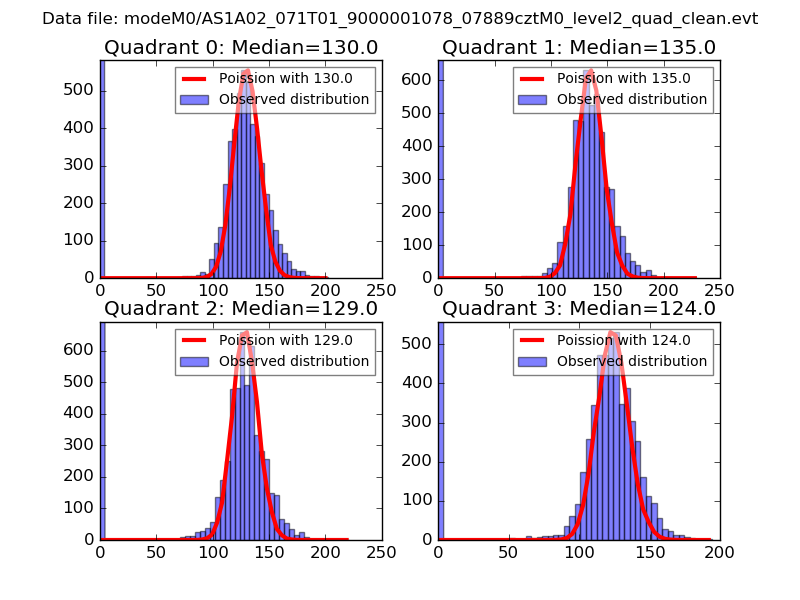 |
 |
| Quadrant-wise count rates Data is divided into 100 sec bins |
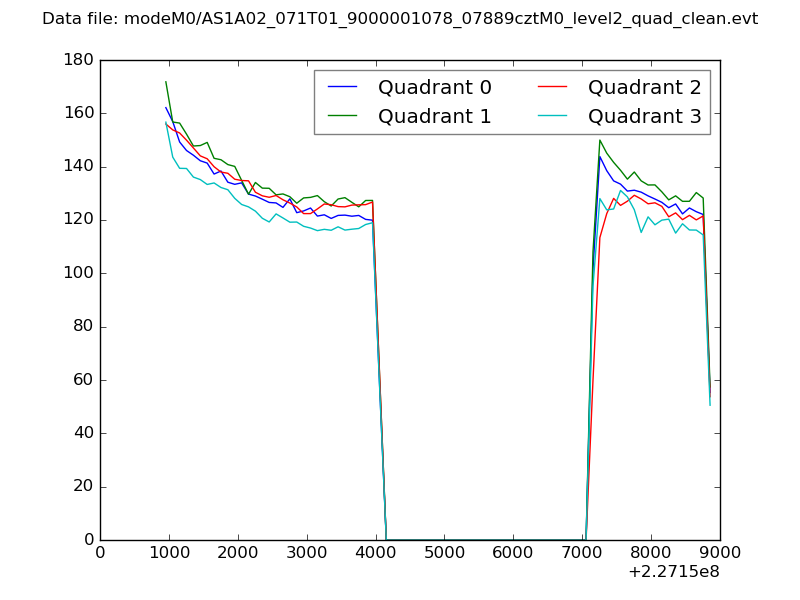 |
|
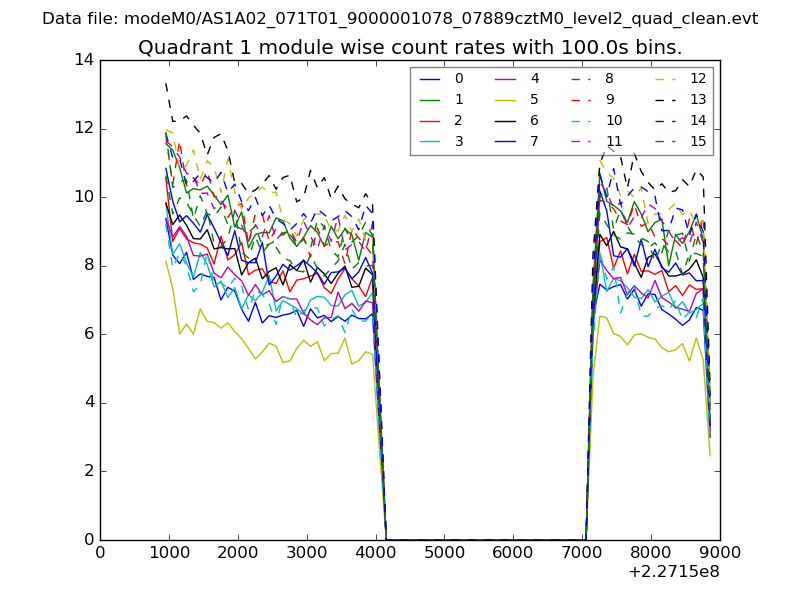
| Module-wise count rates for Quadrant A Data is divided into 100 sec bins |
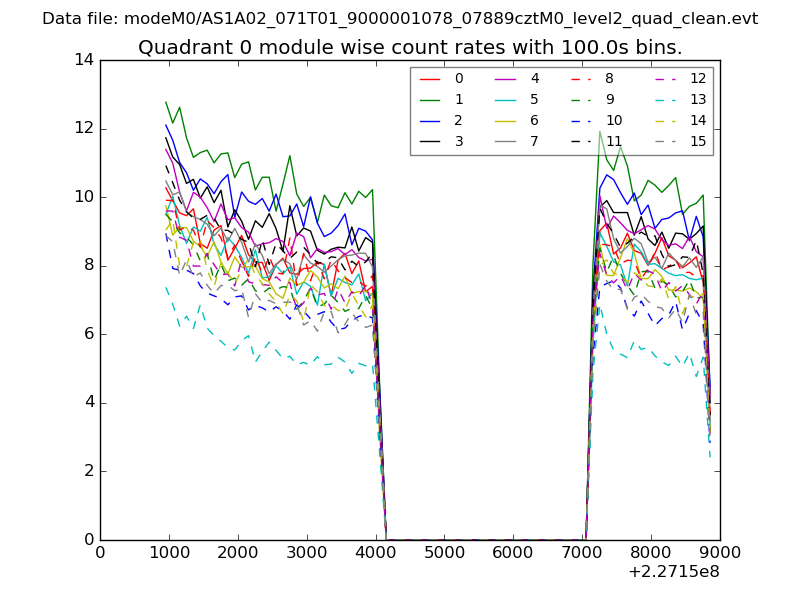 |
 |
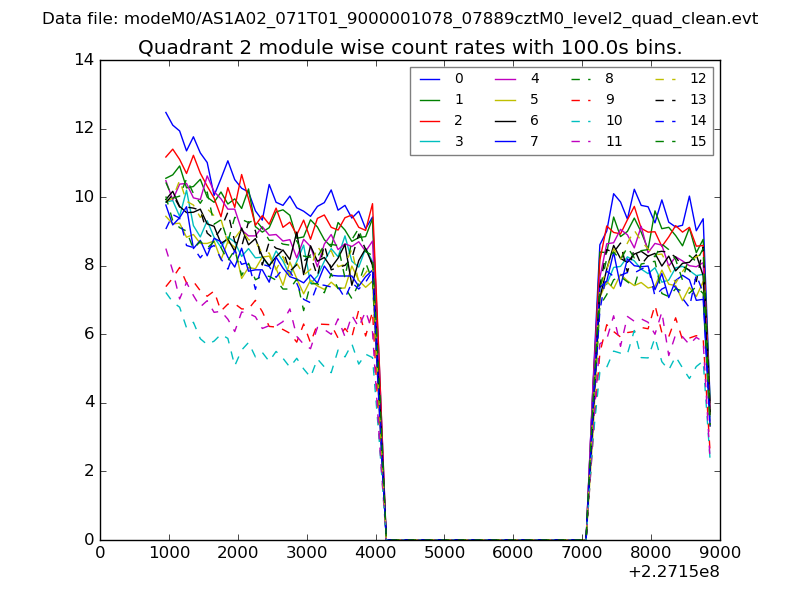
| Module-wise count rates for Quadrant B Data is divided into 100 sec bins |
 |
 |
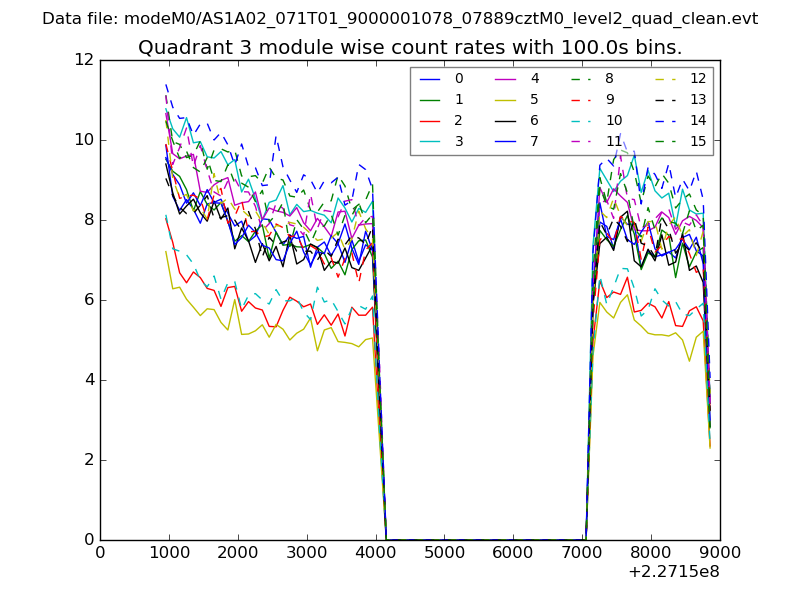
| Module-wise count rates for Quadrant C Data is divided into 100 sec bins |
 |
 |
| Module-wise count rates for Quadrant D Data is divided into 100 sec bins |
 |
 |
| Parameter | Plot |
|---|---|
| CZT HV Monitor | 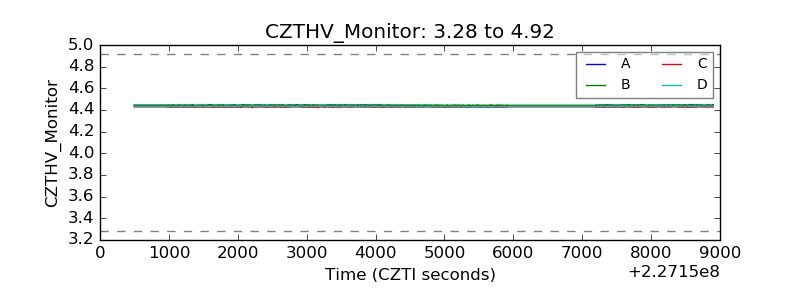 |
| D_VDD | 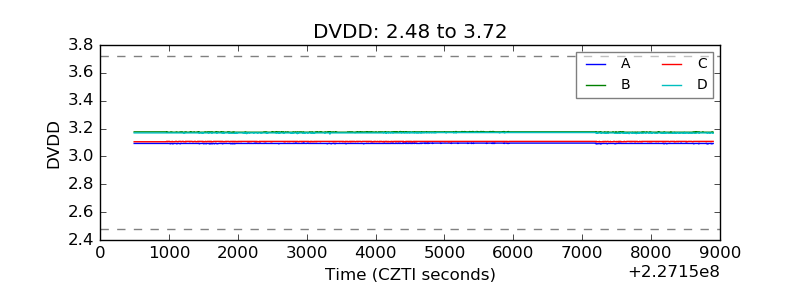 |
| Temperature 1 |  |
| Veto HV Monitor | 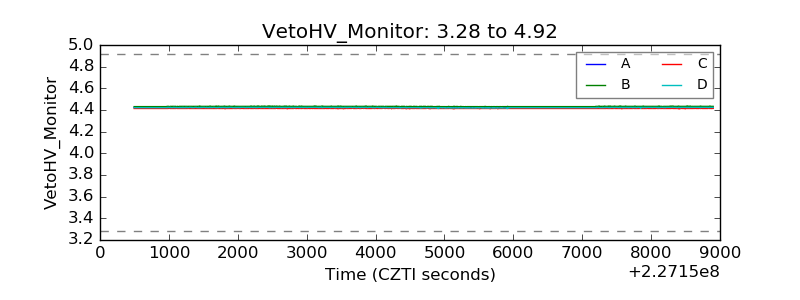 |
| Veto LLD | 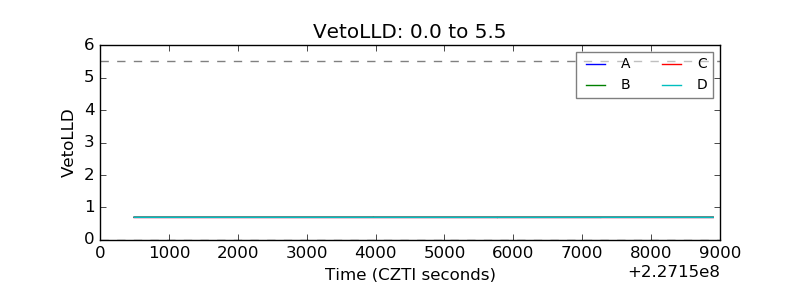 |
| Alpha Counter | 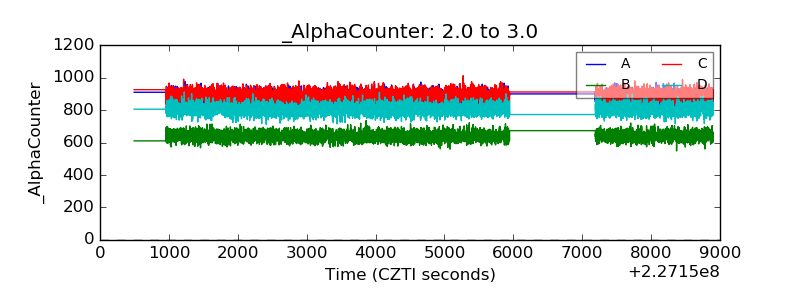 |
| _CPM_Rate | 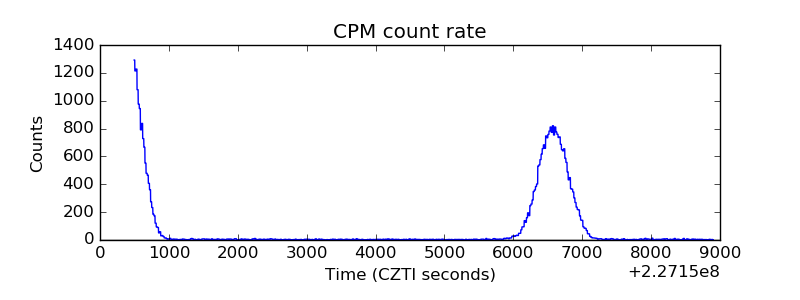 |
| CZT Counter | 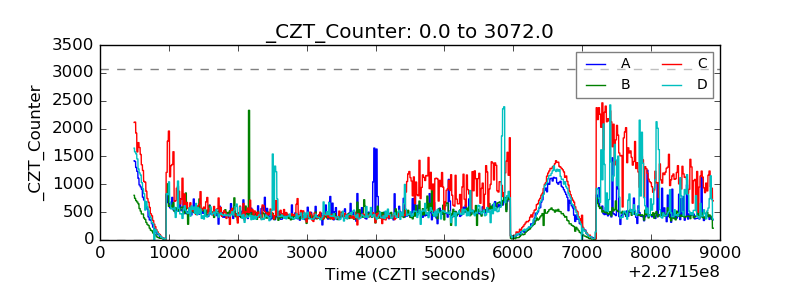 |
| +2.5 Volts monitor |  |
| +5 Volts monitor |  |
| _ROLL_ROT | 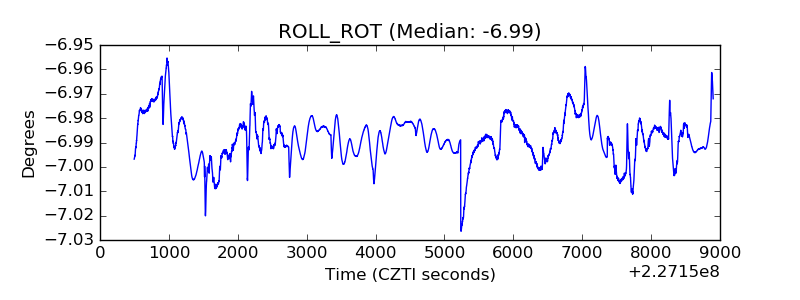 |
| _Roll_DEC | 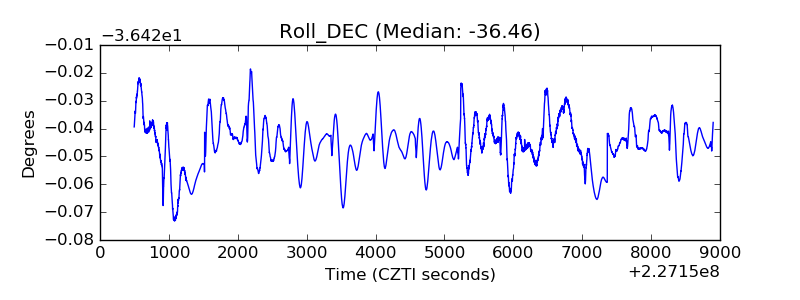 |
| _Roll_RA | 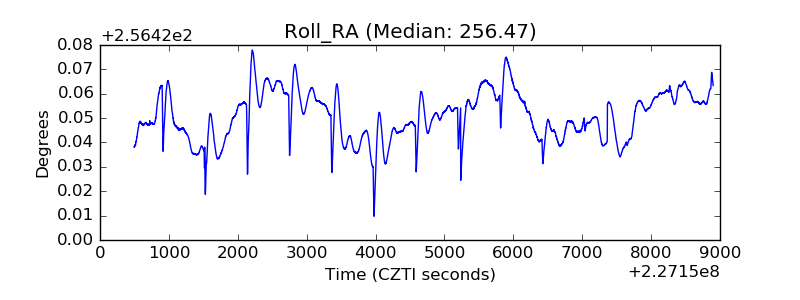 |
| Veto Counter | 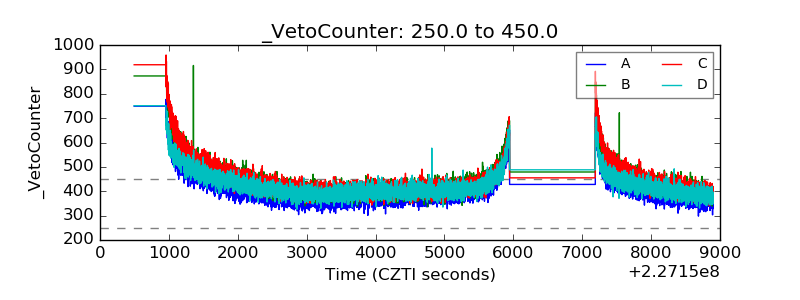 |