| Param | Original file | Final file |
|---|---|---|
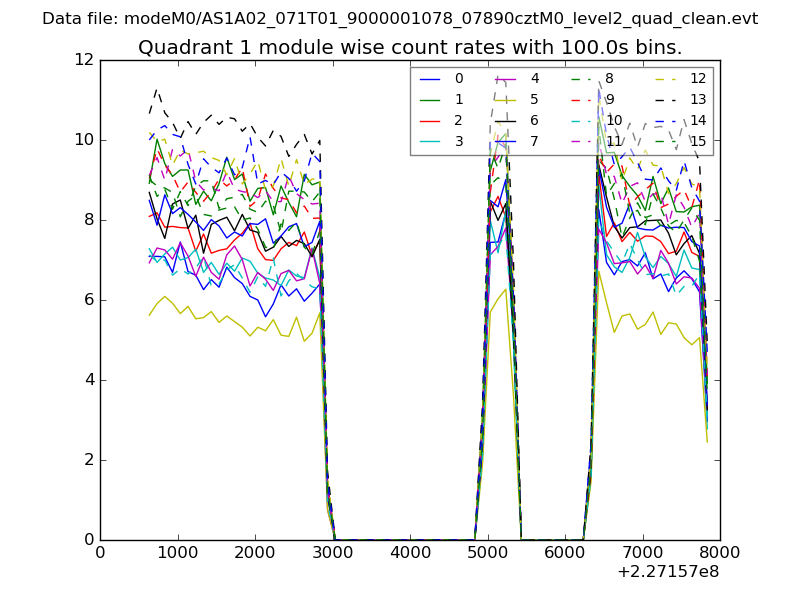
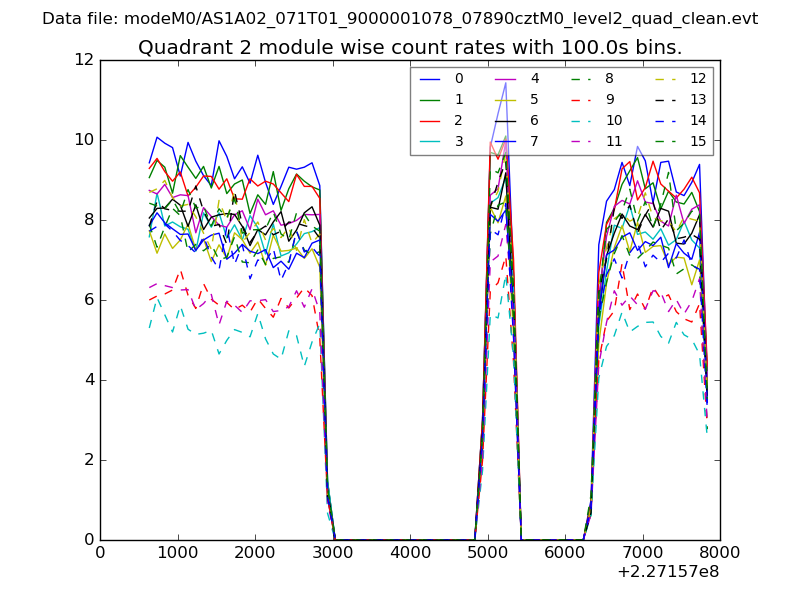
| Filename | modeM0/AS1A02_071T01_9000001078_07890cztM0_level2.evt | modeM0/AS1A02_071T01_9000001078_07890cztM0_level2_quad_clean.evt |
| Size (bytes) | 552,507,840 | 82,356,480 |
| Size | 526.9 MB | 78.5 MB |
| Events in quadrant A | 3,731,804 | 513,219 |
| Events in quadrant B | 2,958,160 | 539,647 |
| Events in quadrant C | 6,335,657 | 507,608 |
| Events in quadrant D | 3,285,545 | 498,531 |
| Mode SS | |||
|---|---|---|---|
| Quadrant | BADHDUFLAG | Total packets | Discarded packets |
| A | 0 | 126 | 0 |
| B | 0 | 126 | 0 |
| C | 0 | 126 | 0 |
| D | 0 | 126 | 0 |
| Mode M0 | |||
|---|---|---|---|
| Quadrant | BADHDUFLAG | Total packets | Discarded packets |
| A | 0 | 15413 | 3 |
| B | 0 | 12943 | 2 |
| C | 0 | 23251 | 2 |
| D | 0 | 14159 | 2 |
| Mode M9 | |||
|---|---|---|---|
| Quadrant | BADHDUFLAG | Total packets | Discarded packets |
| A | 0 | 10 | 0 |
| B | 0 | 10 | 0 |
| C | 0 | 10 | 0 |
| D | 0 | 10 | 0 |
| Quadrant | Total seconds | Saturated seconds | Saturation percentage |
|---|---|---|---|
| A | 6230 | 203 | 3.258427% |
| B | 6230 | 42 | 0.674157% |
| C | 6230 | 260 | 4.173355% |
| D | 6230 | 85 | 1.364366% |
Noise dominated data is calculated using 1-second bins in cleaned event files. If a bin has >2000 counts, and if more than 50% of those come from <1% of pixels, then it is considered to be noise-dominated and hence unusable.
| Quadrant | # 1 sec bins | Bins with >0 counts | Bins with >2000 counts | High rate bins dominated by noise | Noise dominated (total time) | Noise dominated (detector-on time) | Marked lightcurve |
|---|---|---|---|---|---|---|---|
| A | 7250 | 6232 | 126 | 126 | 1.74% | 2.02% | 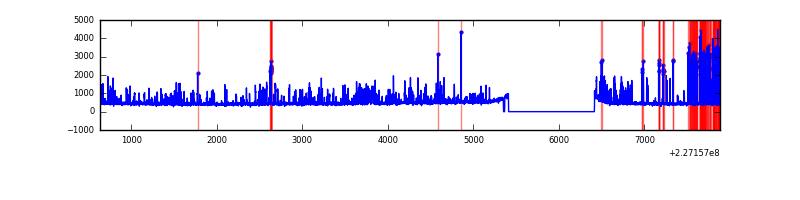 |
| B | 7250 | 6232 | 1 | 1 | 0.01% | 0.02% | 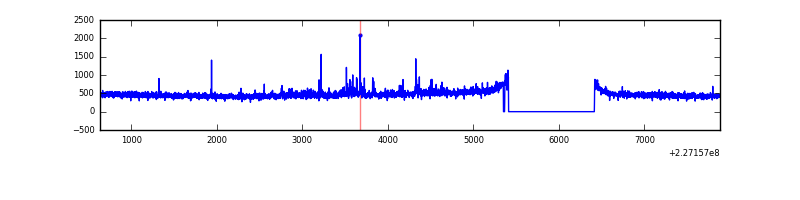 |
| C | 7250 | 6232 | 159 | 159 | 2.19% | 2.55% | 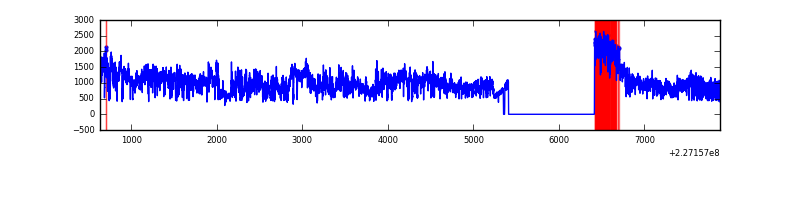 |
| D | 7250 | 6232 | 70 | 70 | 0.97% | 1.12% | 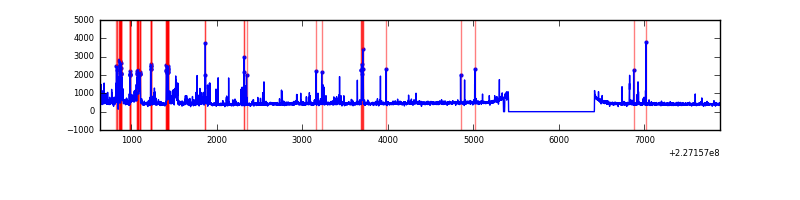 |
Top three noisy pixels from each quadrant. If the there are fewer than three noisy pixels in the level2.evt file, extra rows are filled as -1
| Pixel properties | Quadrant properties | ||||||
|---|---|---|---|---|---|---|---|
| Quadrant | DetID | PixID | Counts | Sigma | Mean | Median | Sigma |
| A | 15 | 239 | 925106 | 6243.99 | 724 | 708 | 148.0 |
| A | 0 | 226 | 6725 | 40.64 | 724 | 708 | 148.0 |
| A | 12 | 194 | 6410 | 38.51 | 724 | 708 | 148.0 |
| B | 5 | 255 | 31440 | 217.72 | 739 | 719 | 141.1 |
| B | 0 | 230 | 20491 | 140.12 | 739 | 719 | 141.1 |
| B | 4 | 239 | 18224 | 124.06 | 739 | 719 | 141.1 |
| C | 1 | 16 | 3547994 | 21430.94 | 714 | 718 | 165.5 |
| C | 13 | 61 | 5381 | 28.17 | 714 | 718 | 165.5 |
| C | 12 | 4 | 2801 | 12.58 | 714 | 718 | 165.5 |
| D | 1 | 52 | 197224 | 1114.65 | 717 | 697 | 176.3 |
| D | 4 | 95 | 137399 | 775.34 | 717 | 697 | 176.3 |
| D | 14 | 34 | 107480 | 605.64 | 717 | 697 | 176.3 |
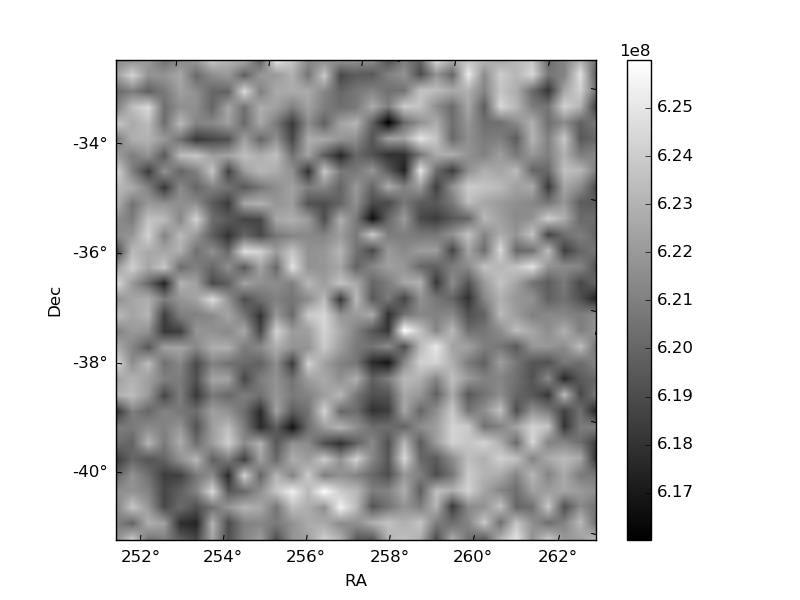
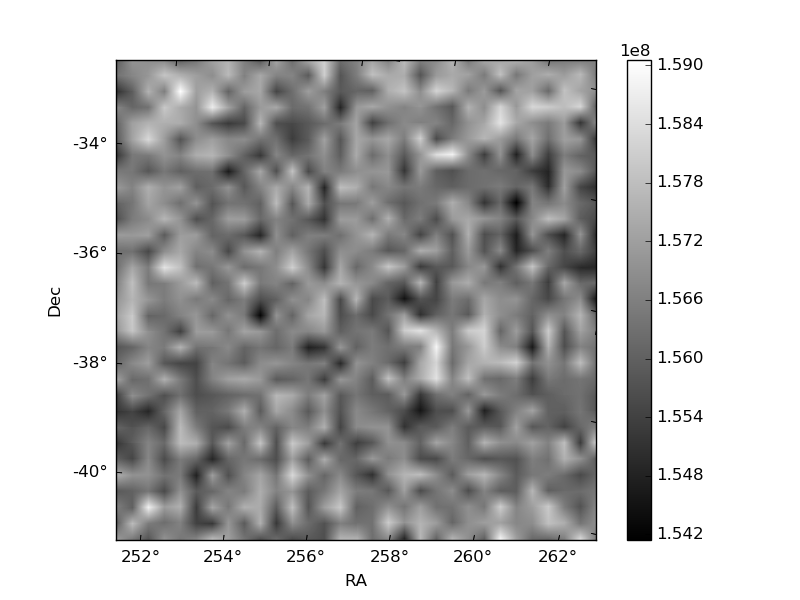
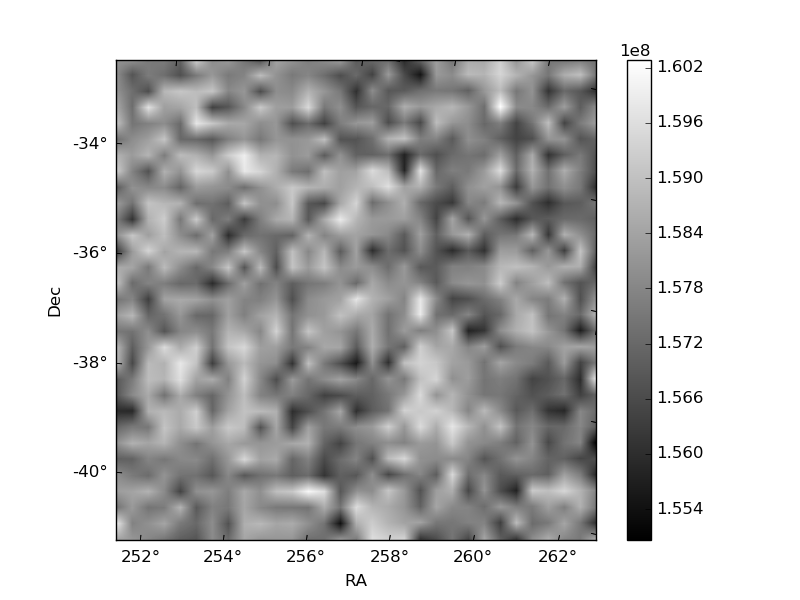
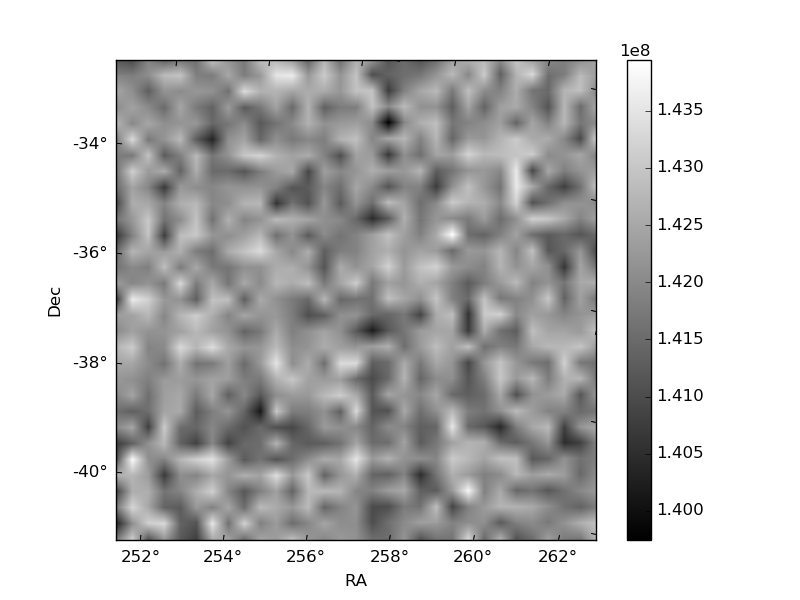
Histogram calculated using DETX and DETY for each event in the final _common_clean file
| Quadrant A | 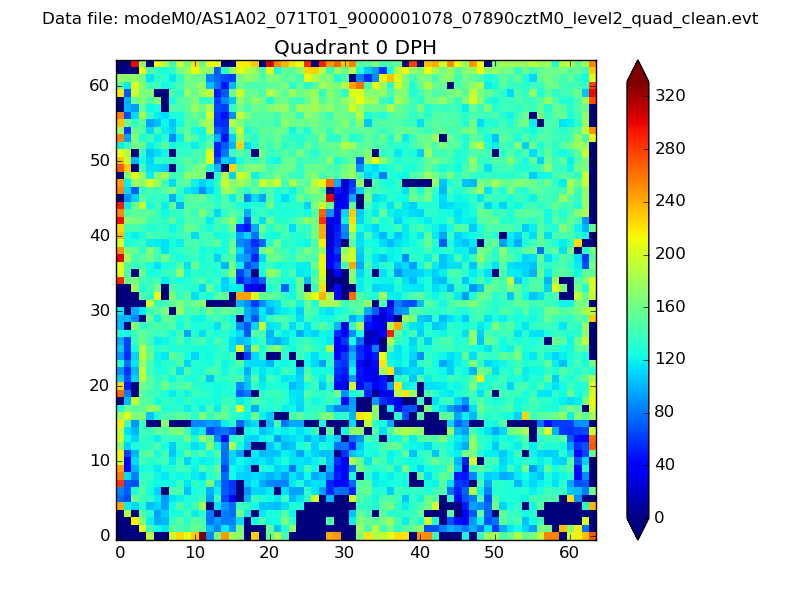 |
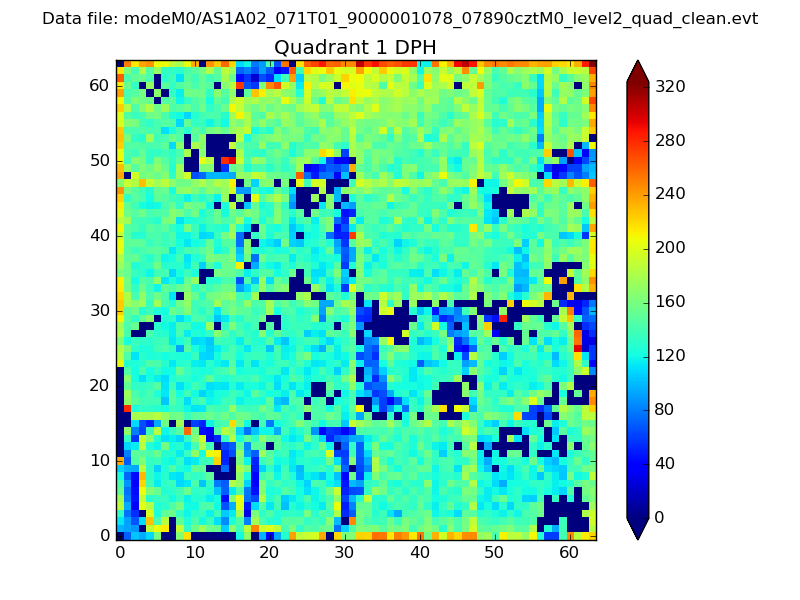 |
Quadrant B |
|---|---|---|---|
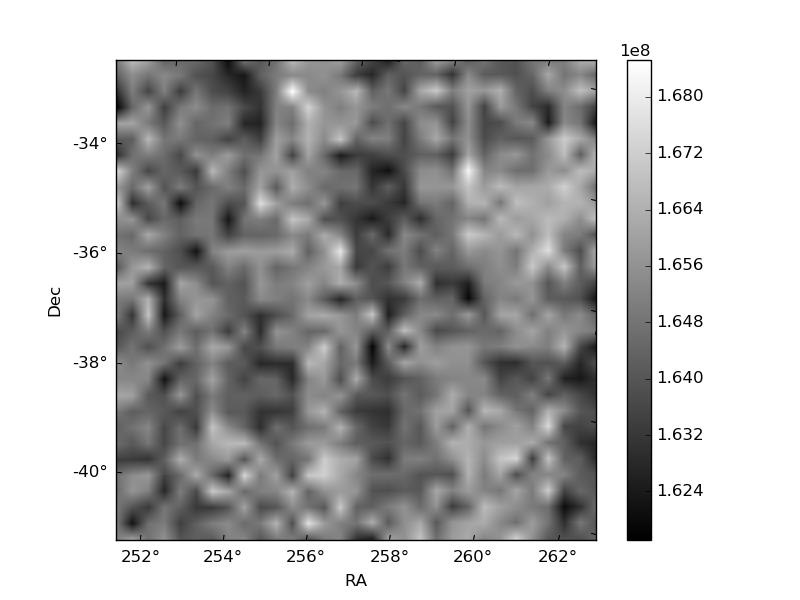
| Quadrant D | 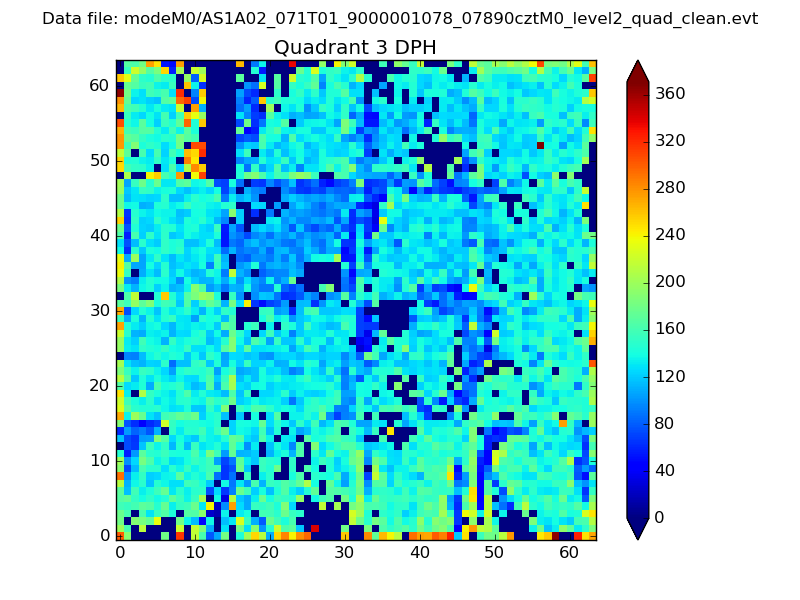 |
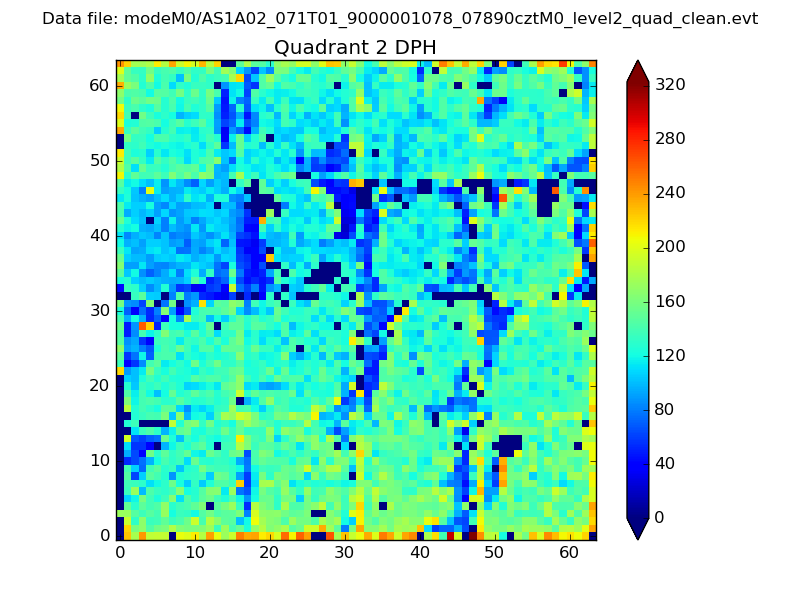 |
Quadrant C |
| Plot type | Count rate plots | Images |
|---|---|---|
| Comparison with Poisson distribution Blue bars denote a histogram of data divided into 1 sec bins. Red curve is a Poisson curve with rate = median count rate of data. |
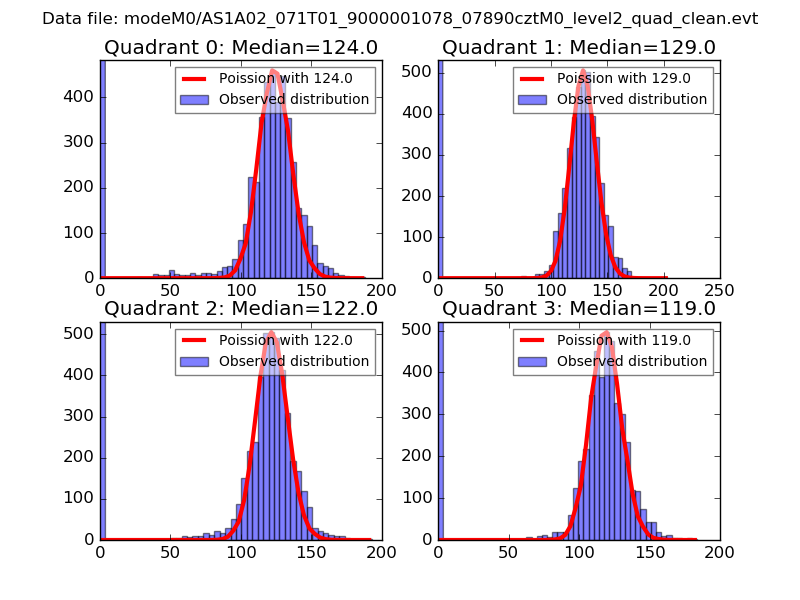 |
 |
| Quadrant-wise count rates Data is divided into 100 sec bins |
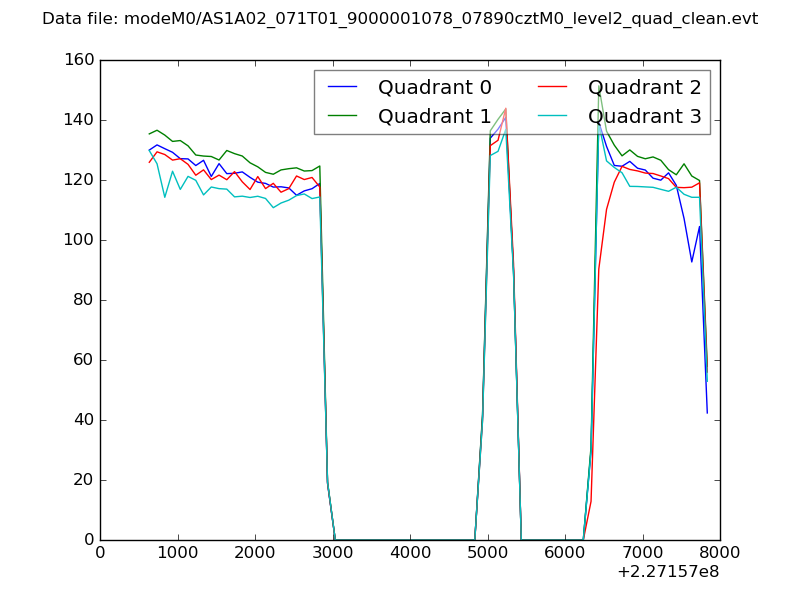 |
|
| Module-wise count rates for Quadrant A Data is divided into 100 sec bins |
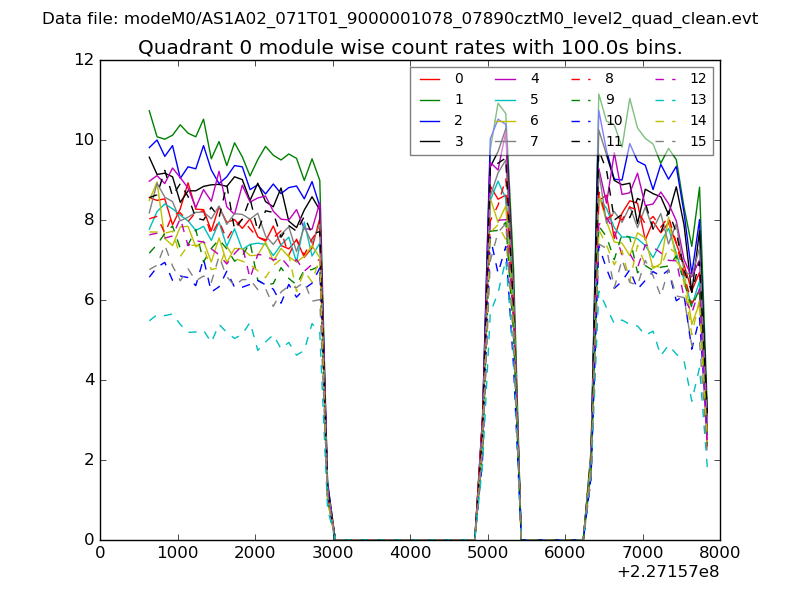 |
 |
| Module-wise count rates for Quadrant B Data is divided into 100 sec bins |
 |
 |
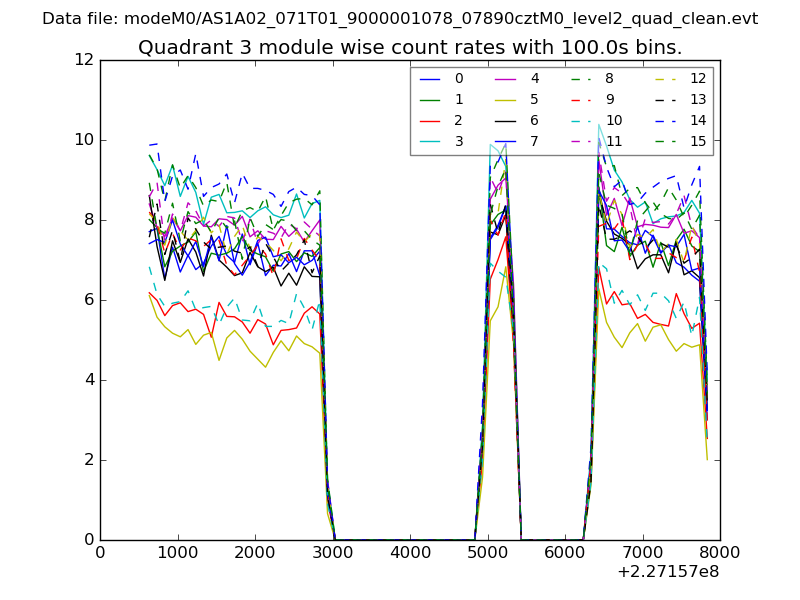
| Module-wise count rates for Quadrant C Data is divided into 100 sec bins |
 |
 |
| Module-wise count rates for Quadrant D Data is divided into 100 sec bins |
 |
 |
| Parameter | Plot |
|---|---|
| CZT HV Monitor | 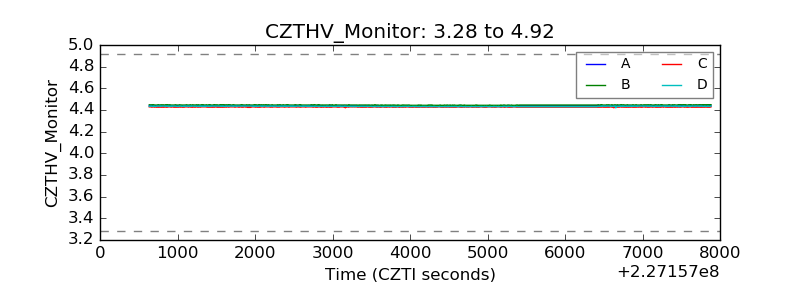 |
| D_VDD | 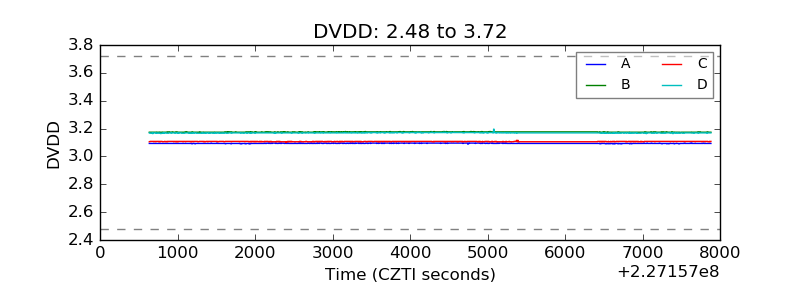 |
| Temperature 1 | 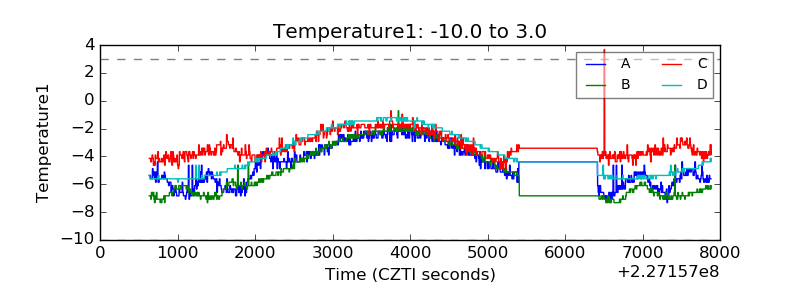 |
| Veto HV Monitor | 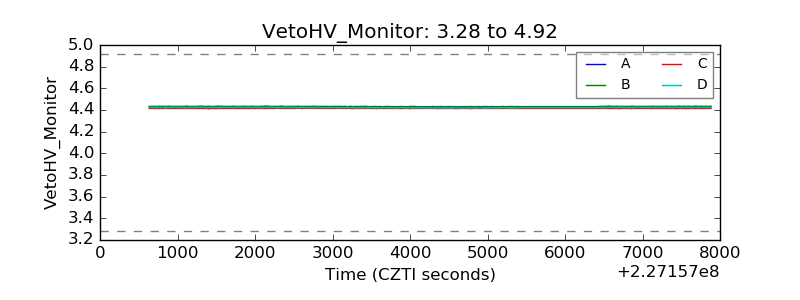 |
| Veto LLD | 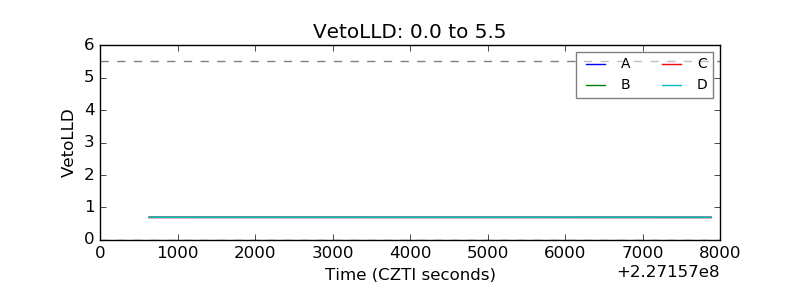 |
| Alpha Counter | 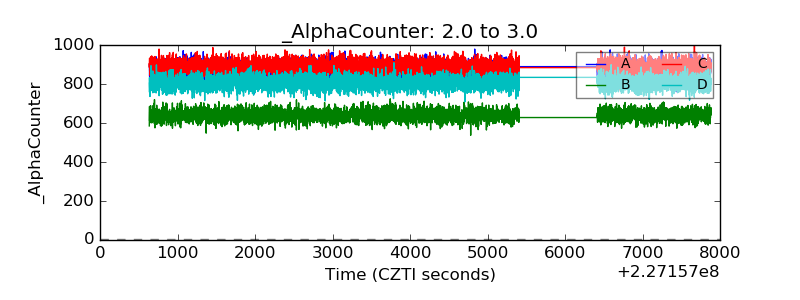 |
| _CPM_Rate | 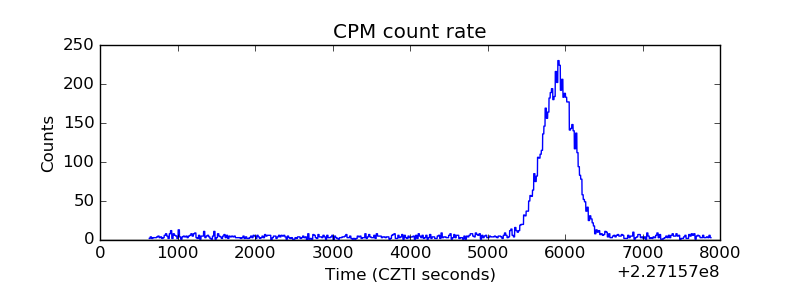 |
| CZT Counter | 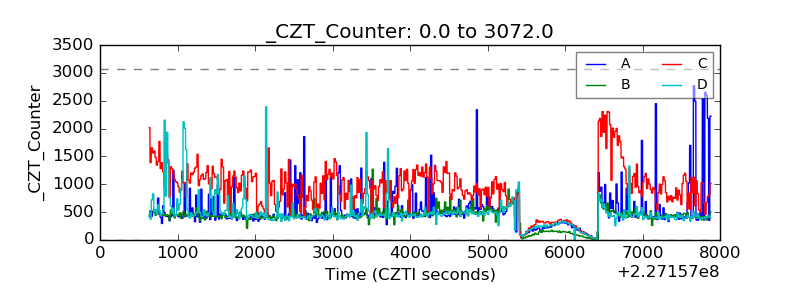 |
| +2.5 Volts monitor | 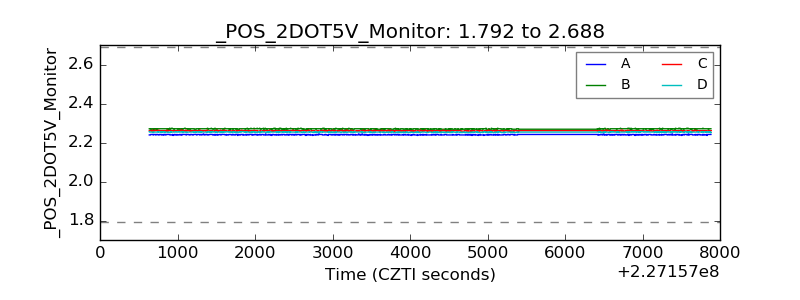 |
| +5 Volts monitor | 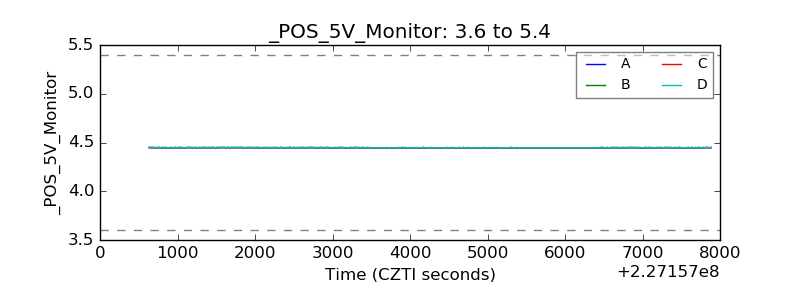 |
| _ROLL_ROT | 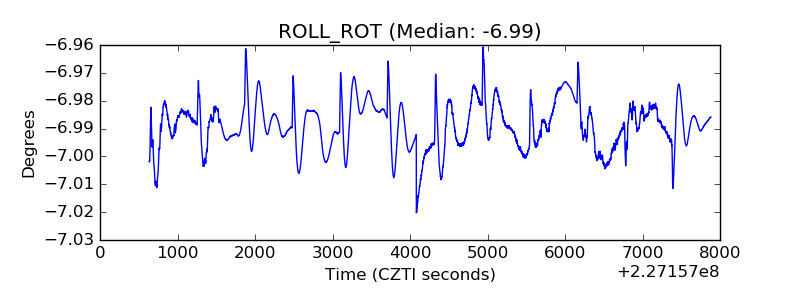 |
| _Roll_DEC | 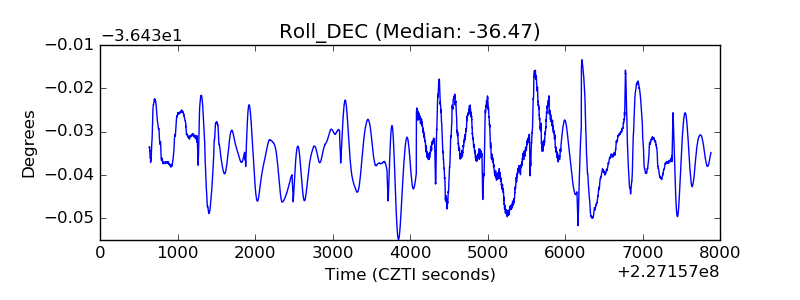 |
| _Roll_RA | 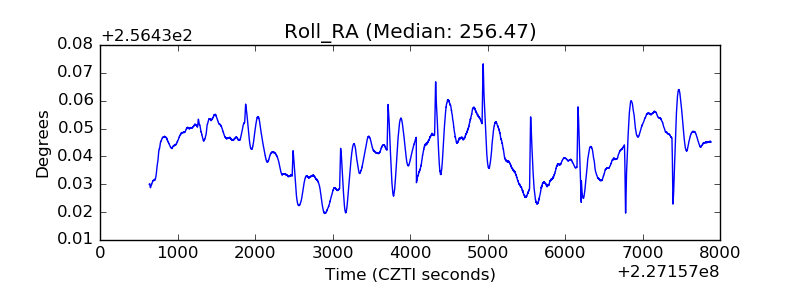 |
| Veto Counter | 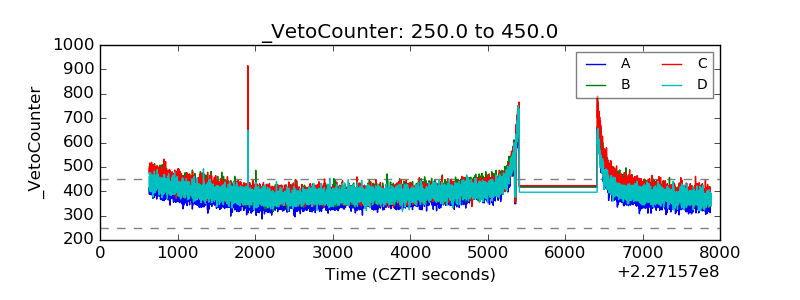 |