| Param | Original file | Final file |
|---|---|---|
| Filename | modeM0/AS1A02_071T01_9000001078_07891cztM0_level2.evt | modeM0/AS1A02_071T01_9000001078_07891cztM0_level2_quad_clean.evt |
| Size (bytes) | 597,896,640 | 96,382,080 |
| Size | 570.2 MB | 91.9 MB |
| Events in quadrant A | 5,129,152 | 595,214 |
| Events in quadrant B | 3,376,960 | 638,582 |
| Events in quadrant C | 5,452,800 | 599,675 |
| Events in quadrant D | 3,670,173 | 593,495 |
| Mode SS | |||
|---|---|---|---|
| Quadrant | BADHDUFLAG | Total packets | Discarded packets |
| A | 0 | 142 | 0 |
| B | 0 | 142 | 0 |
| C | 0 | 142 | 0 |
| D | 0 | 142 | 0 |
| Mode M0 | |||
|---|---|---|---|
| Quadrant | BADHDUFLAG | Total packets | Discarded packets |
| A | 0 | 20063 | 3 |
| B | 0 | 14773 | 2 |
| C | 0 | 21191 | 2 |
| D | 0 | 15889 | 2 |
| Mode M9 | |||
|---|---|---|---|
| Quadrant | BADHDUFLAG | Total packets | Discarded packets |
| A | 0 | 10 | 0 |
| B | 0 | 10 | 0 |
| C | 0 | 10 | 0 |
| D | 0 | 11 | 0 |
| Quadrant | Total seconds | Saturated seconds | Saturation percentage |
|---|---|---|---|
| A | 7059 | 793 | 11.233886% |
| B | 7059 | 103 | 1.459130% |
| C | 7059 | 423 | 5.992350% |
| D | 7059 | 143 | 2.025783% |
Noise dominated data is calculated using 1-second bins in cleaned event files. If a bin has >2000 counts, and if more than 50% of those come from <1% of pixels, then it is considered to be noise-dominated and hence unusable.
| Quadrant | # 1 sec bins | Bins with >0 counts | Bins with >2000 counts | High rate bins dominated by noise | Noise dominated (total time) | Noise dominated (detector-on time) | Marked lightcurve |
|---|---|---|---|---|---|---|---|
| A | 7639 | 7060 | 545 | 545 | 7.13% | 7.72% | 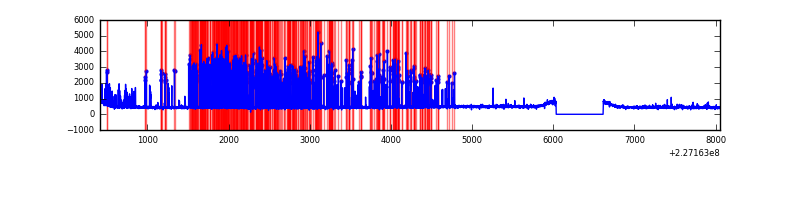 |
| B | 7639 | 7060 | 3 | 3 | 0.04% | 0.04% | 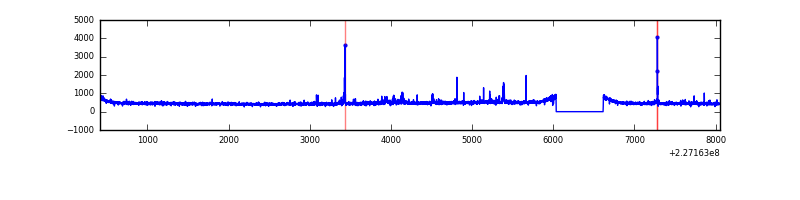 |
| C | 7639 | 7060 | 293 | 293 | 3.84% | 4.15% | 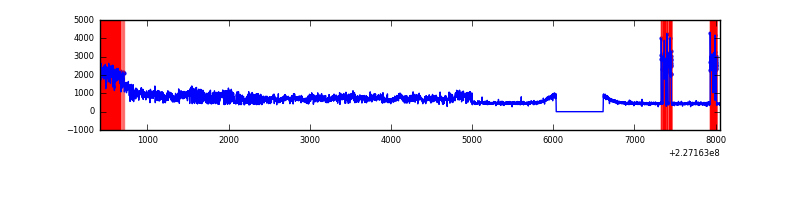 |
| D | 7639 | 7060 | 60 | 60 | 0.79% | 0.85% | 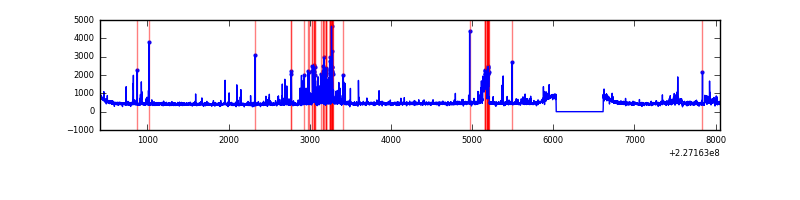 |
Top three noisy pixels from each quadrant. If the there are fewer than three noisy pixels in the level2.evt file, extra rows are filled as -1
| Pixel properties | Quadrant properties | ||||||
|---|---|---|---|---|---|---|---|
| Quadrant | DetID | PixID | Counts | Sigma | Mean | Median | Sigma |
| A | 15 | 239 | 1994188 | 12063.76 | 805 | 785 | 165.2 |
| A | 15 | 223 | 25532 | 149.76 | 805 | 785 | 165.2 |
| A | 0 | 226 | 7470 | 40.46 | 805 | 785 | 165.2 |
| B | 4 | 239 | 66295 | 405.7 | 839 | 816 | 161.4 |
| B | 10 | 16 | 23266 | 139.1 | 839 | 816 | 161.4 |
| B | 12 | 111 | 16620 | 97.92 | 839 | 816 | 161.4 |
| C | 1 | 16 | 1953823 | 10446.86 | 803 | 806 | 186.9 |
| C | 9 | 68 | 362833 | 1936.51 | 803 | 806 | 186.9 |
| C | 13 | 61 | 6000 | 27.78 | 803 | 806 | 186.9 |
| D | 1 | 52 | 375929 | 1866.86 | 815 | 789 | 200.9 |
| D | 12 | 233 | 77503 | 381.76 | 815 | 789 | 200.9 |
| D | 1 | 20 | 32843 | 159.52 | 815 | 789 | 200.9 |
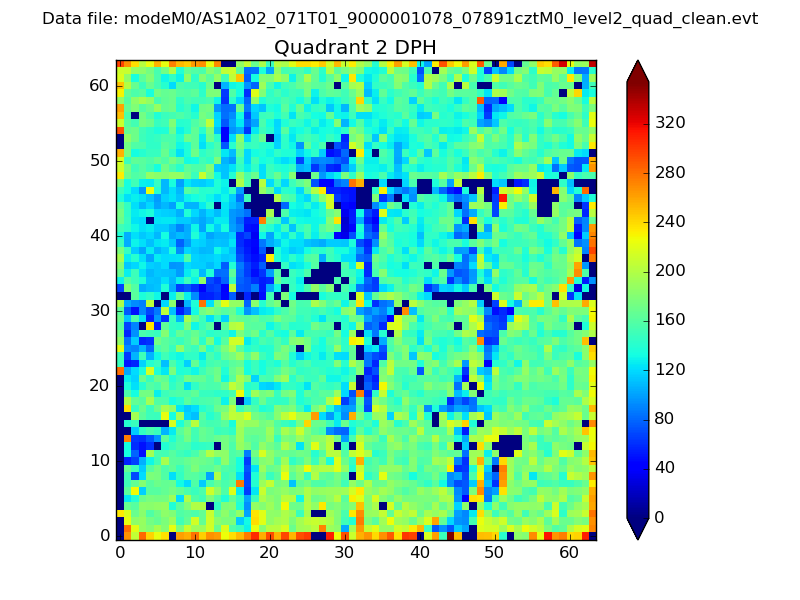
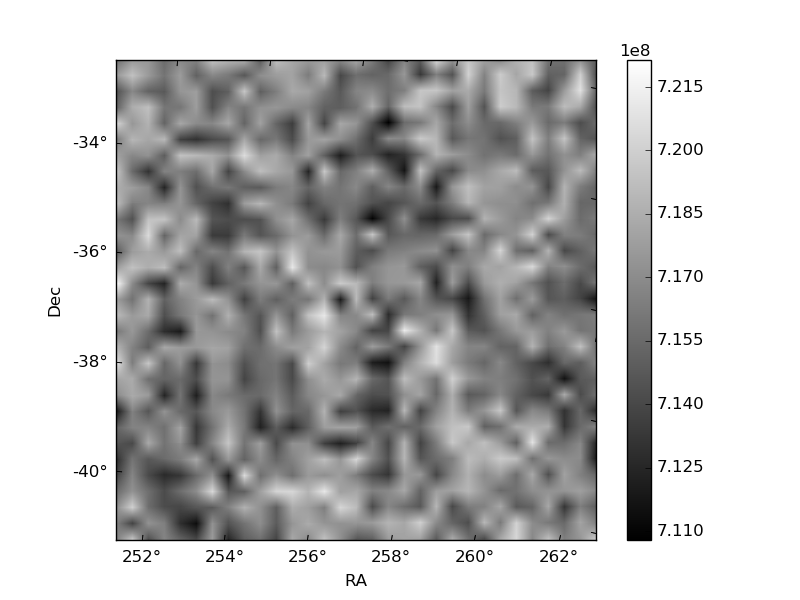
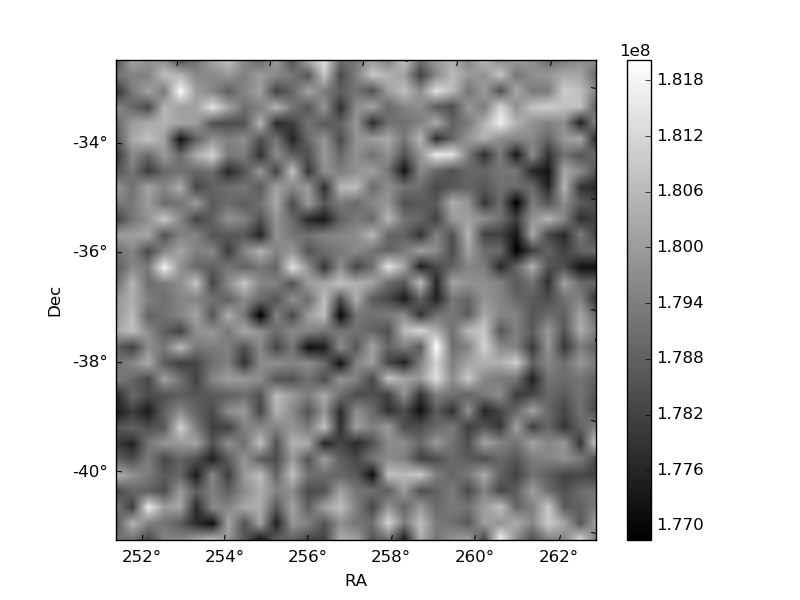
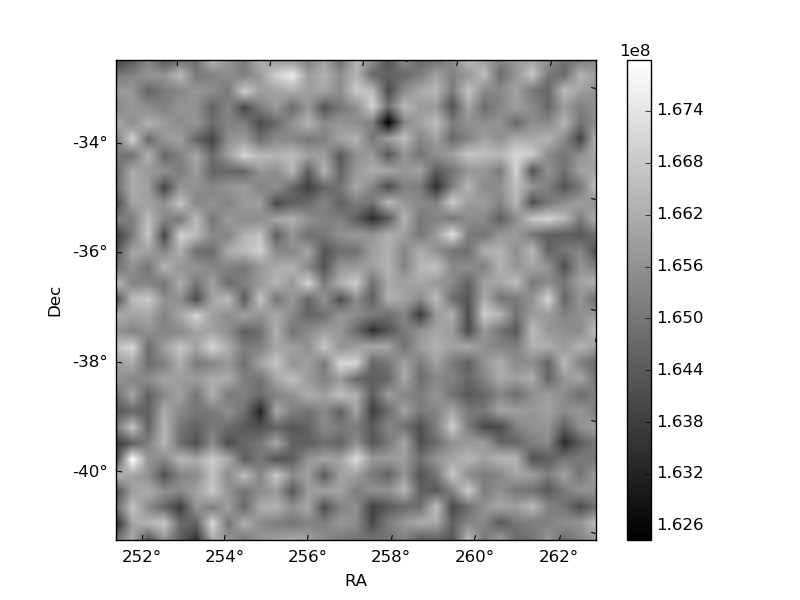
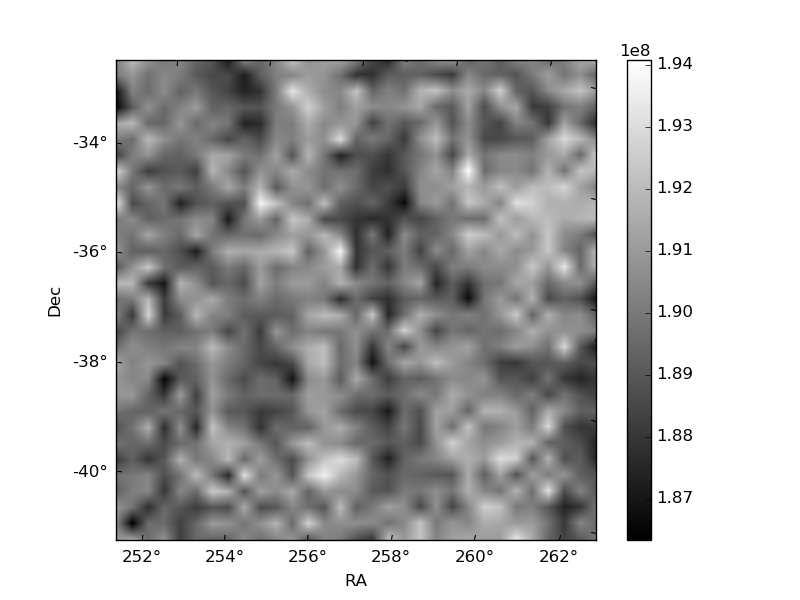
Histogram calculated using DETX and DETY for each event in the final _common_clean file
| Quadrant A | 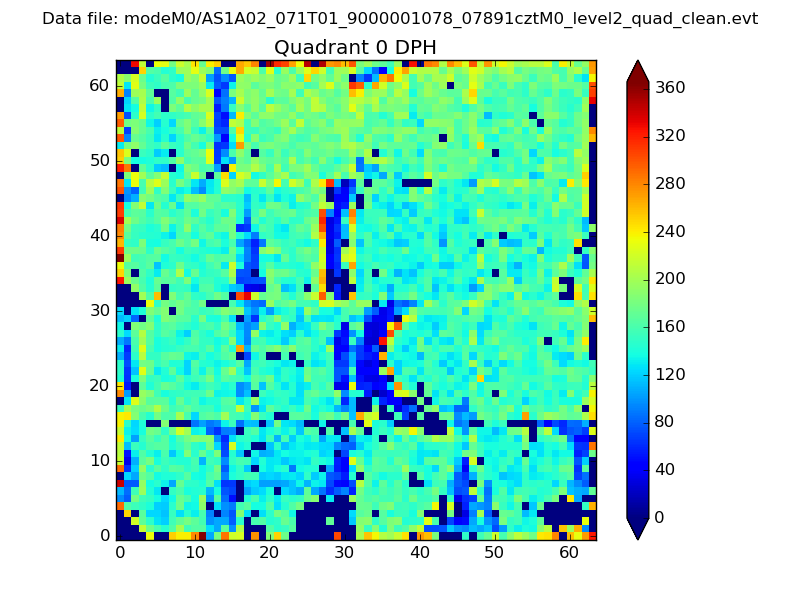 |
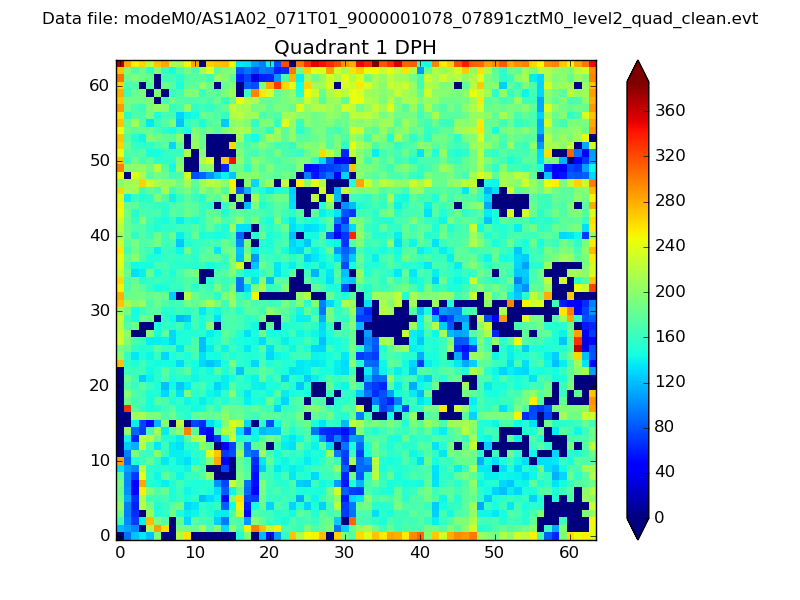 |
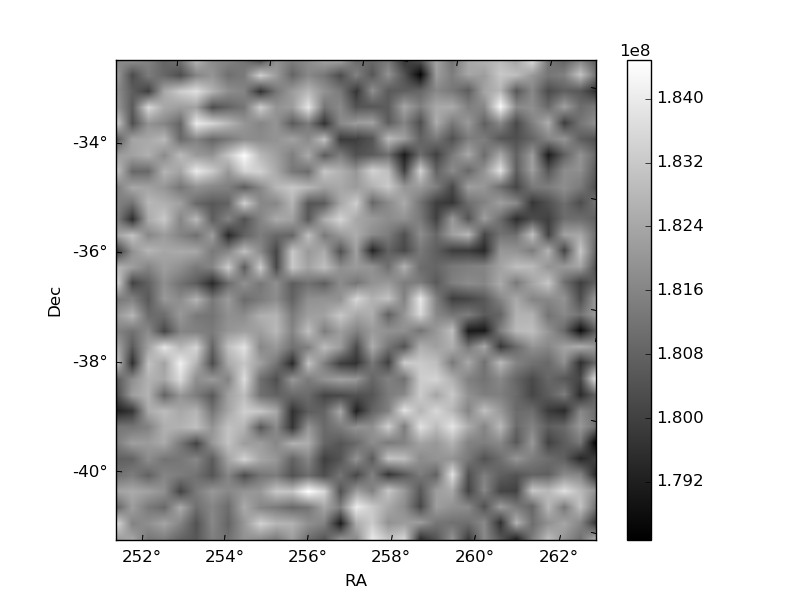
Quadrant B |
|---|---|---|---|
| Quadrant D | 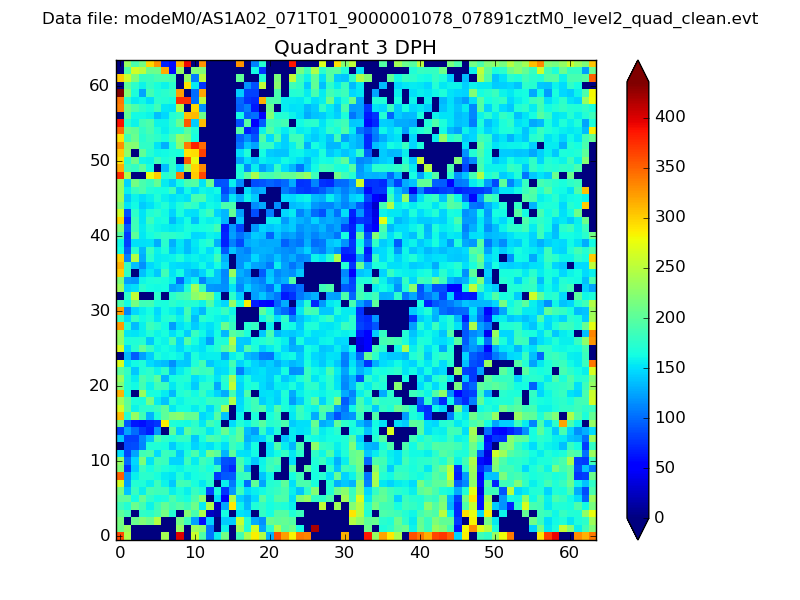 |
 |
Quadrant C |
| Plot type | Count rate plots | Images |
|---|---|---|
| Comparison with Poisson distribution Blue bars denote a histogram of data divided into 1 sec bins. Red curve is a Poisson curve with rate = median count rate of data. |
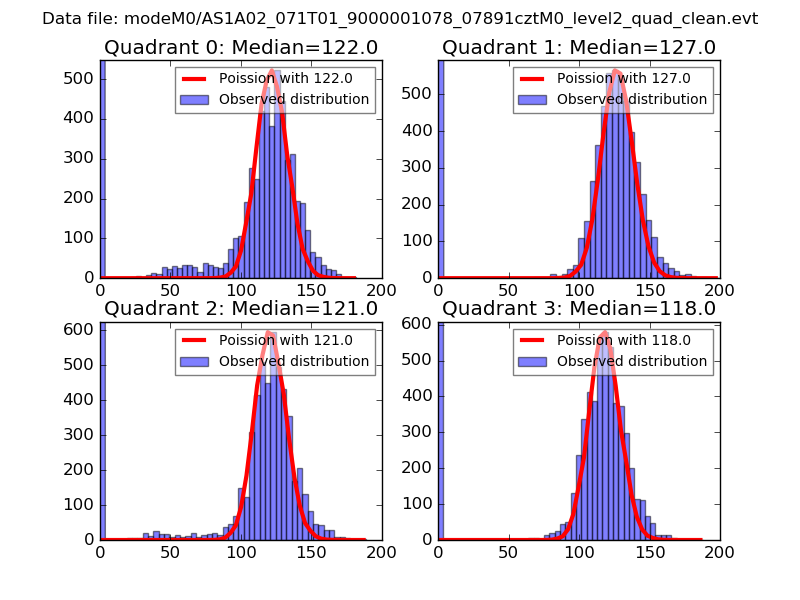 |
 |
| Quadrant-wise count rates Data is divided into 100 sec bins |
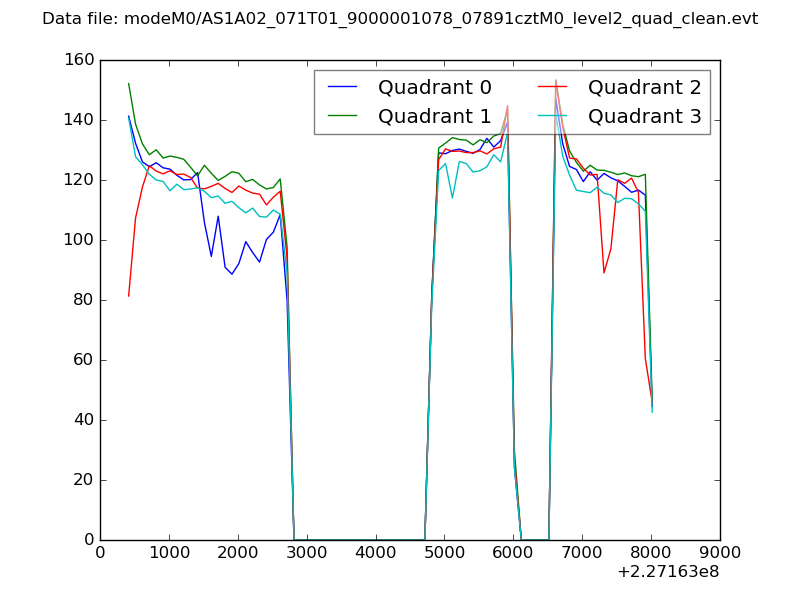 |
|
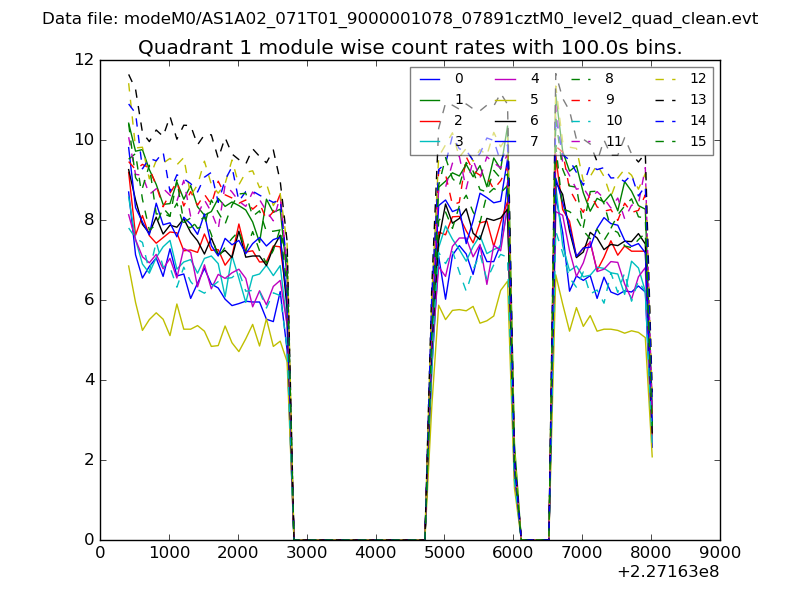
| Module-wise count rates for Quadrant A Data is divided into 100 sec bins |
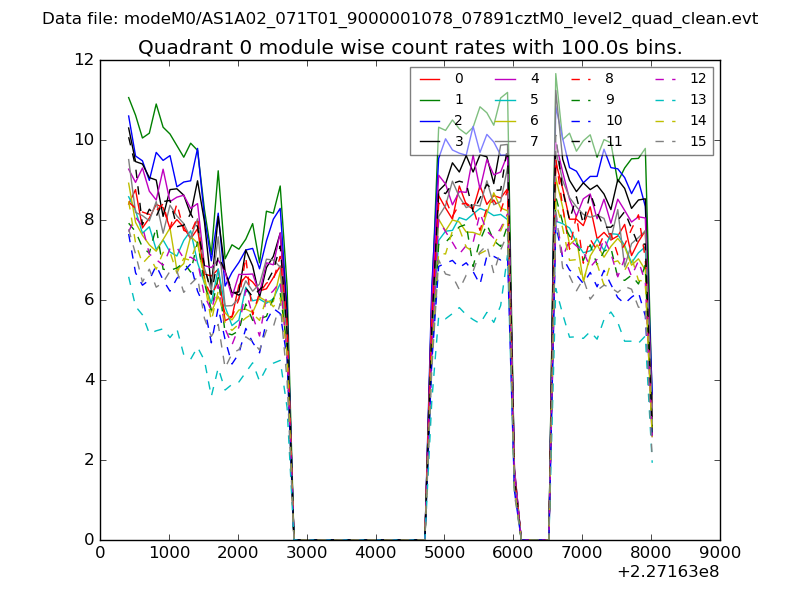 |
 |
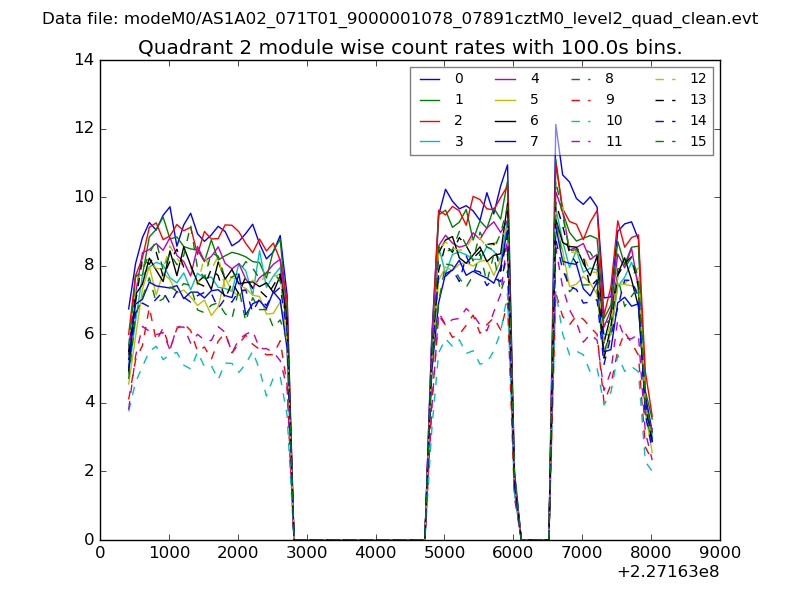
| Module-wise count rates for Quadrant B Data is divided into 100 sec bins |
 |
 |
| Module-wise count rates for Quadrant C Data is divided into 100 sec bins |
 |
 |
| Module-wise count rates for Quadrant D Data is divided into 100 sec bins |
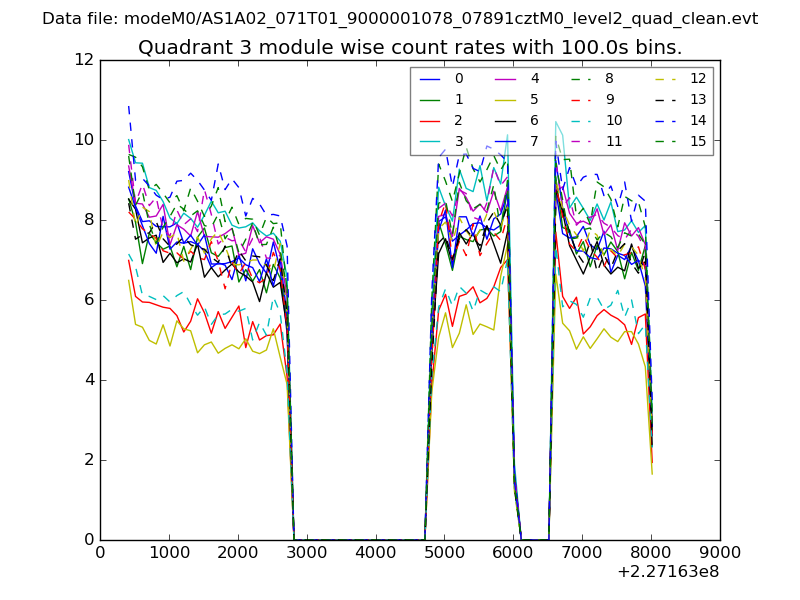 |
 |
| Parameter | Plot |
|---|---|
| CZT HV Monitor | 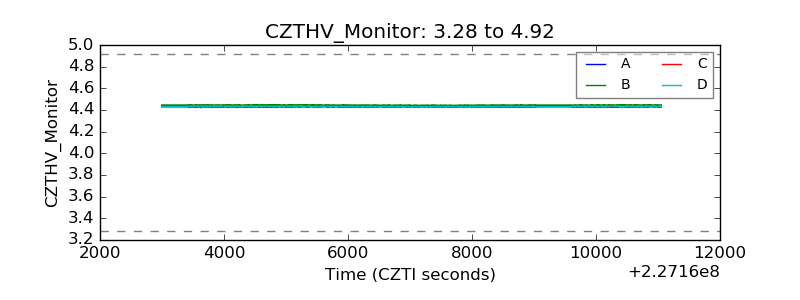 |
| D_VDD | 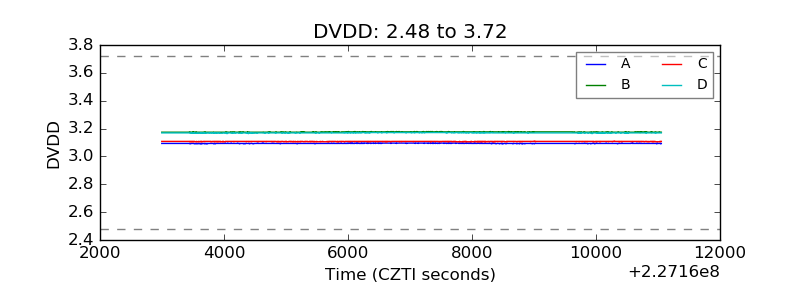 |
| Temperature 1 | 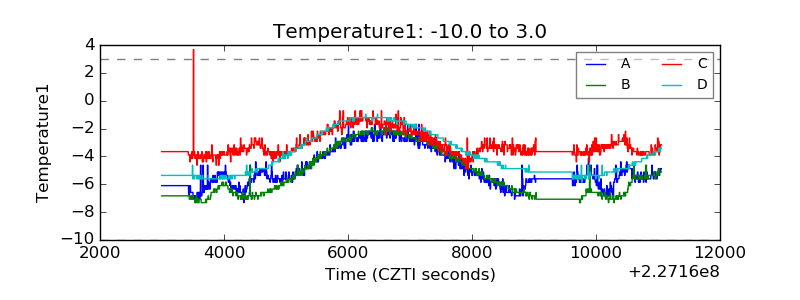 |
| Veto HV Monitor | 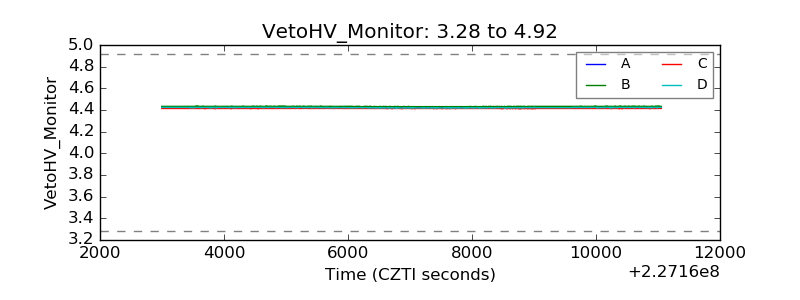 |
| Veto LLD | 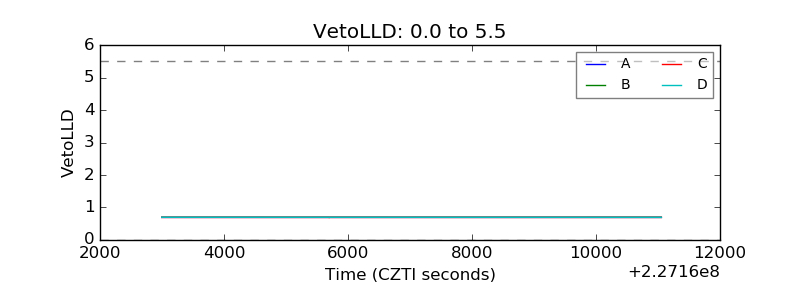 |
| Alpha Counter | 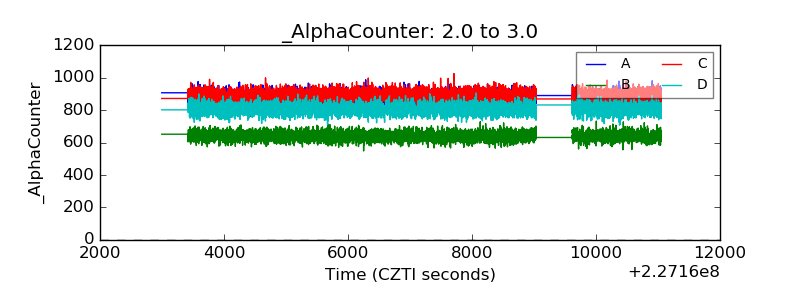 |
| _CPM_Rate | 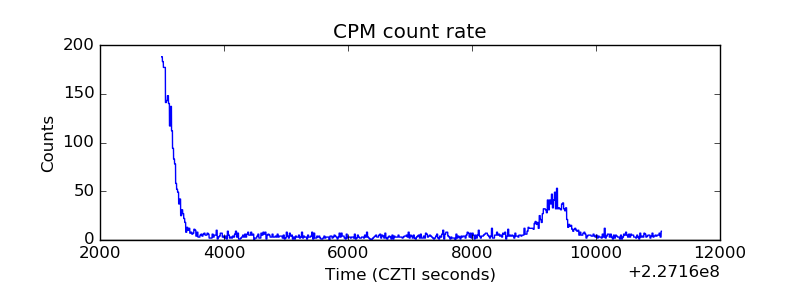 |
| CZT Counter | 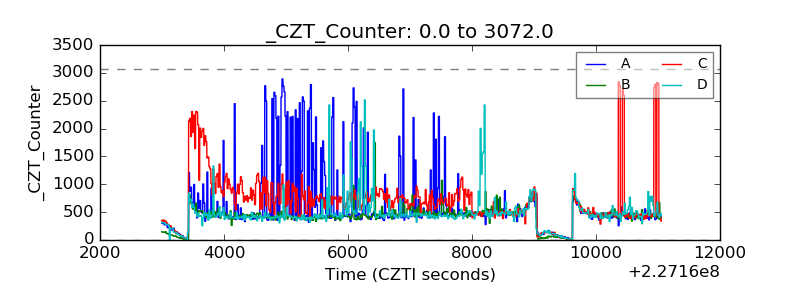 |
| +2.5 Volts monitor | 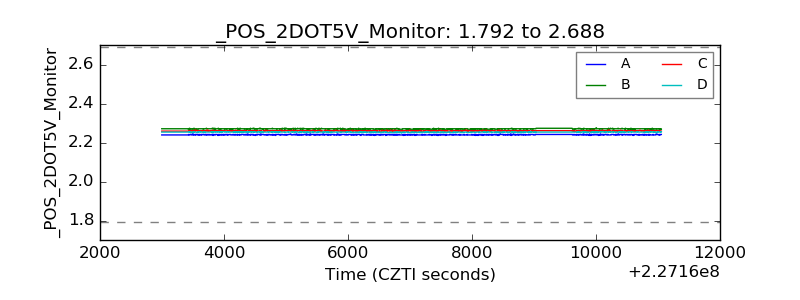 |
| +5 Volts monitor | 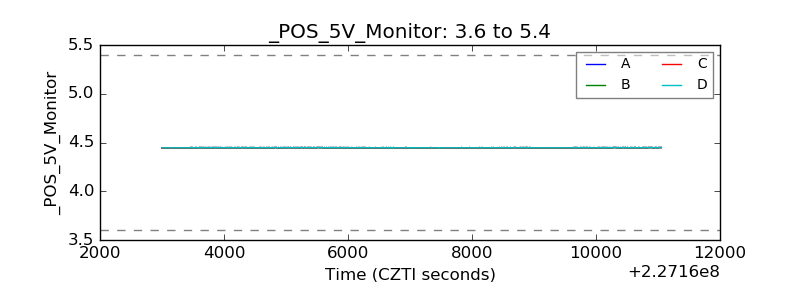 |
| _ROLL_ROT | 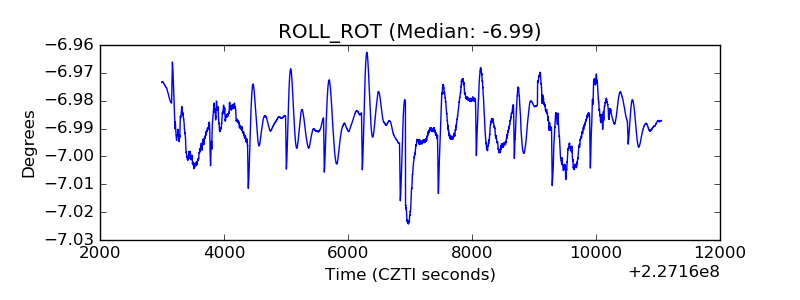 |
| _Roll_DEC | 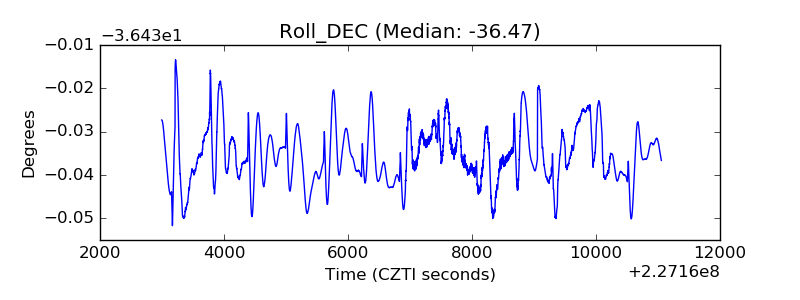 |
| _Roll_RA | 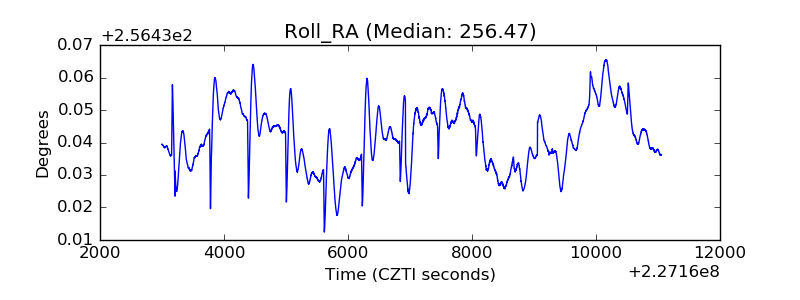 |
| Veto Counter | 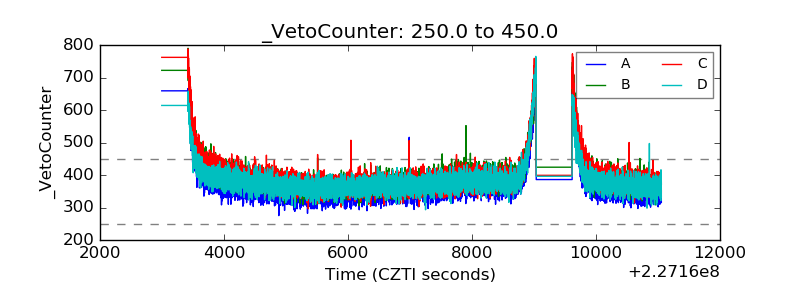 |