| Param | Original file | Final file |
|---|---|---|
| Filename | modeM0/AS1A02_029T01_9000001082cztM0_level2.fits | modeM0/AS1A02_029T01_9000001082cztM0_level2_quad_clean.evt |
| Size (bytes) | 463,752,000 | 454,386,240 |
| Size | 442.3 MB | 433.3 MB |
| Events in quadrant A | 2,769,660 | 2,683,627 |
| Events in quadrant B | 2,708,304 | 2,725,492 |
| Events in quadrant C | 2,741,406 | 2,577,889 |
| Events in quadrant D | 2,365,278 | 2,315,424 |
| Mode M0 | |||
|---|---|---|---|
| Quadrant | BADHDUFLAG | Total packets | Discarded packets |
| A | 0 | 107158 | 0 |
| B | 0 | 107313 | 0 |
| C | 0 | 130634 | 0 |
| D | 0 | 116571 | 0 |
| Mode SS | |||
|---|---|---|---|
| Quadrant | BADHDUFLAG | Total packets | Discarded packets |
| A | 0 | 1038 | 0 |
| B | 0 | 1068 | 0 |
| C | 0 | 1072 | 0 |
| D | 0 | 1072 | 0 |
| Mode M9 | |||
|---|---|---|---|
| Quadrant | BADHDUFLAG | Total packets | Discarded packets |
| A | 0 | 65 | 0 |
| B | 0 | 65 | 0 |
| C | 0 | 65 | 0 |
| D | 0 | 65 | 0 |
| Quadrant | Total seconds | Saturated seconds | Saturation percentage |
|---|---|---|---|
| A | 50364 | 1102 | 2.188071% |
| B | 50236 | 1046 | 2.082172% |
| C | 50243 | 1177 | 2.342615% |
| D | 50207 | 1800 | 3.585157% |
Noise dominated data is calculated using 1-second bins in cleaned event files. If a bin has >2000 counts, and if more than 50% of those come from <1% of pixels, then it is considered to be noise-dominated and hence unusable.
| Quadrant | # 1 sec bins | Bins with >0 counts | Bins with >2000 counts | High rate bins dominated by noise | Noise dominated (total time) | Noise dominated (detector-on time) | Marked lightcurve |
|---|---|---|---|---|---|---|---|
| A | 59309 | 50688 | 0 | 0 | 0.00% | 0.00% |  |
| B | 59309 | 50542 | 0 | 0 | 0.00% | 0.00% |  |
| C | 59309 | 50537 | 0 | 0 | 0.00% | 0.00% | 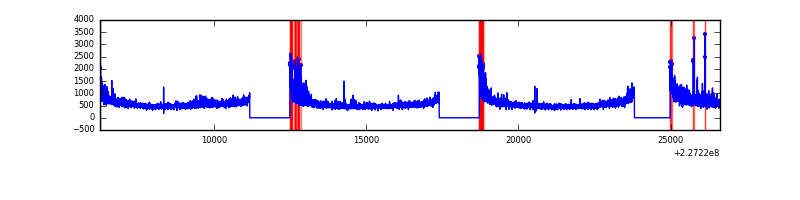 |
| D | 59309 | 50463 | 0 | 0 | 0.00% | 0.00% |  |
Top three noisy pixels from each quadrant. If the there are fewer than three noisy pixels in the level2.evt file, extra rows are filled as -1
| Pixel properties | Quadrant properties | ||||||
|---|---|---|---|---|---|---|---|
| Quadrant | DetID | PixID | Counts | Sigma | Mean | Median | Sigma |
| A | 14 | 188 | 2758 | 11.4 | 719 | 670 | 183.1 |
| A | 0 | 29 | 2629 | 10.7 | 719 | 670 | 183.1 |
| A | 14 | 204 | 2341 | 9.12 | 719 | 670 | 183.1 |
| B | 2 | 9 | 2354 | 11.73 | 713 | 677 | 142.9 |
| B | 3 | 17 | 1836 | 8.11 | 713 | 677 | 142.9 |
| B | 2 | 8 | 1799 | 7.85 | 713 | 677 | 142.9 |
| C | 12 | 241 | 1998 | 6.98 | 724 | 669 | 190.4 |
| C | 3 | 158 | 1885 | 6.39 | 724 | 669 | 190.4 |
| C | 9 | 188 | 1854 | 6.22 | 724 | 669 | 190.4 |
| D | 3 | 14 | 1791 | 6.46 | 674 | 610 | 182.7 |
| D | 6 | 231 | 1741 | 6.19 | 674 | 610 | 182.7 |
| D | 7 | 5 | 1678 | 5.85 | 674 | 610 | 182.7 |
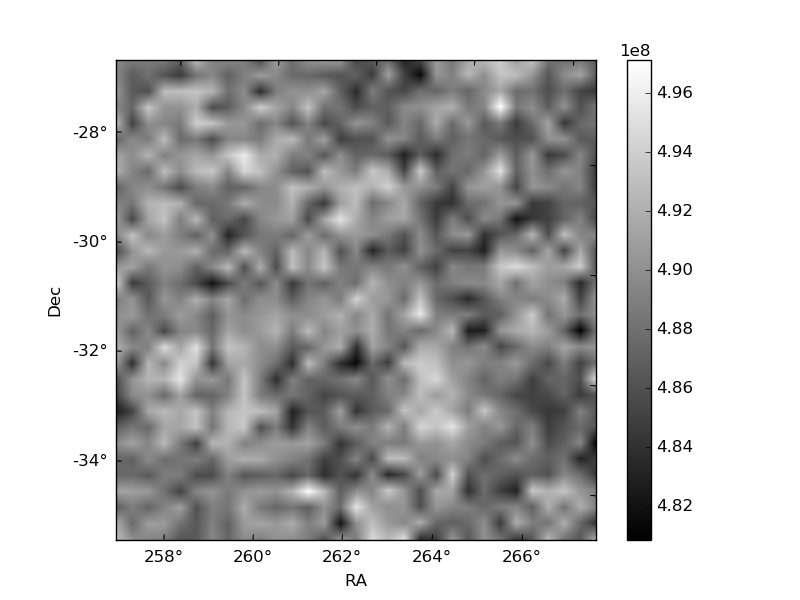
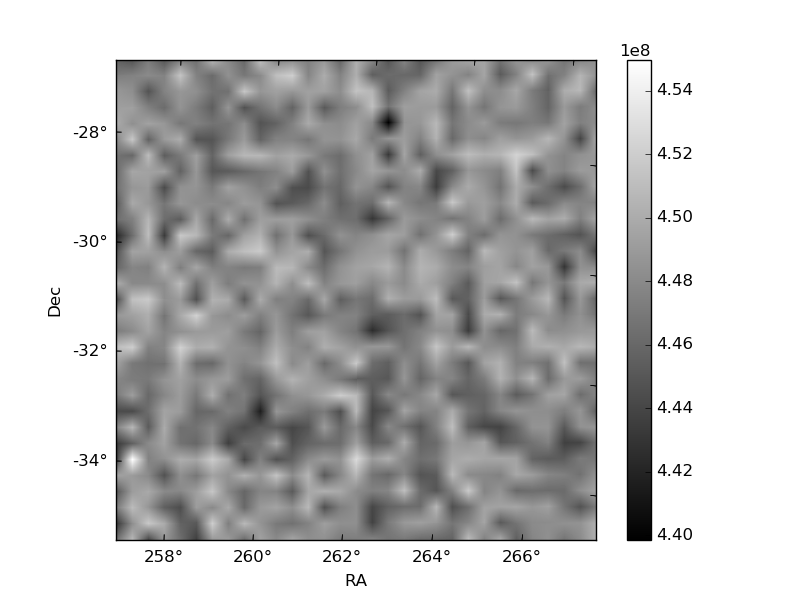
Histogram calculated using DETX and DETY for each event in the final _common_clean file
| Quadrant A | 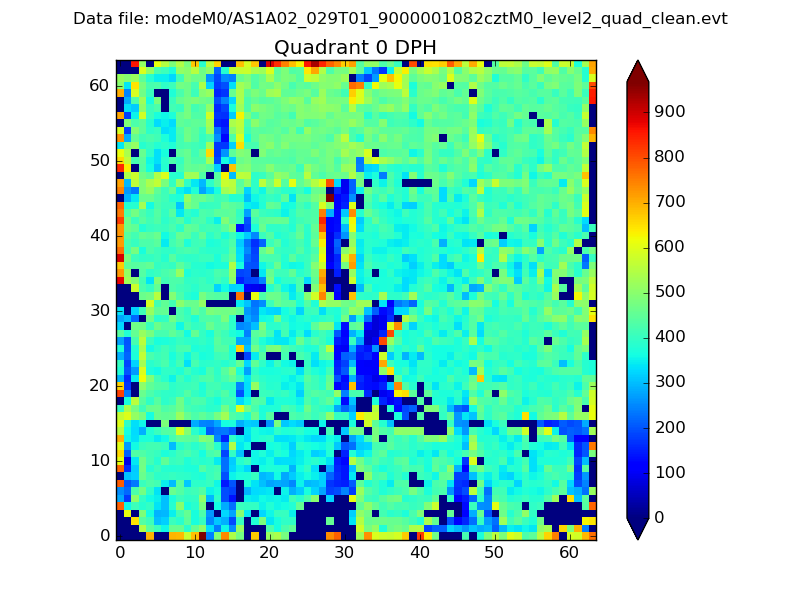 |
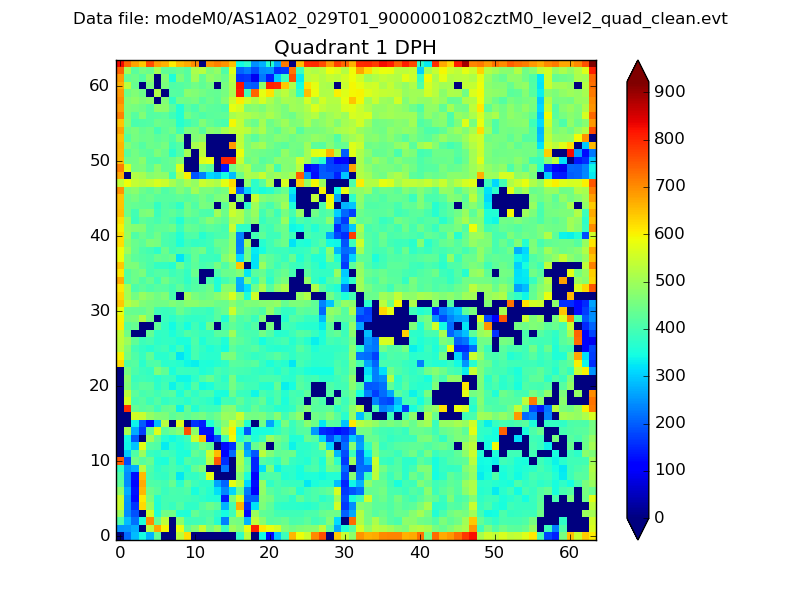 |
Quadrant B |
|---|---|---|---|
| Quadrant D |  |
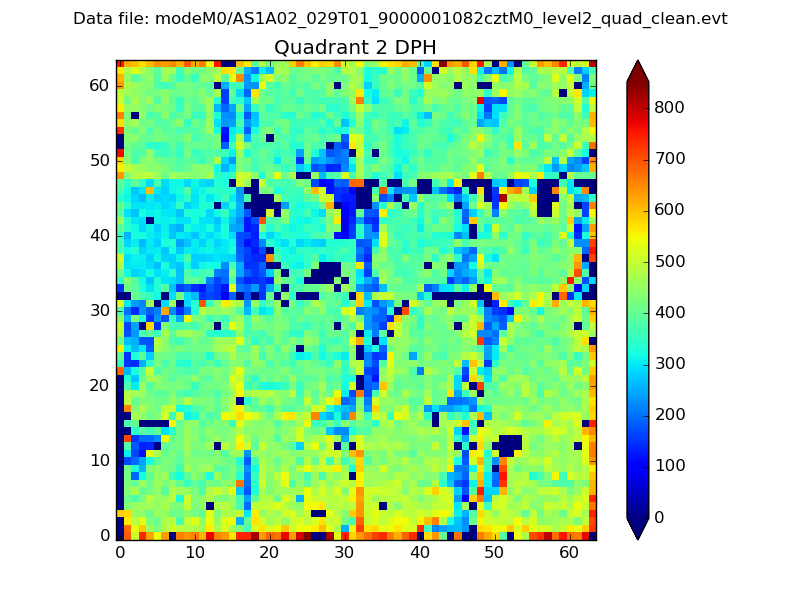 |
Quadrant C |
| Plot type | Count rate plots | Images |
|---|---|---|
| Comparison with Poisson distribution Blue bars denote a histogram of data divided into 1 sec bins. Red curve is a Poisson curve with rate = median count rate of data. |
 |
 |
| Quadrant-wise count rates Data is divided into 100 sec bins |
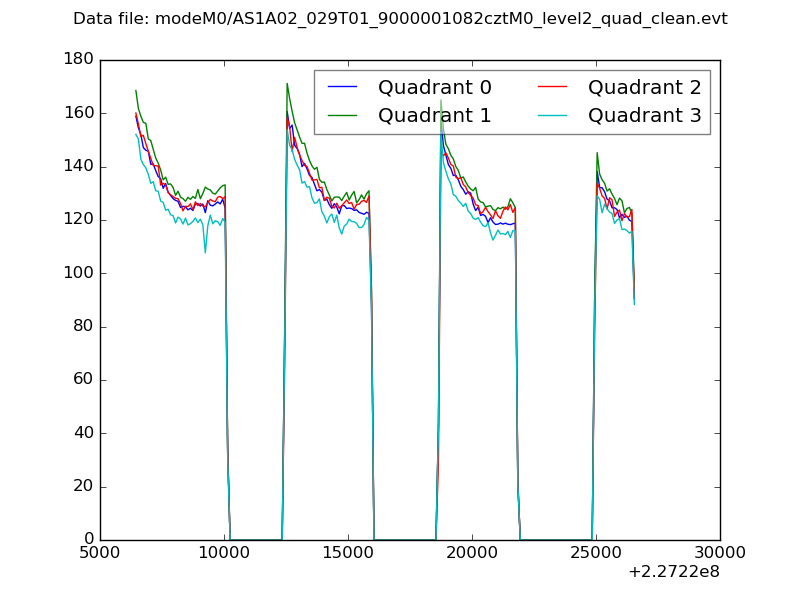 |
|
| Module-wise count rates for Quadrant A Data is divided into 100 sec bins |
 |
 |
| Module-wise count rates for Quadrant B Data is divided into 100 sec bins |
 |
 |
| Module-wise count rates for Quadrant C Data is divided into 100 sec bins |
 |
 |
| Module-wise count rates for Quadrant D Data is divided into 100 sec bins |
 |
 |
| Parameter | Plot |
|---|---|
| CZT HV Monitor |  |
| D_VDD |  |
| Temperature 1 |  |
| Veto HV Monitor |  |
| Veto LLD |  |
| Alpha Counter |  |
| _CPM_Rate | 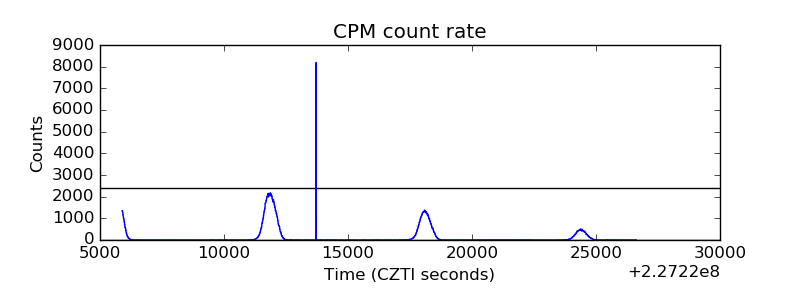 |
| CZT Counter |  |
| +2.5 Volts monitor |  |
| +5 Volts monitor |  |
| _ROLL_ROT |  |
| _Roll_DEC | 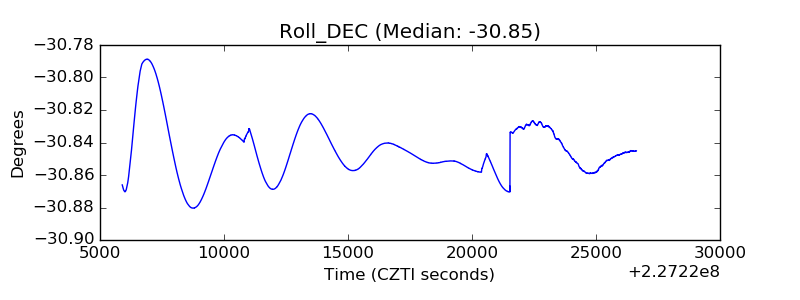 |
| _Roll_RA |  |
| Veto Counter |  |