| Param | Original file | Final file |
|---|---|---|
| Filename | modeM0/AS1A02_029T01_9000001082_07901cztM0_level2.evt | modeM0/AS1A02_029T01_9000001082_07901cztM0_level2_quad_clean.evt |
| Size (bytes) | 95,060,160 | 22,812,480 |
| Size | 90.7 MB | 21.8 MB |
| Events in quadrant A | 654,654 | 149,452 |
| Events in quadrant B | 684,282 | 156,419 |
| Events in quadrant C | 834,725 | 150,956 |
| Events in quadrant D | 620,566 | 142,617 |
| Mode M0 | |||
|---|---|---|---|
| Quadrant | BADHDUFLAG | Total packets | Discarded packets |
| A | 0 | 2653 | 2 |
| B | 0 | 2775 | 1 |
| C | 0 | 3301 | 1 |
| D | 0 | 2589 | 1 |
| Mode SS | |||
|---|---|---|---|
| Quadrant | BADHDUFLAG | Total packets | Discarded packets |
| A | 0 | 24 | 0 |
| B | 0 | 24 | 0 |
| C | 0 | 24 | 0 |
| D | 0 | 24 | 0 |
| Mode M9 | |||
|---|---|---|---|
| Quadrant | BADHDUFLAG | Total packets | Discarded packets |
| A | 0 | 4 | 0 |
| B | 0 | 4 | 0 |
| C | 0 | 4 | 0 |
| D | 0 | 4 | 0 |
| Quadrant | Total seconds | Saturated seconds | Saturation percentage |
|---|---|---|---|
| A | 1203 | 13 | 1.080632% |
| B | 1203 | 5 | 0.415628% |
| C | 1203 | 22 | 1.828761% |
| D | 1203 | 3 | 0.249377% |
Noise dominated data is calculated using 1-second bins in cleaned event files. If a bin has >2000 counts, and if more than 50% of those come from <1% of pixels, then it is considered to be noise-dominated and hence unusable.
| Quadrant | # 1 sec bins | Bins with >0 counts | Bins with >2000 counts | High rate bins dominated by noise | Noise dominated (total time) | Noise dominated (detector-on time) | Marked lightcurve |
|---|---|---|---|---|---|---|---|
| A | 1203 | 1203 | 4 | 4 | 0.33% | 0.33% | 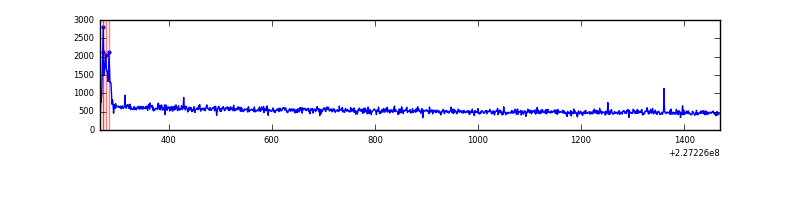 |
| B | 1203 | 1203 | 0 | 0 | 0.00% | 0.00% | 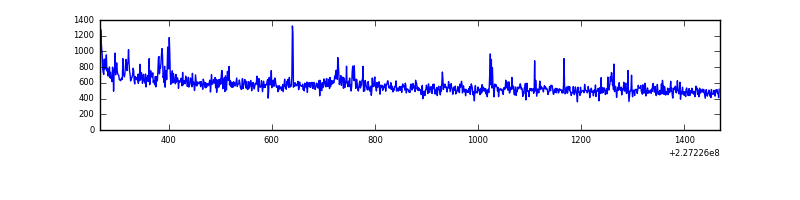 |
| C | 1203 | 1203 | 2 | 2 | 0.17% | 0.17% | 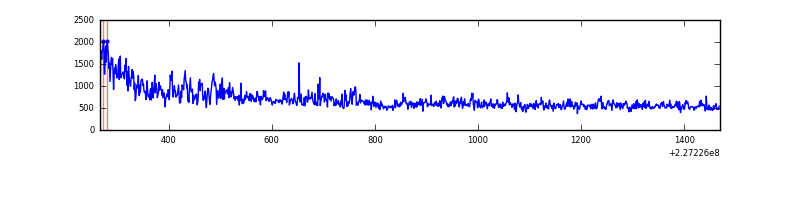 |
| D | 1203 | 1203 | 1 | 1 | 0.08% | 0.08% | 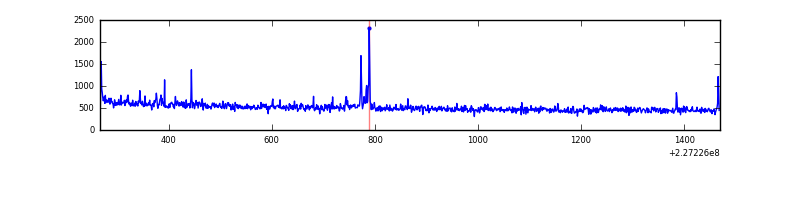 |
Top three noisy pixels from each quadrant. If the there are fewer than three noisy pixels in the level2.evt file, extra rows are filled as -1
| Pixel properties | Quadrant properties | ||||||
|---|---|---|---|---|---|---|---|
| Quadrant | DetID | PixID | Counts | Sigma | Mean | Median | Sigma |
| A | 0 | 52 | 18973 | 535.01 | 162 | 159 | 35.2 |
| A | 8 | 15 | 4930 | 135.67 | 162 | 159 | 35.2 |
| A | 13 | 251 | 4080 | 111.5 | 162 | 159 | 35.2 |
| B | 4 | 173 | 14873 | 440.94 | 168 | 164 | 33.4 |
| B | 0 | 214 | 5229 | 151.83 | 168 | 164 | 33.4 |
| B | 4 | 239 | 3164 | 89.93 | 168 | 164 | 33.4 |
| C | 1 | 16 | 213566 | 5536.36 | 159 | 160 | 38.5 |
| C | 13 | 61 | 1239 | 27.99 | 159 | 160 | 38.5 |
| C | 12 | 4 | 755 | 15.44 | 159 | 160 | 38.5 |
| D | 1 | 52 | 11785 | 292.13 | 155 | 150 | 39.8 |
| D | 13 | 169 | 8511 | 209.93 | 155 | 150 | 39.8 |
| D | 2 | 14 | 5228 | 127.5 | 155 | 150 | 39.8 |
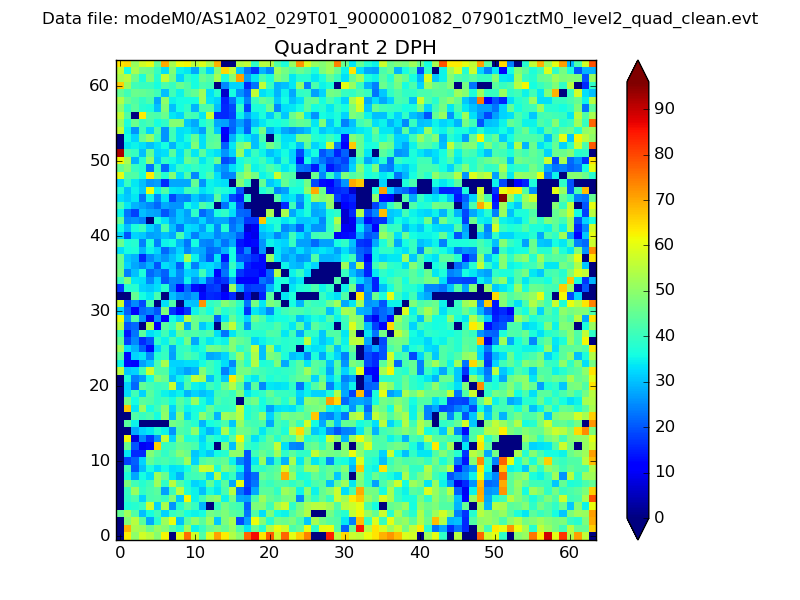
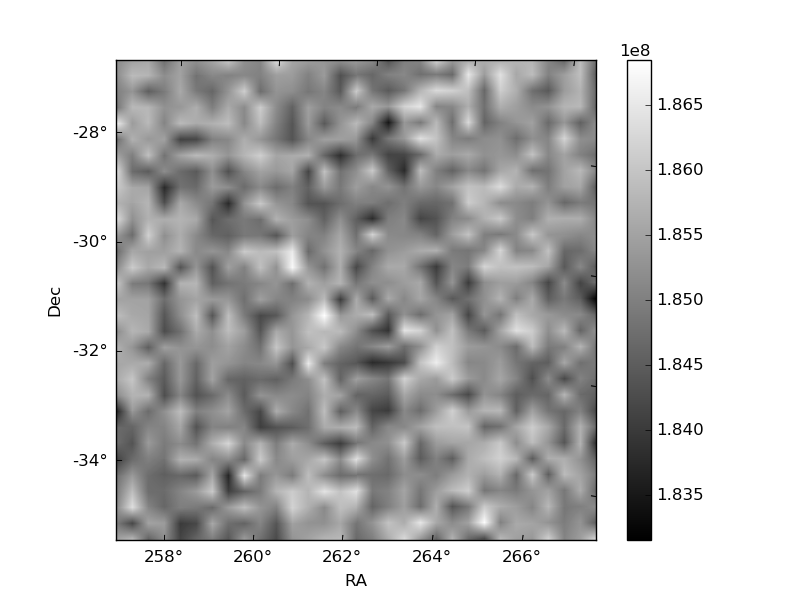
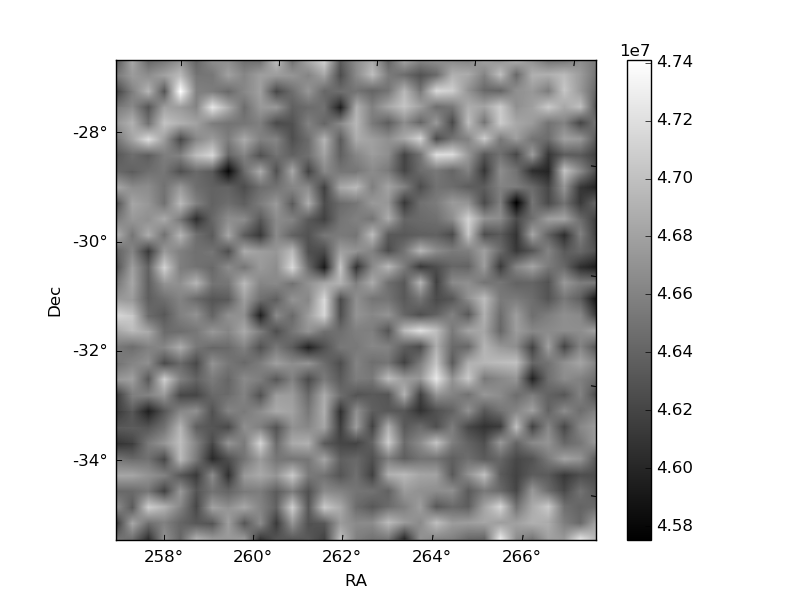
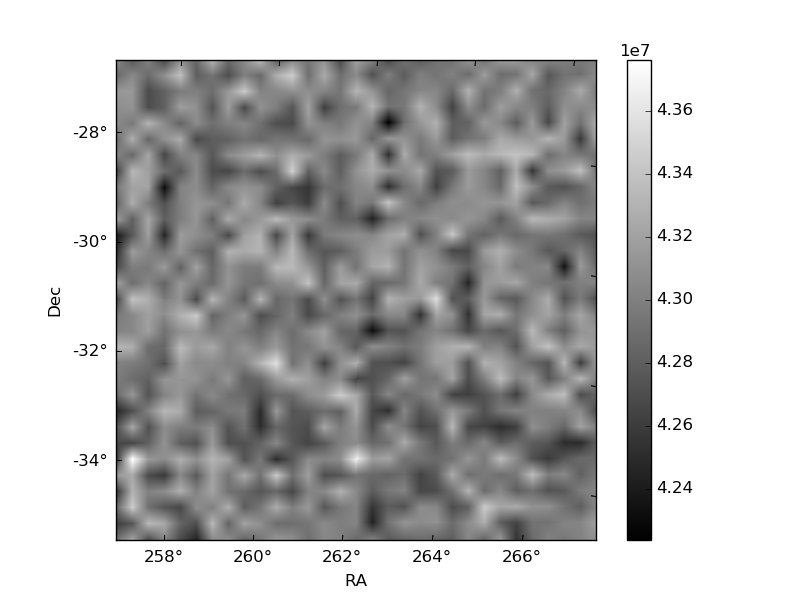
Histogram calculated using DETX and DETY for each event in the final _common_clean file
| Quadrant A | 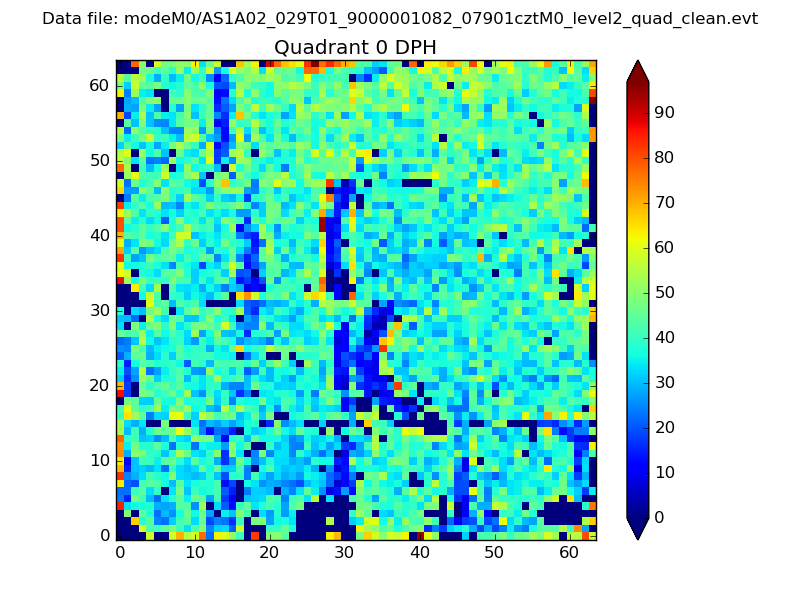 |
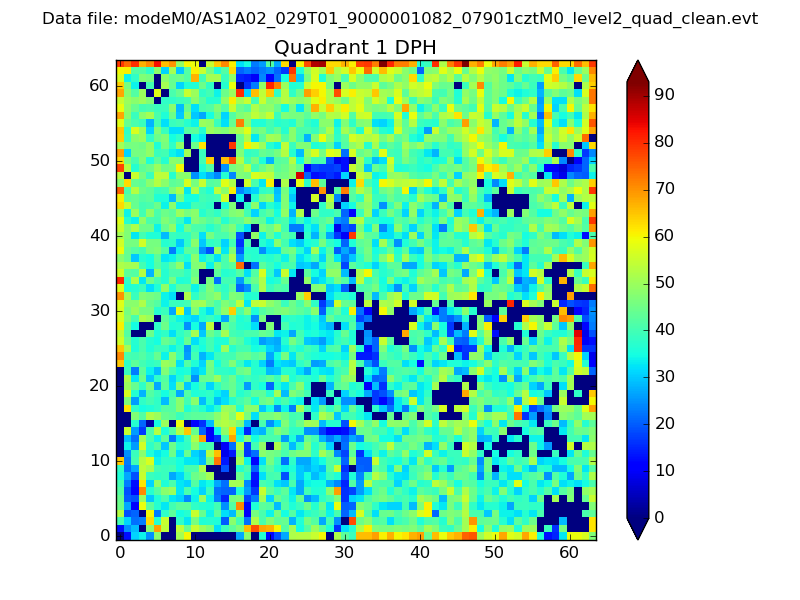 |
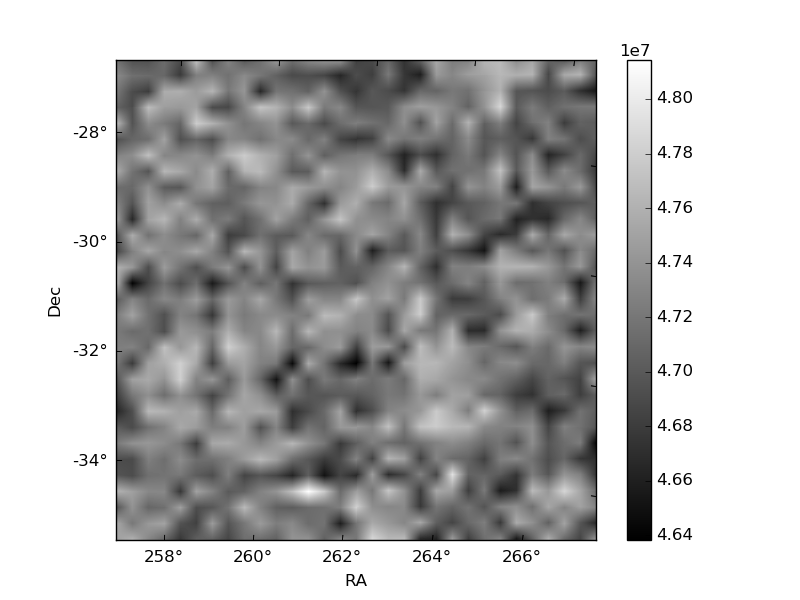
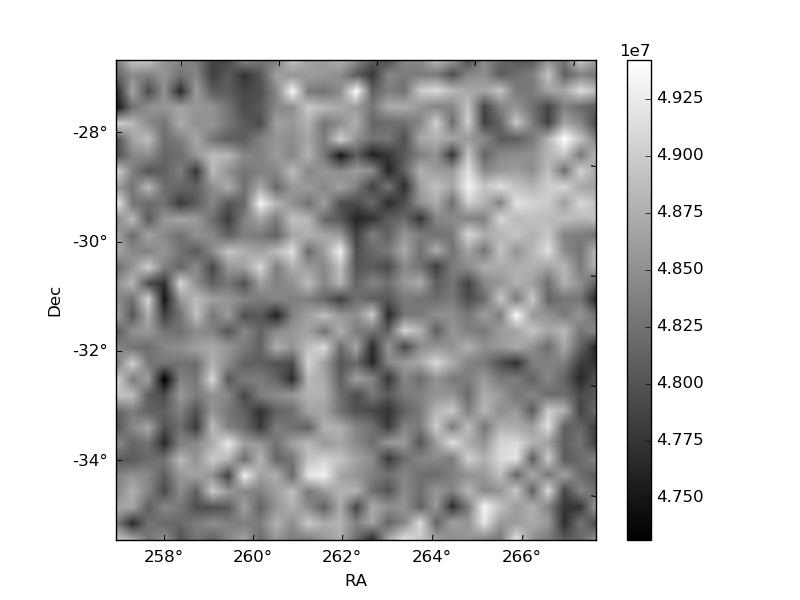
Quadrant B |
|---|---|---|---|
| Quadrant D | 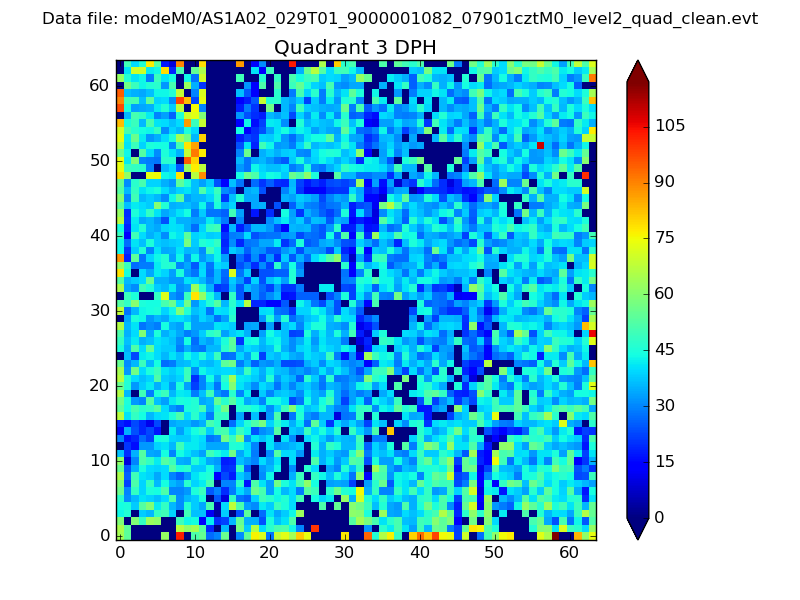 |
 |
Quadrant C |
| Plot type | Count rate plots | Images |
|---|---|---|
| Comparison with Poisson distribution Blue bars denote a histogram of data divided into 1 sec bins. Red curve is a Poisson curve with rate = median count rate of data. |
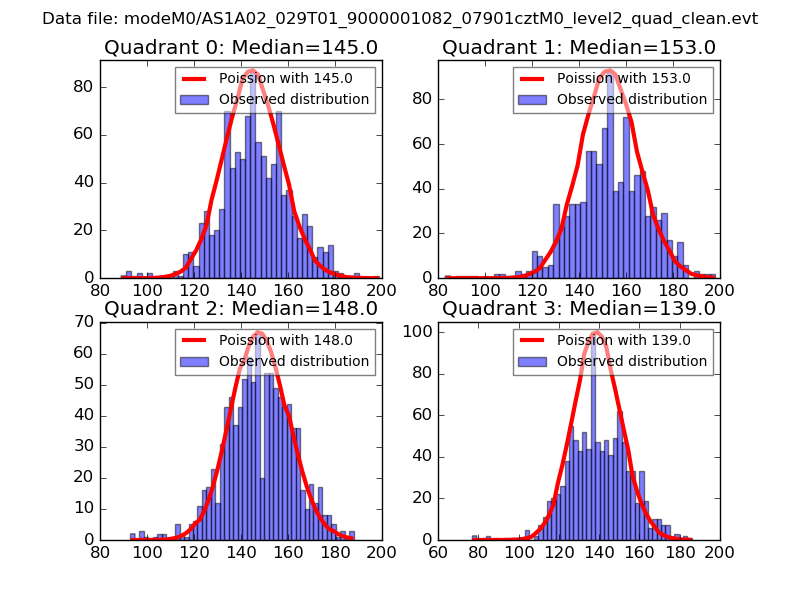 |
 |
| Quadrant-wise count rates Data is divided into 100 sec bins |
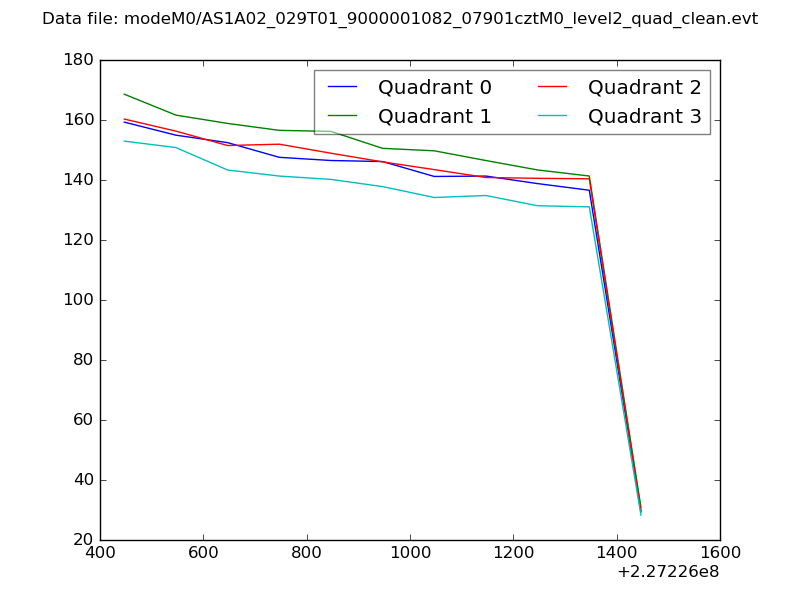 |
|
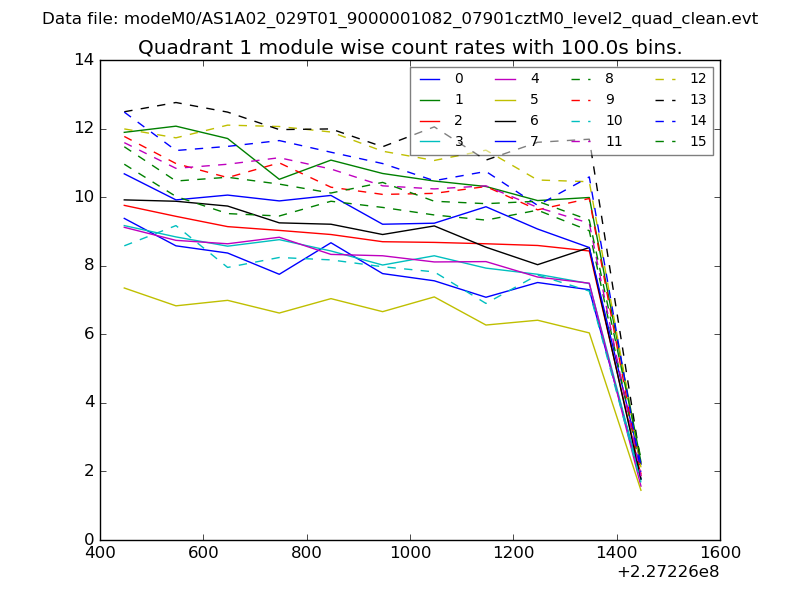
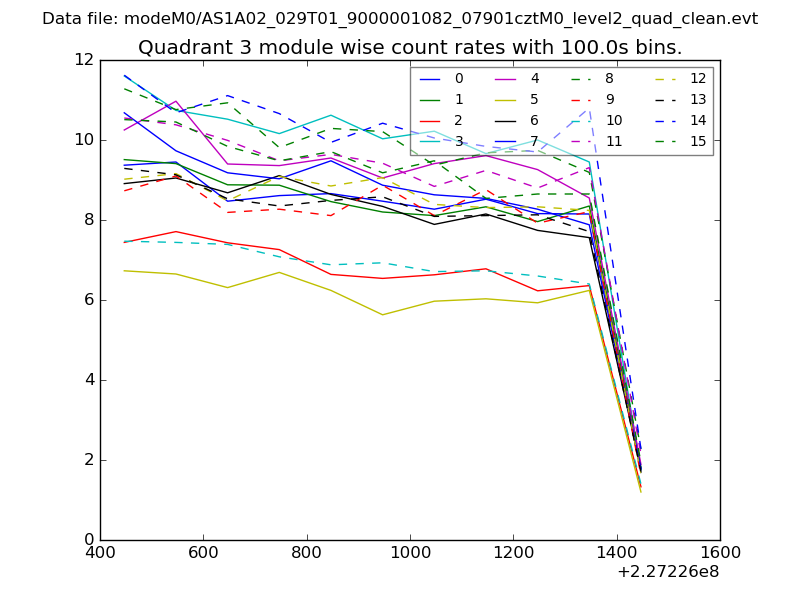
| Module-wise count rates for Quadrant A Data is divided into 100 sec bins |
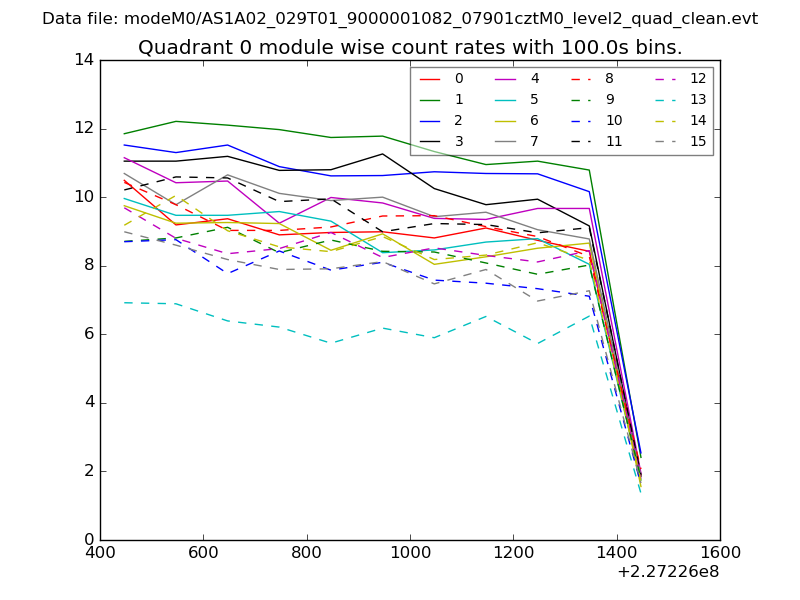 |
 |
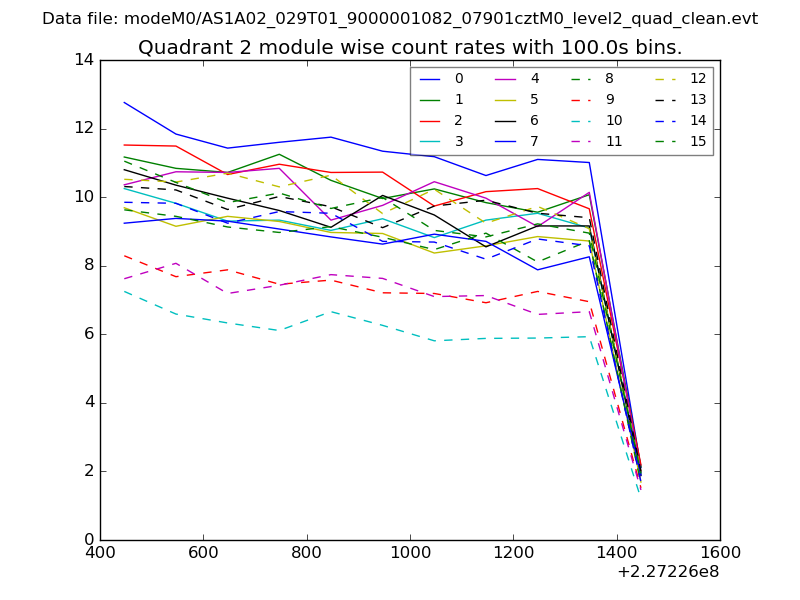
| Module-wise count rates for Quadrant B Data is divided into 100 sec bins |
 |
 |
| Module-wise count rates for Quadrant C Data is divided into 100 sec bins |
 |
 |
| Module-wise count rates for Quadrant D Data is divided into 100 sec bins |
 |
 |
| Parameter | Plot |
|---|---|
| CZT HV Monitor | 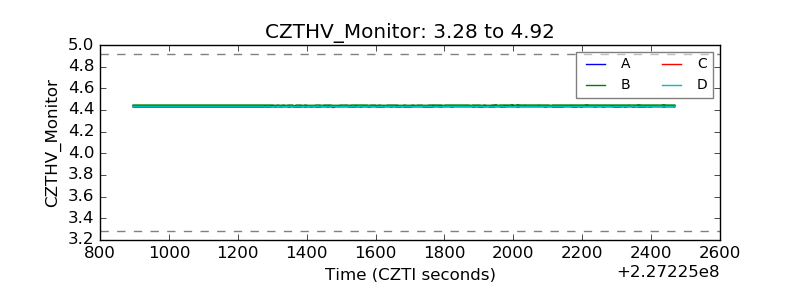 |
| D_VDD | 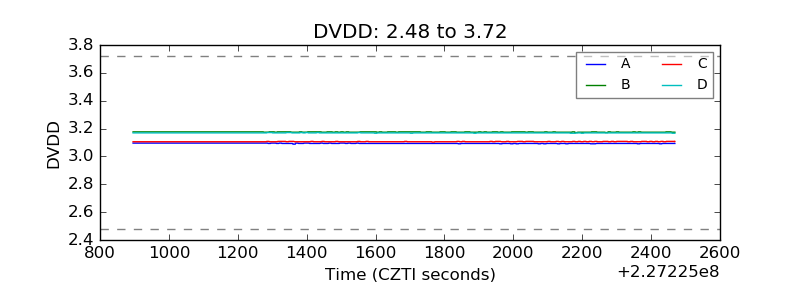 |
| Temperature 1 | 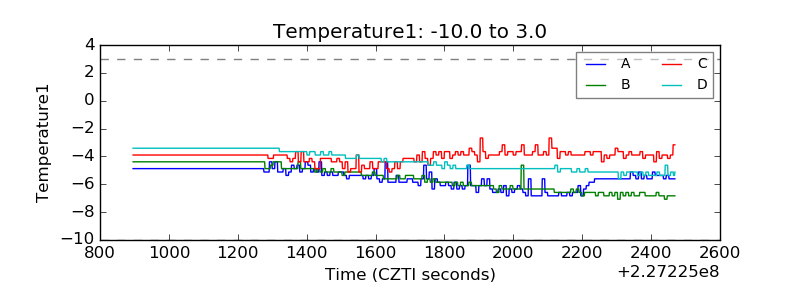 |
| Veto HV Monitor |  |
| Veto LLD | 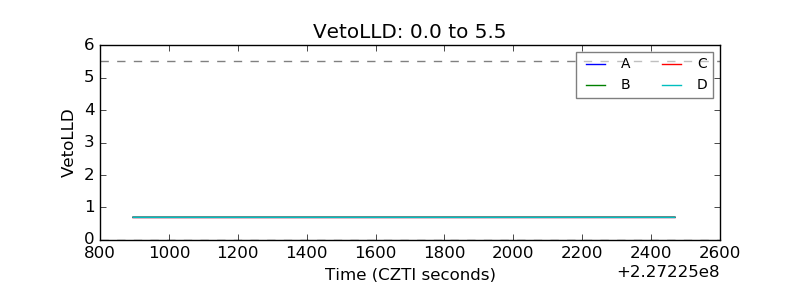 |
| Alpha Counter | 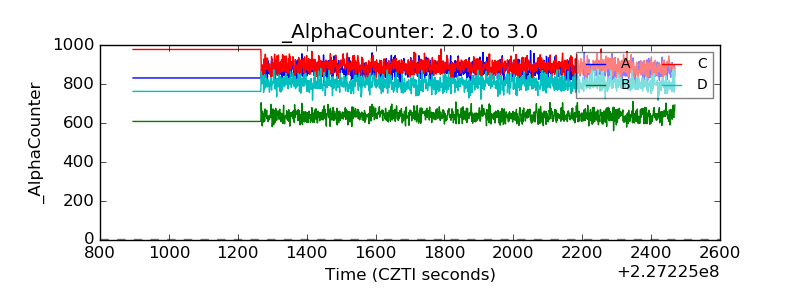 |
| _CPM_Rate | 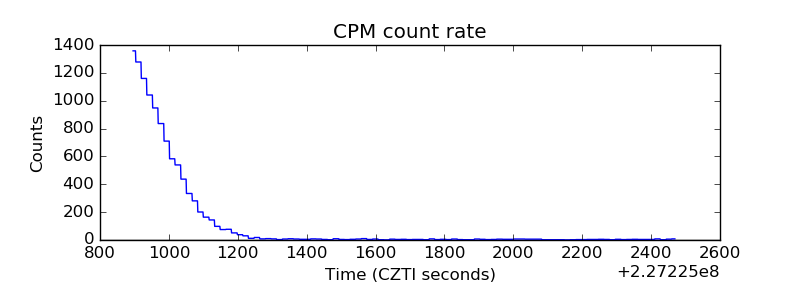 |
| CZT Counter | 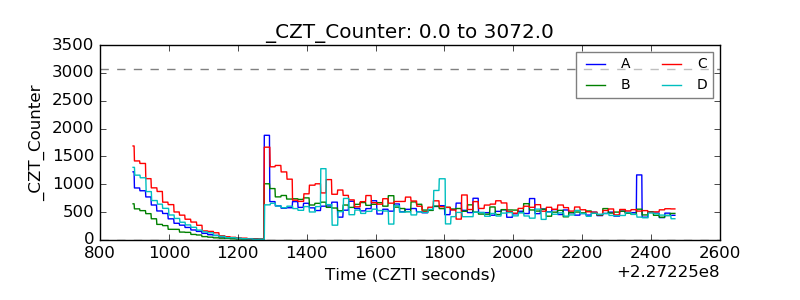 |
| +2.5 Volts monitor |  |
| +5 Volts monitor |  |
| _ROLL_ROT | 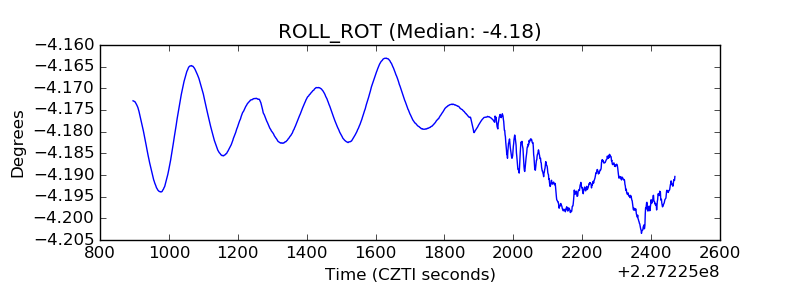 |
| _Roll_DEC |  |
| _Roll_RA | 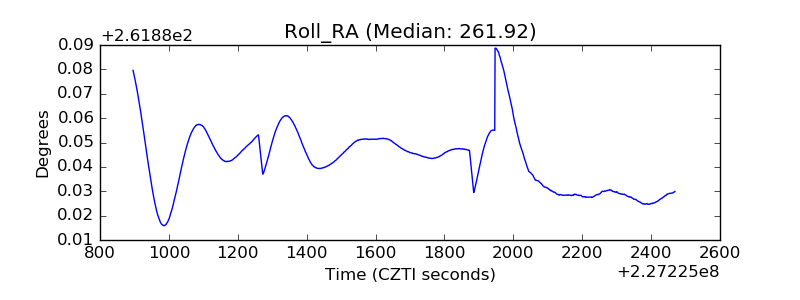 |
| Veto Counter | 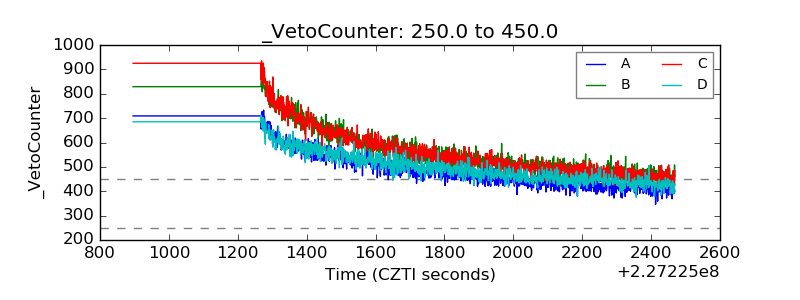 |