| Param | Original file | Final file |
|---|---|---|
| Filename | modeM0/AS1A02_029T01_9000001082_07902cztM0_level2.evt | modeM0/AS1A02_029T01_9000001082_07902cztM0_level2_quad_clean.evt |
| Size (bytes) | 447,569,280 | 102,519,360 |
| Size | 426.8 MB | 97.8 MB |
| Events in quadrant A | 3,025,321 | 670,304 |
| Events in quadrant B | 3,150,294 | 696,932 |
| Events in quadrant C | 3,826,604 | 672,441 |
| Events in quadrant D | 3,136,022 | 637,253 |
| Mode M0 | |||
|---|---|---|---|
| Quadrant | BADHDUFLAG | Total packets | Discarded packets |
| A | 0 | 12917 | 3 |
| B | 0 | 13355 | 2 |
| C | 0 | 15426 | 2 |
| D | 0 | 13418 | 2 |
| Mode SS | |||
|---|---|---|---|
| Quadrant | BADHDUFLAG | Total packets | Discarded packets |
| A | 0 | 124 | 0 |
| B | 0 | 124 | 0 |
| C | 0 | 124 | 0 |
| D | 0 | 124 | 0 |
| Mode M9 | |||
|---|---|---|---|
| Quadrant | BADHDUFLAG | Total packets | Discarded packets |
| A | 0 | 16 | 0 |
| B | 0 | 16 | 0 |
| C | 0 | 16 | 0 |
| D | 0 | 17 | 0 |
| Quadrant | Total seconds | Saturated seconds | Saturation percentage |
|---|---|---|---|
| A | 6132 | 48 | 0.782779% |
| B | 6132 | 56 | 0.913242% |
| C | 6132 | 95 | 1.549250% |
| D | 6132 | 53 | 0.864318% |
Noise dominated data is calculated using 1-second bins in cleaned event files. If a bin has >2000 counts, and if more than 50% of those come from <1% of pixels, then it is considered to be noise-dominated and hence unusable.
| Quadrant | # 1 sec bins | Bins with >0 counts | Bins with >2000 counts | High rate bins dominated by noise | Noise dominated (total time) | Noise dominated (detector-on time) | Marked lightcurve |
|---|---|---|---|---|---|---|---|
| A | 7452 | 6133 | 9 | 9 | 0.12% | 0.15% | 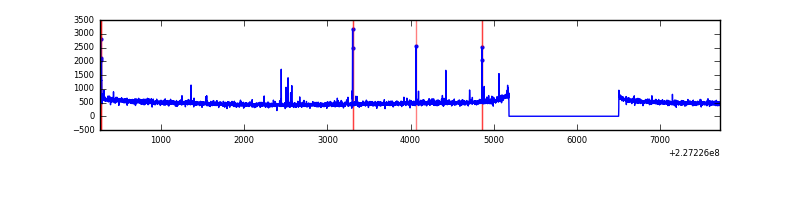 |
| B | 7452 | 6133 | 1 | 1 | 0.01% | 0.02% | 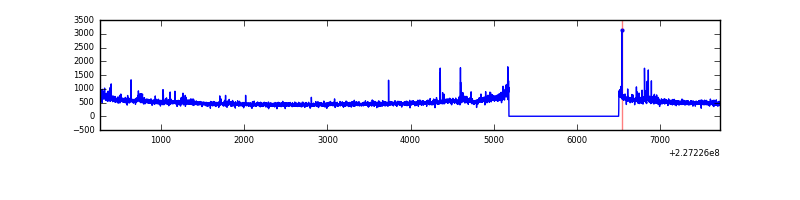 |
| C | 7452 | 6133 | 42 | 42 | 0.56% | 0.68% | 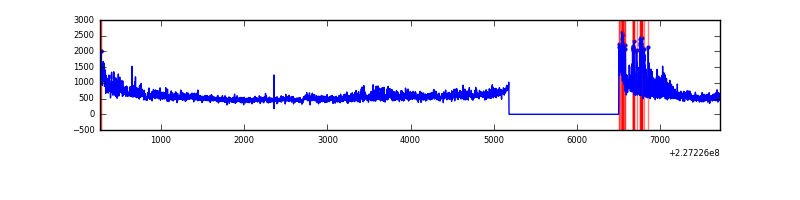 |
| D | 7452 | 6133 | 37 | 37 | 0.50% | 0.60% | 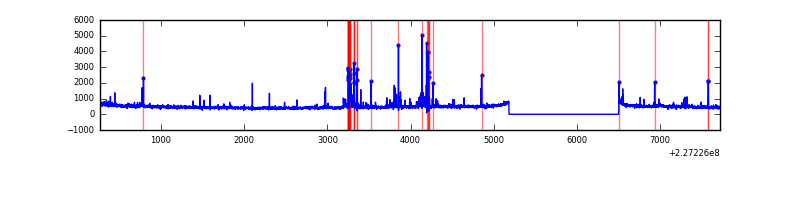 |
Top three noisy pixels from each quadrant. If the there are fewer than three noisy pixels in the level2.evt file, extra rows are filled as -1
| Pixel properties | Quadrant properties | ||||||
|---|---|---|---|---|---|---|---|
| Quadrant | DetID | PixID | Counts | Sigma | Mean | Median | Sigma |
| A | 0 | 128 | 26792 | 169.66 | 758 | 742 | 153.5 |
| A | 0 | 52 | 19555 | 122.53 | 758 | 742 | 153.5 |
| A | 3 | 1 | 16792 | 104.53 | 758 | 742 | 153.5 |
| B | 4 | 173 | 40050 | 270.26 | 775 | 757 | 145.4 |
| B | 0 | 219 | 32715 | 219.81 | 775 | 757 | 145.4 |
| B | 4 | 239 | 26810 | 179.19 | 775 | 757 | 145.4 |
| C | 1 | 16 | 899516 | 5224.08 | 749 | 754 | 172.0 |
| C | 13 | 61 | 5869 | 29.73 | 749 | 754 | 172.0 |
| C | 12 | 4 | 3062 | 13.42 | 749 | 754 | 172.0 |
| D | 1 | 52 | 221014 | 1230.71 | 737 | 715 | 179.0 |
| D | 2 | 14 | 21799 | 117.78 | 737 | 715 | 179.0 |
| D | 12 | 233 | 21296 | 114.97 | 737 | 715 | 179.0 |
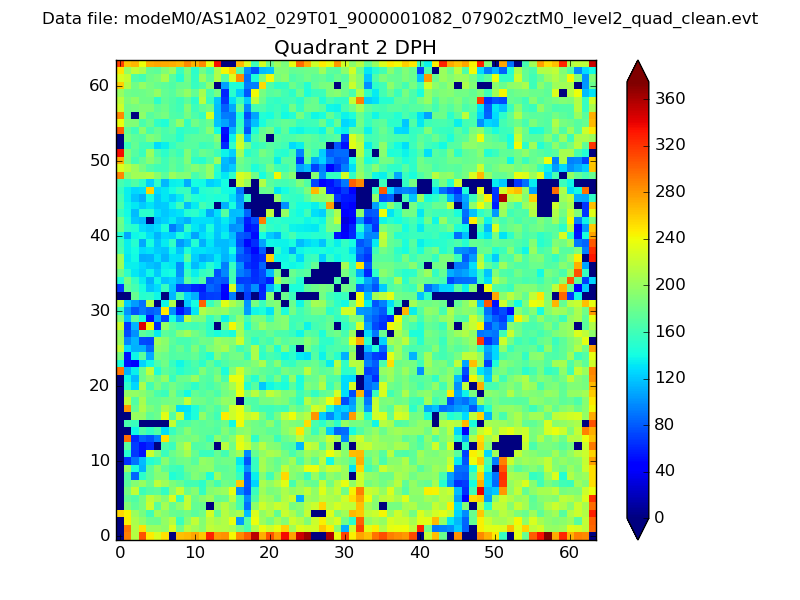
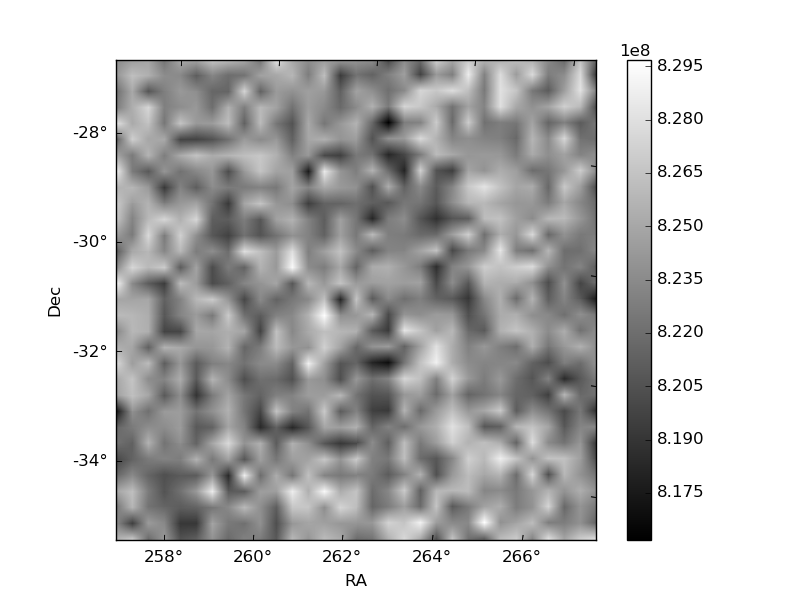
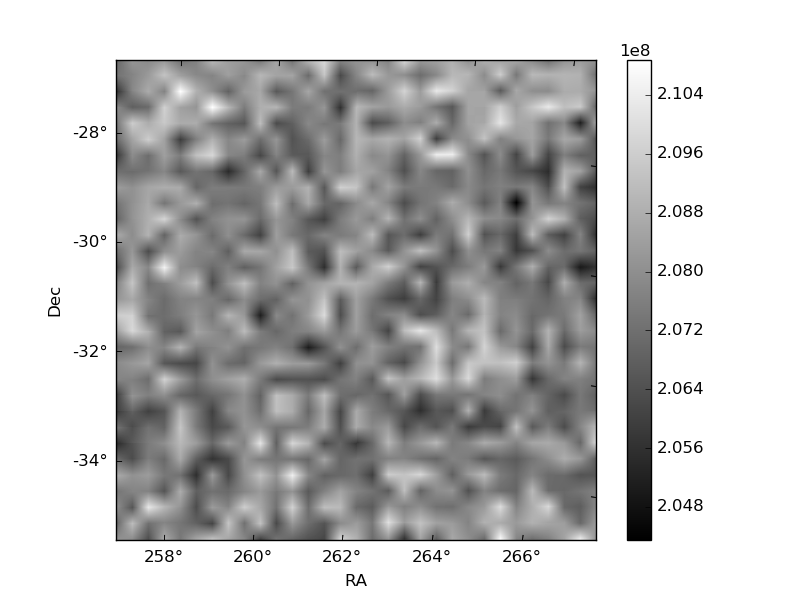
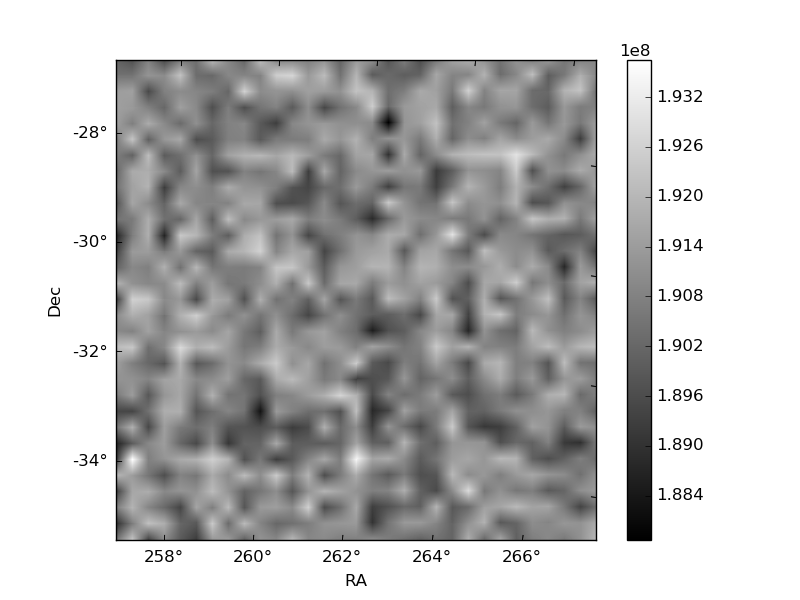
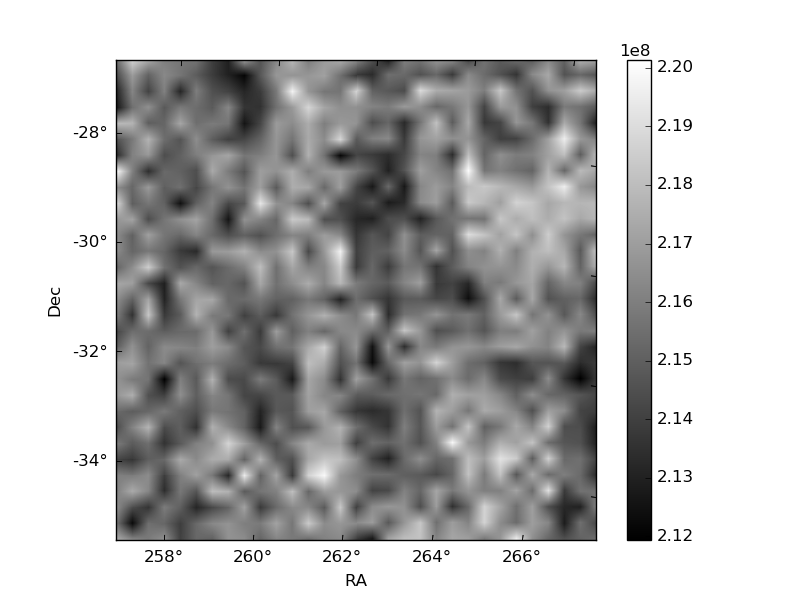
Histogram calculated using DETX and DETY for each event in the final _common_clean file
| Quadrant A | 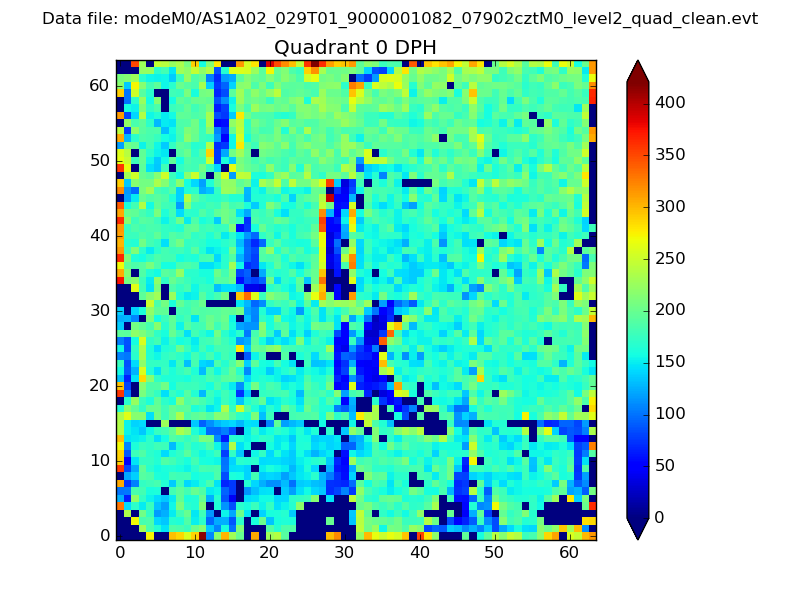 |
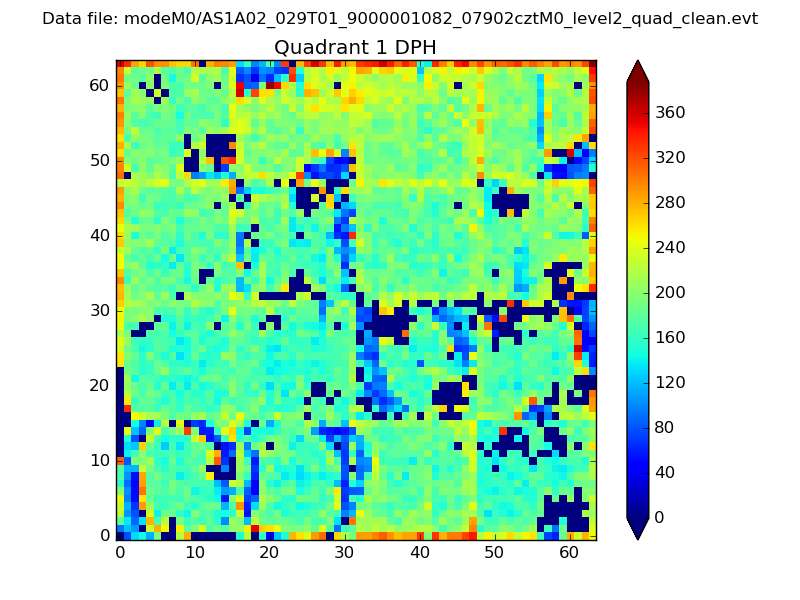 |
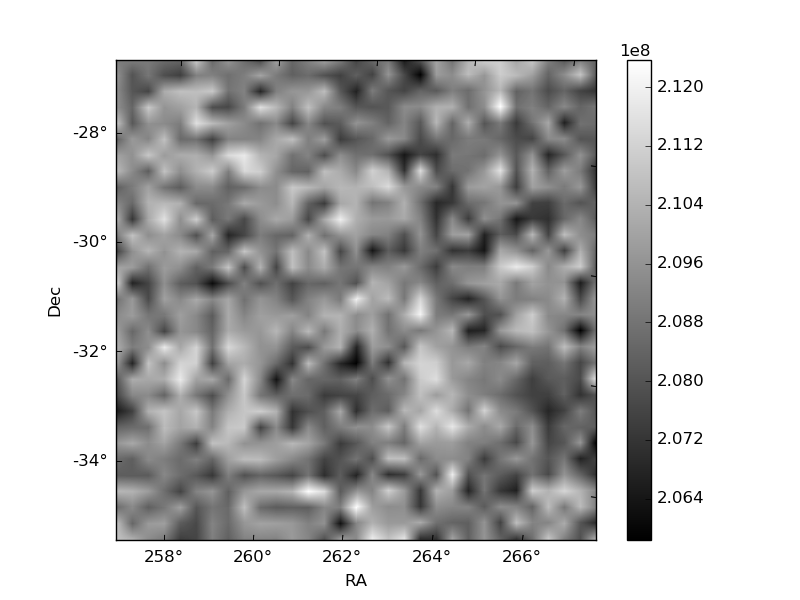
Quadrant B |
|---|---|---|---|
| Quadrant D | 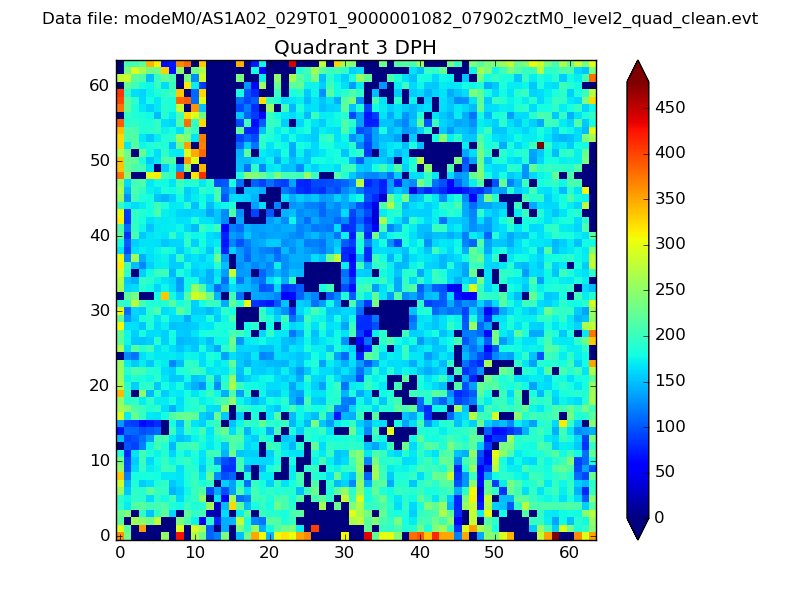 |
 |
Quadrant C |
| Plot type | Count rate plots | Images |
|---|---|---|
| Comparison with Poisson distribution Blue bars denote a histogram of data divided into 1 sec bins. Red curve is a Poisson curve with rate = median count rate of data. |
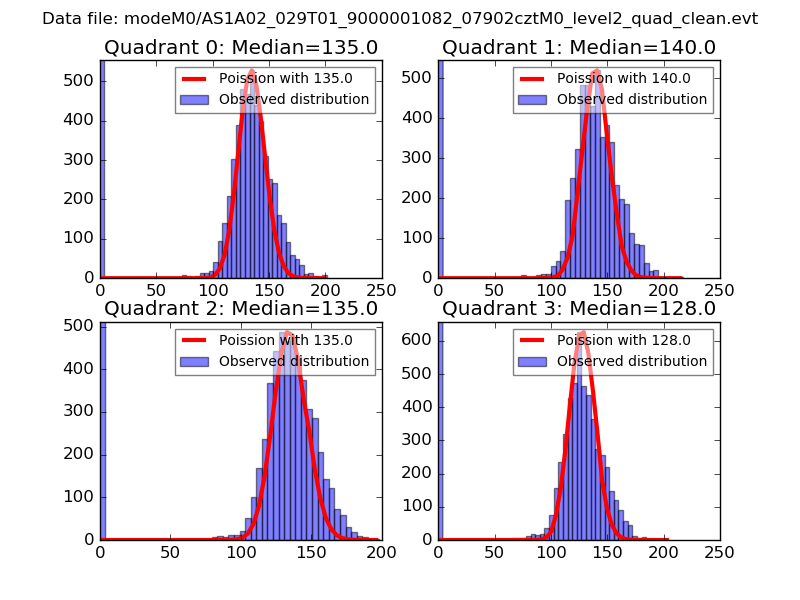 |
 |
| Quadrant-wise count rates Data is divided into 100 sec bins |
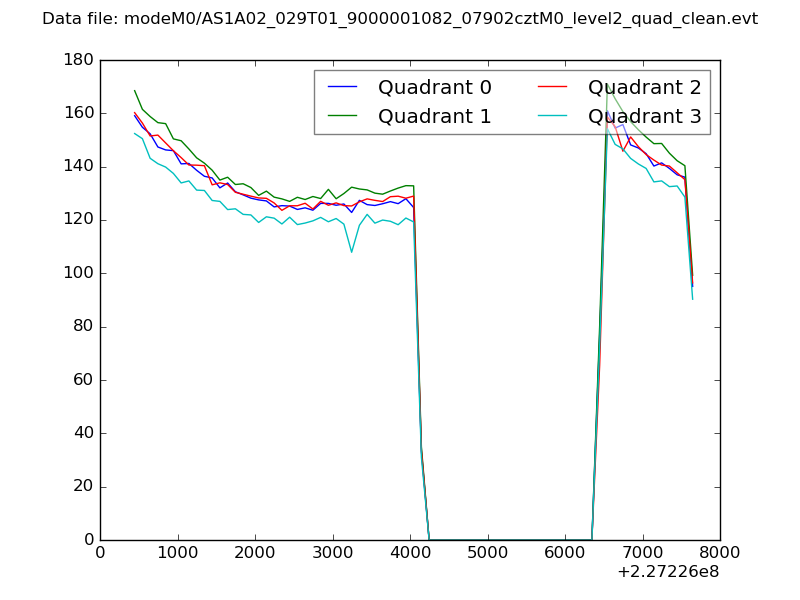 |
|
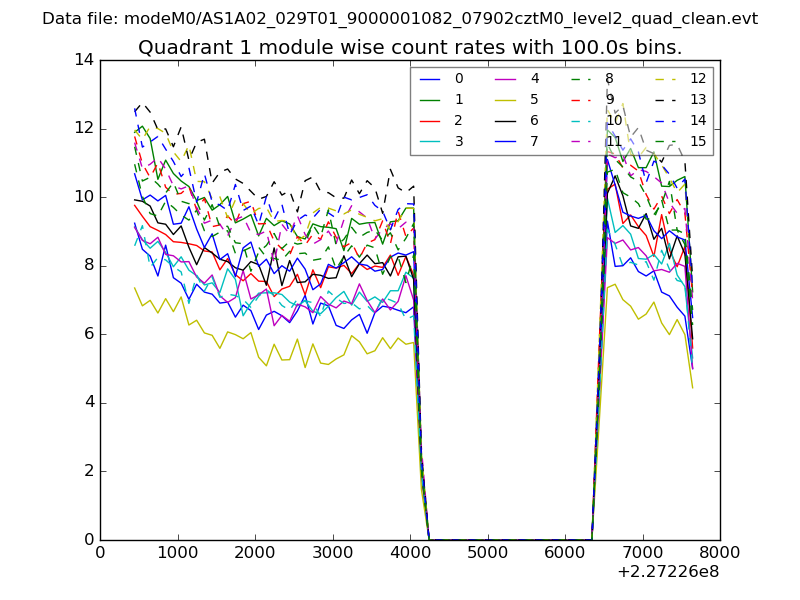
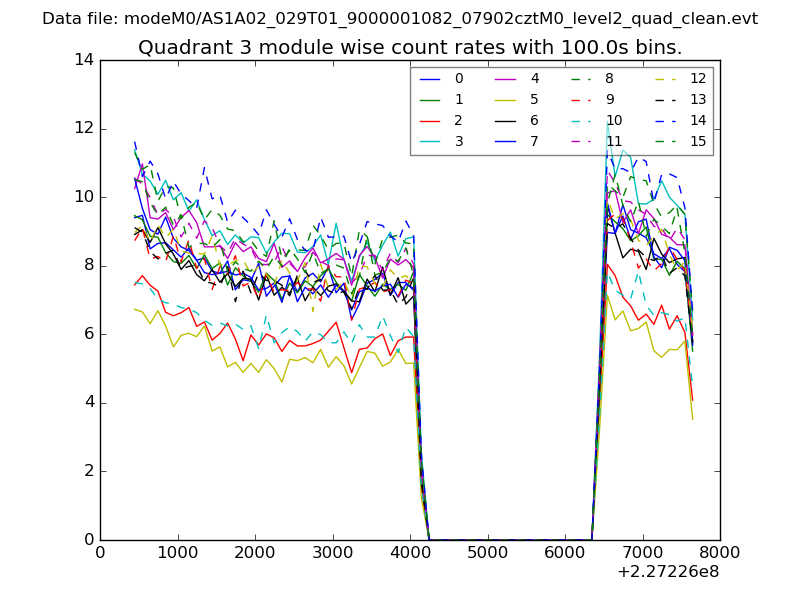
| Module-wise count rates for Quadrant A Data is divided into 100 sec bins |
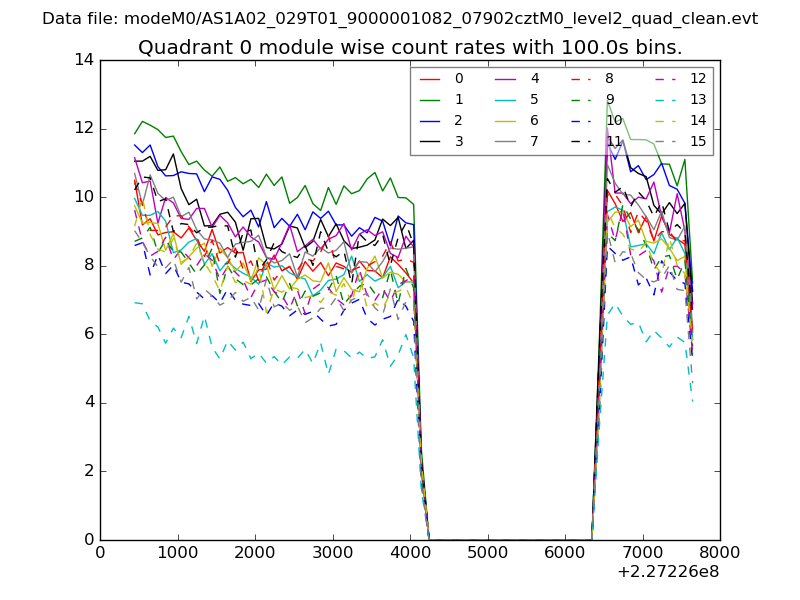 |
 |
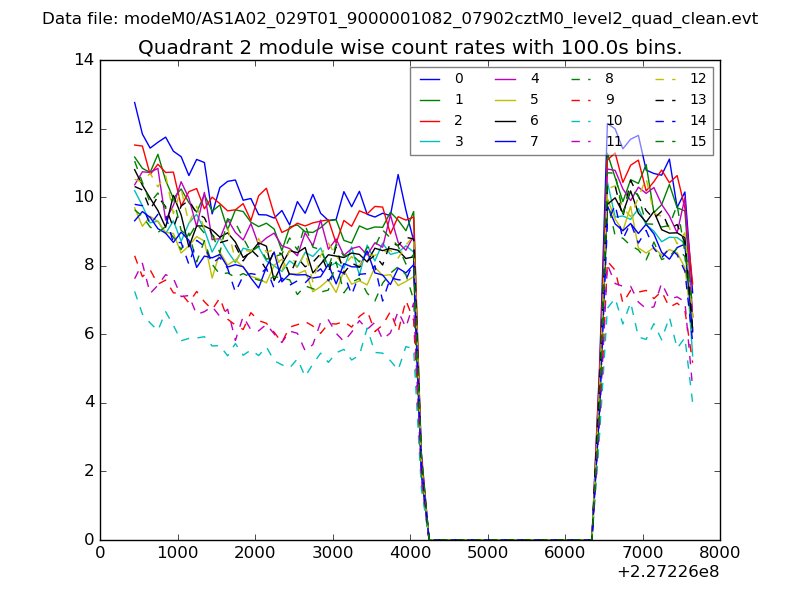
| Module-wise count rates for Quadrant B Data is divided into 100 sec bins |
 |
 |
| Module-wise count rates for Quadrant C Data is divided into 100 sec bins |
 |
 |
| Module-wise count rates for Quadrant D Data is divided into 100 sec bins |
 |
 |
| Parameter | Plot |
|---|---|
| CZT HV Monitor | 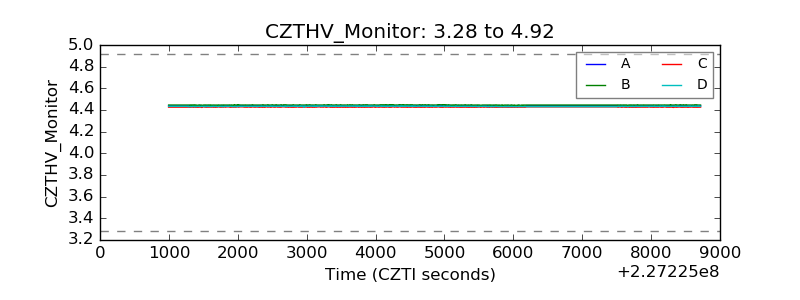 |
| D_VDD | 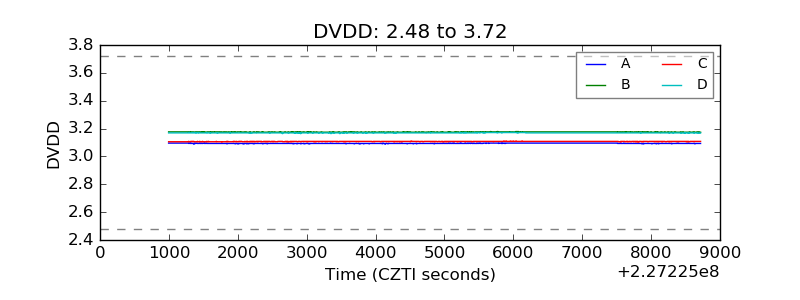 |
| Temperature 1 |  |
| Veto HV Monitor | 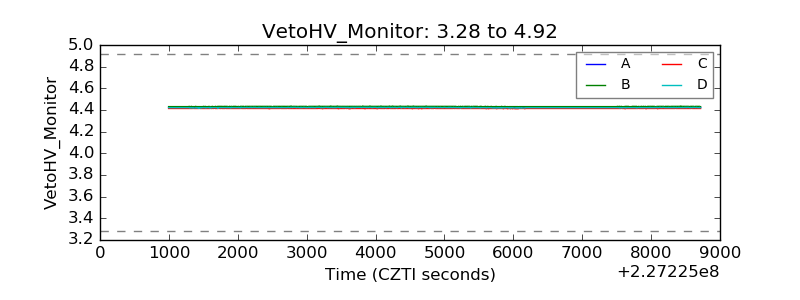 |
| Veto LLD | 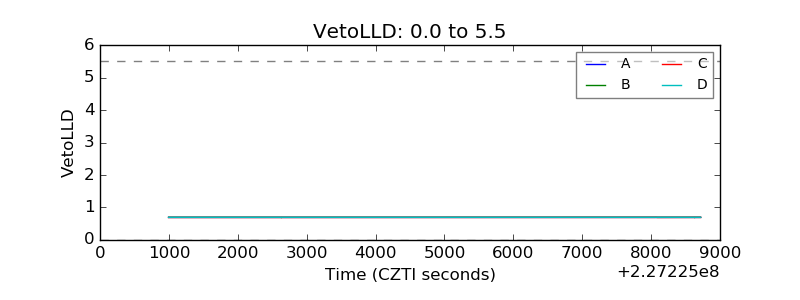 |
| Alpha Counter | 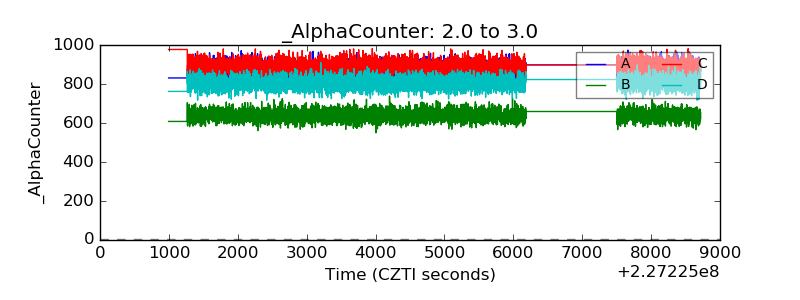 |
| _CPM_Rate | 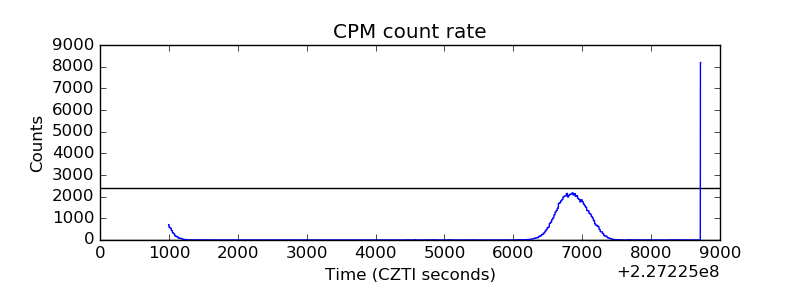 |
| CZT Counter | 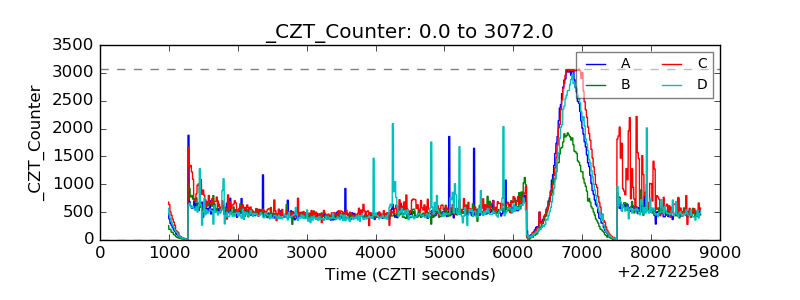 |
| +2.5 Volts monitor |  |
| +5 Volts monitor |  |
| _ROLL_ROT | 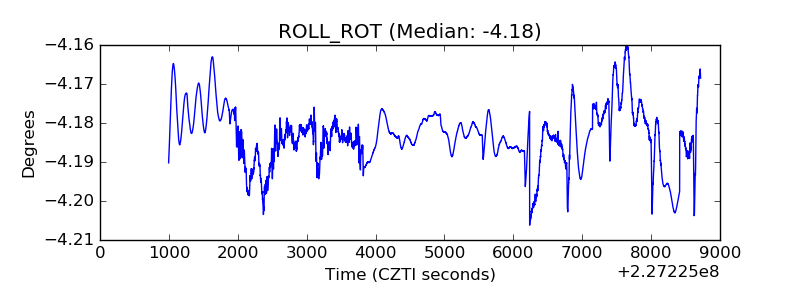 |
| _Roll_DEC | 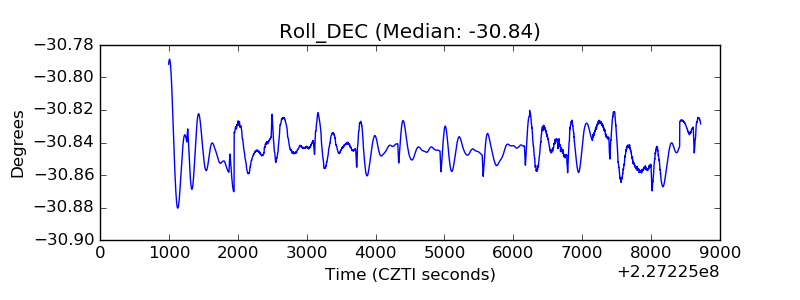 |
| _Roll_RA | 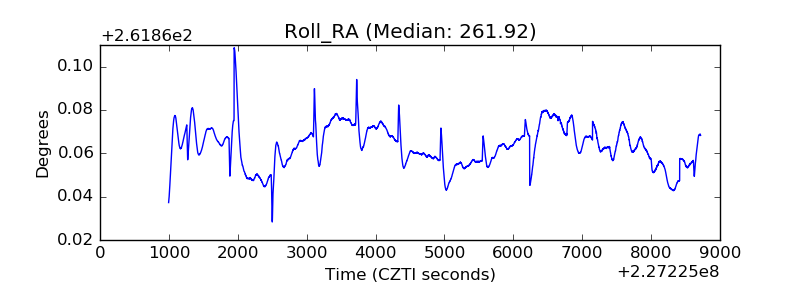 |
| Veto Counter | 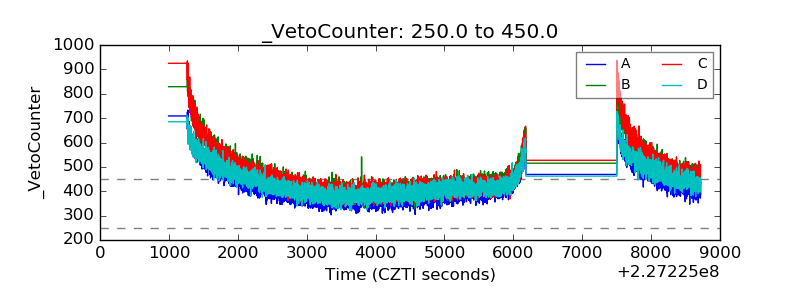 |