| Param | Original file | Final file |
|---|---|---|
| Filename | modeM0/AS1A02_029T01_9000001082_07904cztM0_level2.evt | modeM0/AS1A02_029T01_9000001082_07904cztM0_level2_quad_clean.evt |
| Size (bytes) | 481,645,440 | 96,122,880 |
| Size | 459.3 MB | 91.7 MB |
| Events in quadrant A | 3,185,043 | 609,543 |
| Events in quadrant B | 3,287,827 | 632,856 |
| Events in quadrant C | 4,349,356 | 612,321 |
| Events in quadrant D | 3,307,235 | 587,030 |
| Mode M0 | |||
|---|---|---|---|
| Quadrant | BADHDUFLAG | Total packets | Discarded packets |
| A | 0 | 14010 | 3 |
| B | 0 | 14248 | 2 |
| C | 0 | 17361 | 2 |
| D | 0 | 14524 | 2 |
| Mode SS | |||
|---|---|---|---|
| Quadrant | BADHDUFLAG | Total packets | Discarded packets |
| A | 0 | 138 | 0 |
| B | 0 | 138 | 0 |
| C | 0 | 138 | 0 |
| D | 0 | 138 | 0 |
| Mode M9 | |||
|---|---|---|---|
| Quadrant | BADHDUFLAG | Total packets | Discarded packets |
| A | 0 | 14 | 0 |
| B | 0 | 14 | 0 |
| C | 0 | 14 | 0 |
| D | 0 | 15 | 0 |
| Quadrant | Total seconds | Saturated seconds | Saturation percentage |
|---|---|---|---|
| A | 6727 | 21 | 0.312175% |
| B | 6727 | 50 | 0.743273% |
| C | 6727 | 123 | 1.828453% |
| D | 6727 | 41 | 0.609484% |
Noise dominated data is calculated using 1-second bins in cleaned event files. If a bin has >2000 counts, and if more than 50% of those come from <1% of pixels, then it is considered to be noise-dominated and hence unusable.
| Quadrant | # 1 sec bins | Bins with >0 counts | Bins with >2000 counts | High rate bins dominated by noise | Noise dominated (total time) | Noise dominated (detector-on time) | Marked lightcurve |
|---|---|---|---|---|---|---|---|
| A | 7902 | 6728 | 0 | 0 | 0.00% | 0.00% | 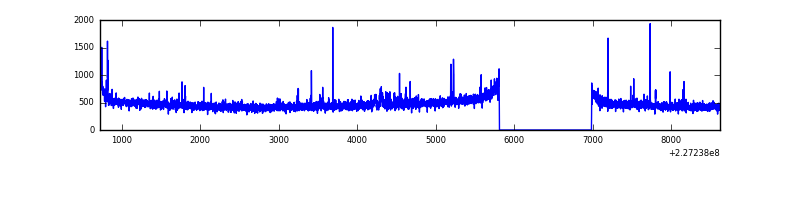 |
| B | 7902 | 6728 | 17 | 17 | 0.22% | 0.25% | 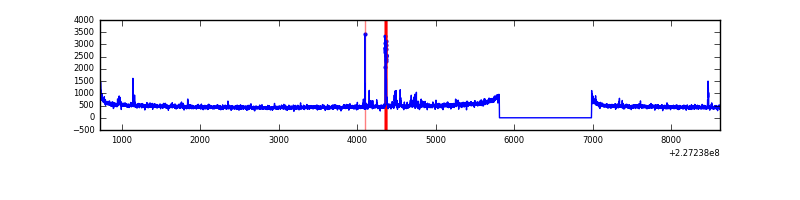 |
| C | 7902 | 6728 | 34 | 34 | 0.43% | 0.51% | 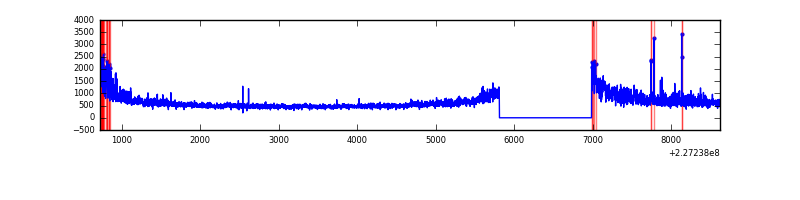 |
| D | 7902 | 6728 | 18 | 18 | 0.23% | 0.27% | 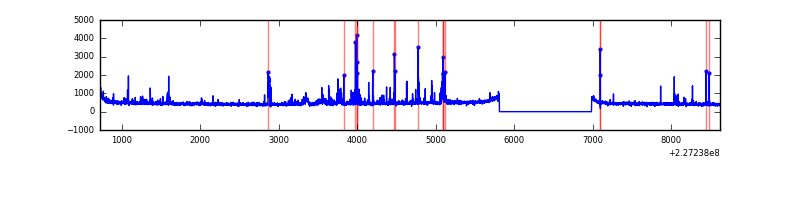 |
Top three noisy pixels from each quadrant. If the there are fewer than three noisy pixels in the level2.evt file, extra rows are filled as -1
| Pixel properties | Quadrant properties | ||||||
|---|---|---|---|---|---|---|---|
| Quadrant | DetID | PixID | Counts | Sigma | Mean | Median | Sigma |
| A | 0 | 128 | 37233 | 223.54 | 801 | 783 | 163.1 |
| A | 15 | 239 | 20236 | 119.3 | 801 | 783 | 163.1 |
| A | 8 | 15 | 14002 | 81.07 | 801 | 783 | 163.1 |
| B | 10 | 16 | 64209 | 413.05 | 815 | 795 | 153.5 |
| B | 4 | 173 | 31598 | 200.64 | 815 | 795 | 153.5 |
| B | 12 | 111 | 15911 | 98.46 | 815 | 795 | 153.5 |
| C | 1 | 16 | 1216852 | 6596.37 | 795 | 800 | 184.4 |
| C | 12 | 4 | 33261 | 176.08 | 795 | 800 | 184.4 |
| C | 13 | 61 | 5972 | 28.06 | 795 | 800 | 184.4 |
| D | 4 | 95 | 134883 | 701.03 | 788 | 764 | 191.3 |
| D | 1 | 52 | 93631 | 485.41 | 788 | 764 | 191.3 |
| D | 7 | 71 | 24183 | 122.41 | 788 | 764 | 191.3 |
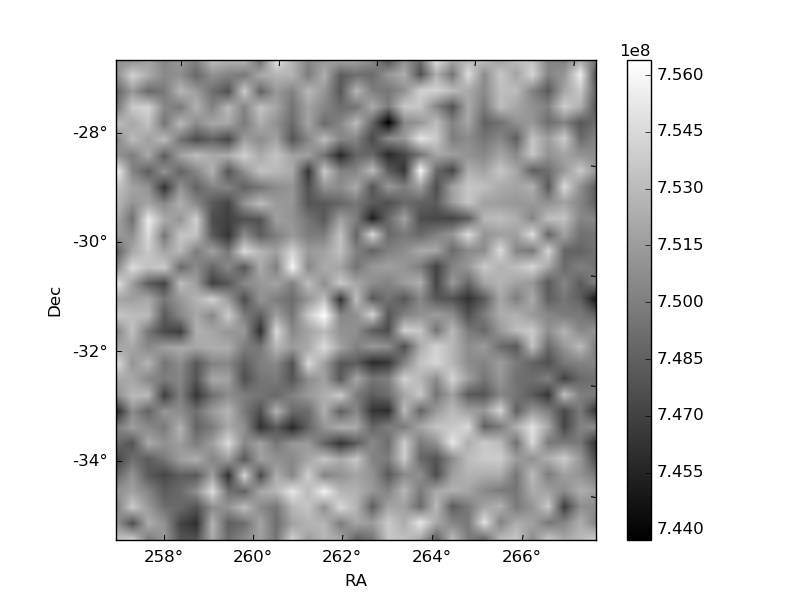
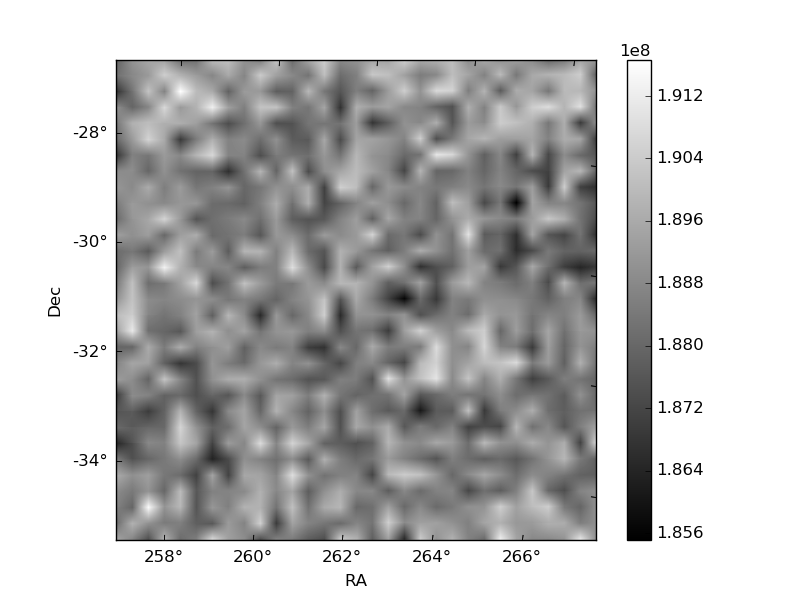
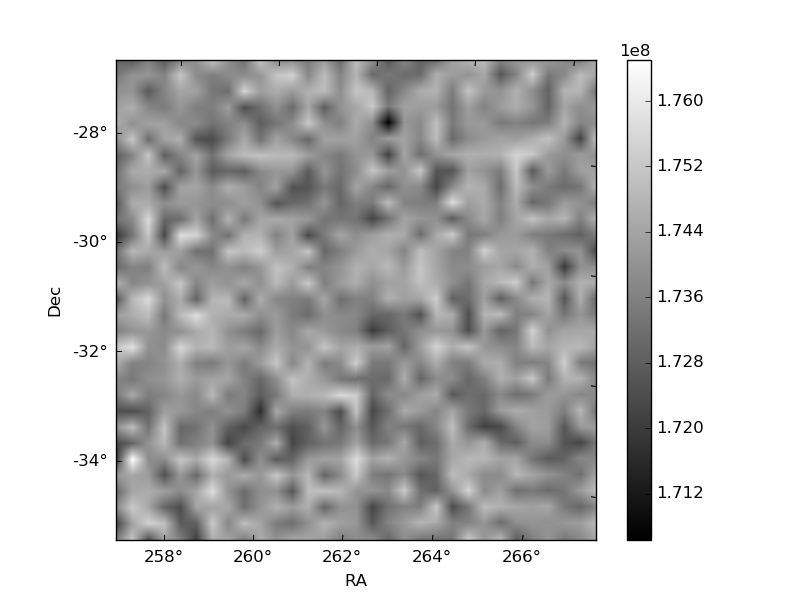
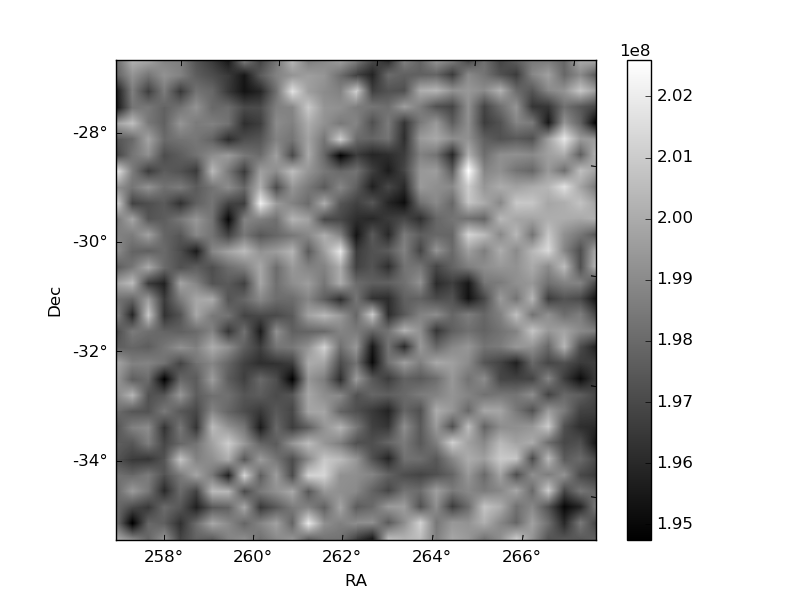
Histogram calculated using DETX and DETY for each event in the final _common_clean file
| Quadrant A | 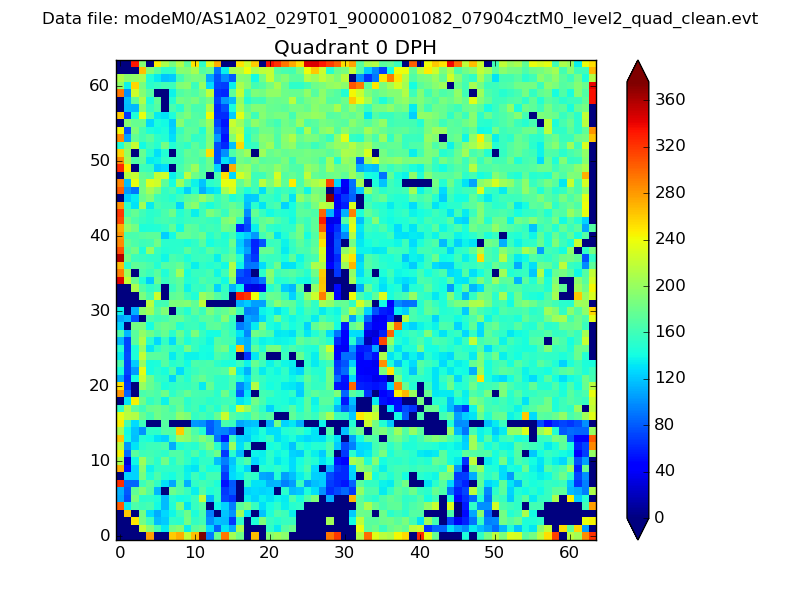 |
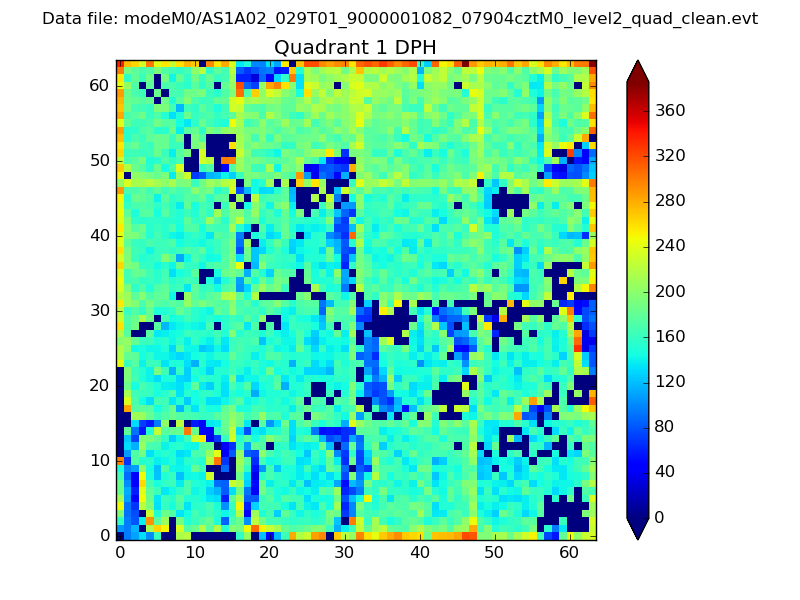 |
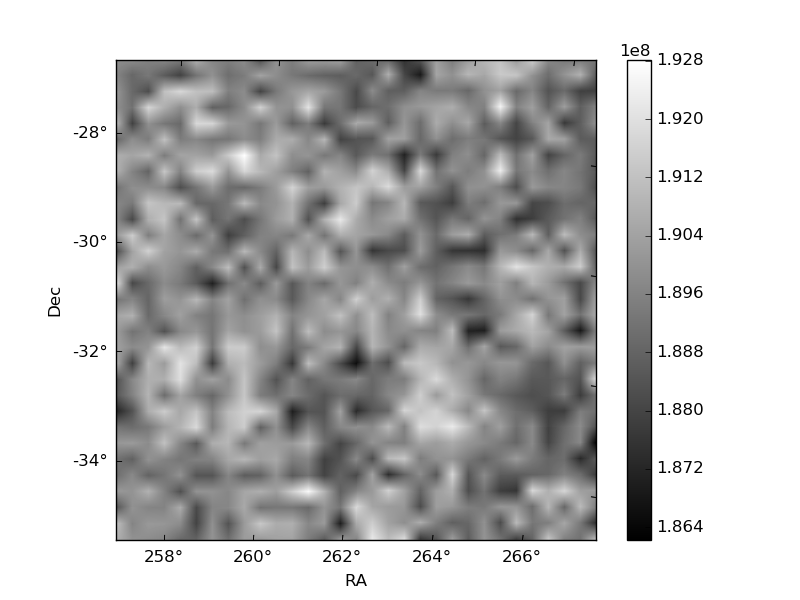
Quadrant B |
|---|---|---|---|
| Quadrant D | 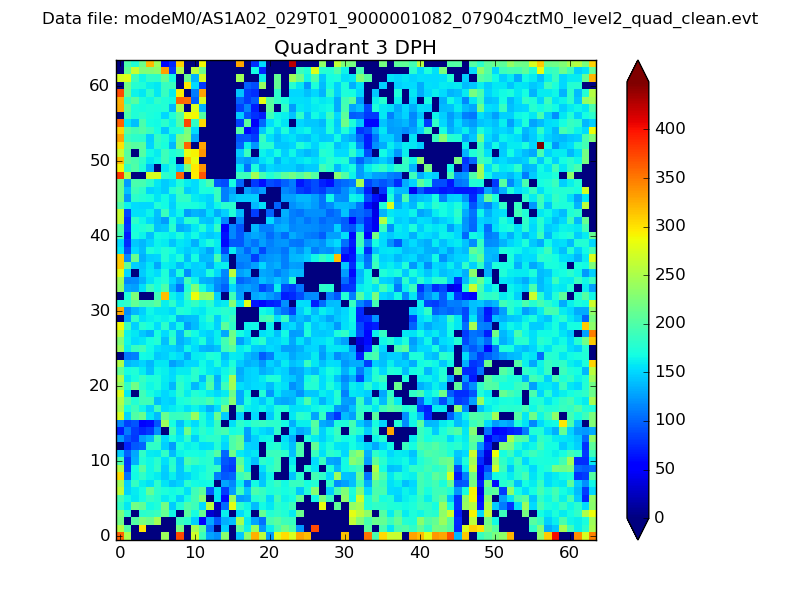 |
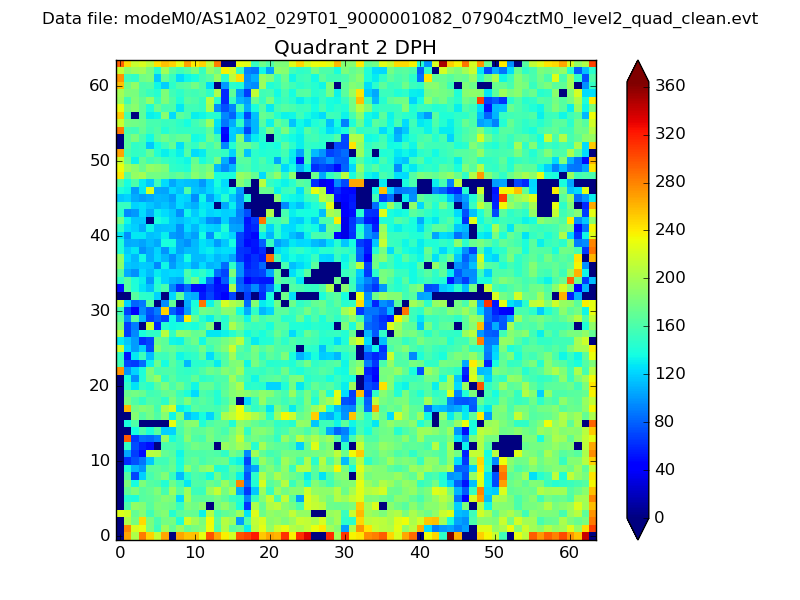 |
Quadrant C |
| Plot type | Count rate plots | Images |
|---|---|---|
| Comparison with Poisson distribution Blue bars denote a histogram of data divided into 1 sec bins. Red curve is a Poisson curve with rate = median count rate of data. |
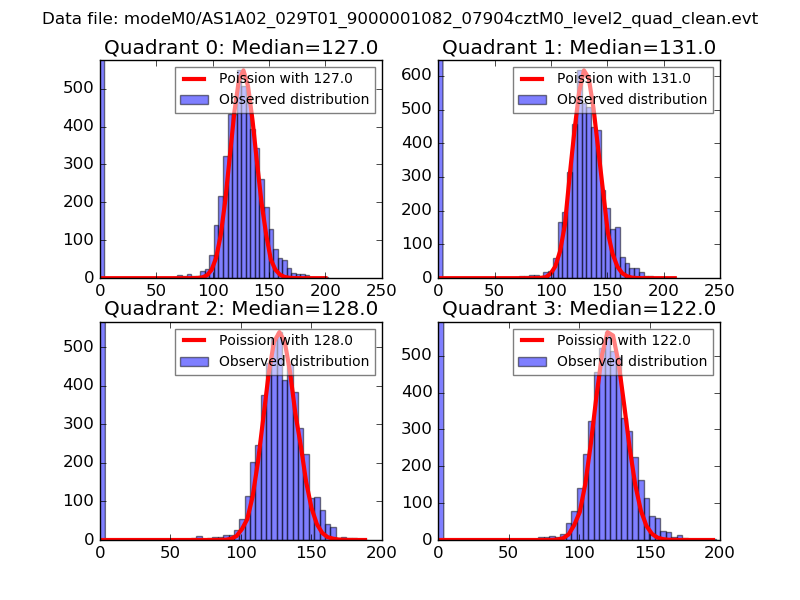 |
 |
| Quadrant-wise count rates Data is divided into 100 sec bins |
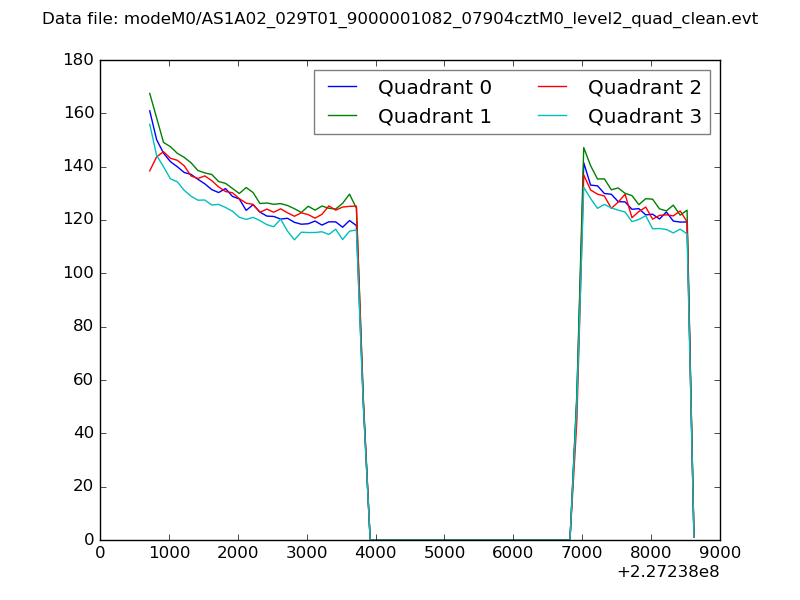 |
|
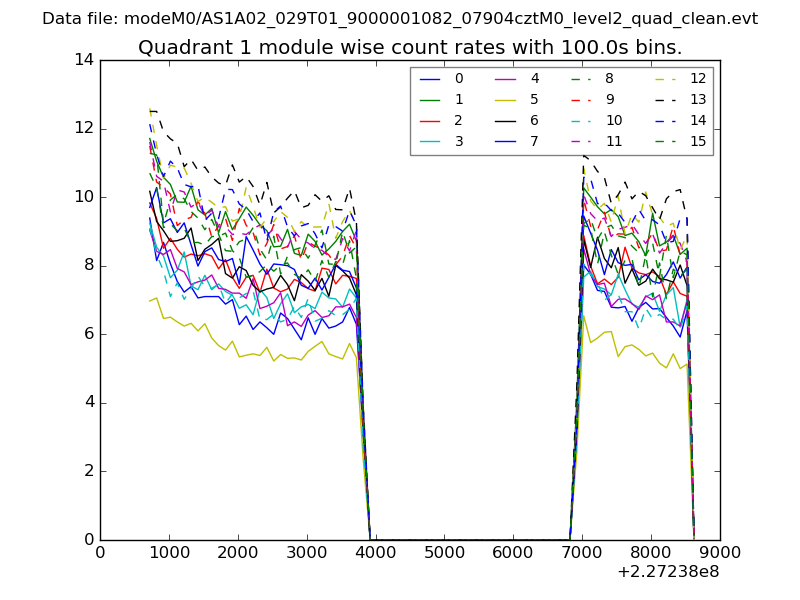
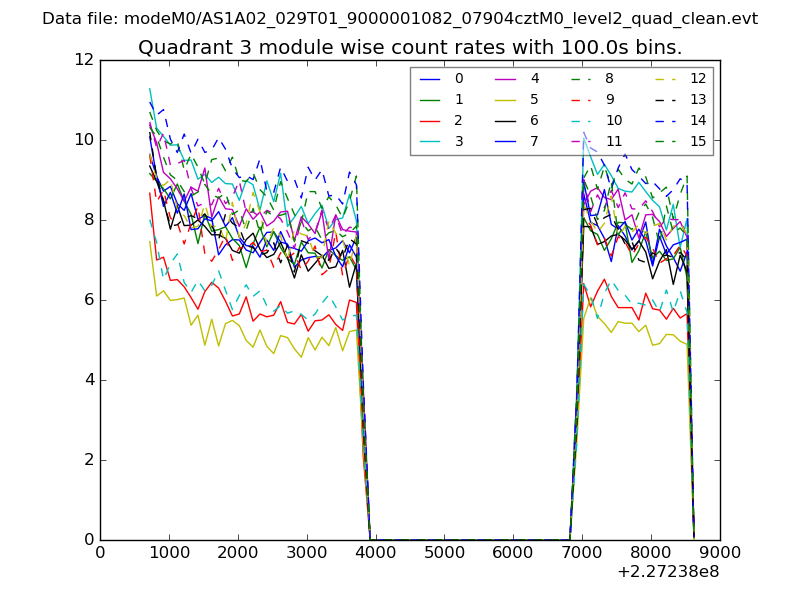
| Module-wise count rates for Quadrant A Data is divided into 100 sec bins |
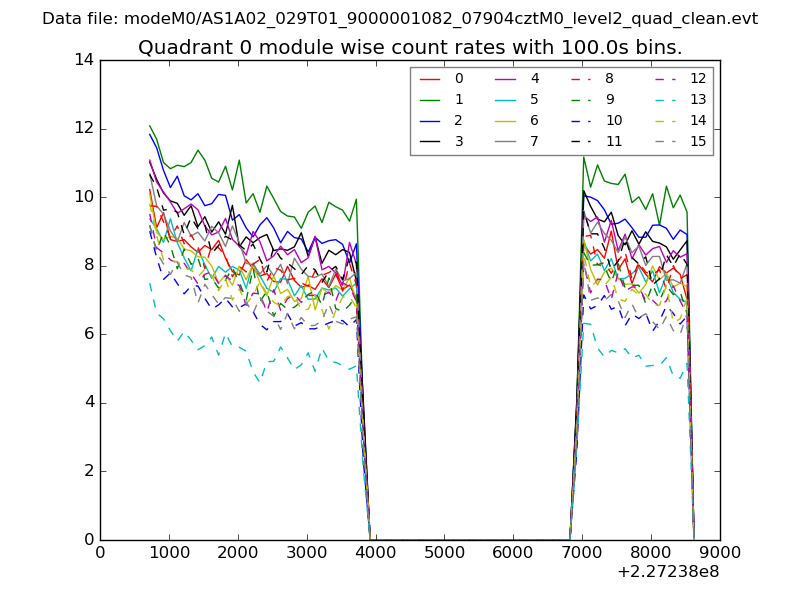 |
 |
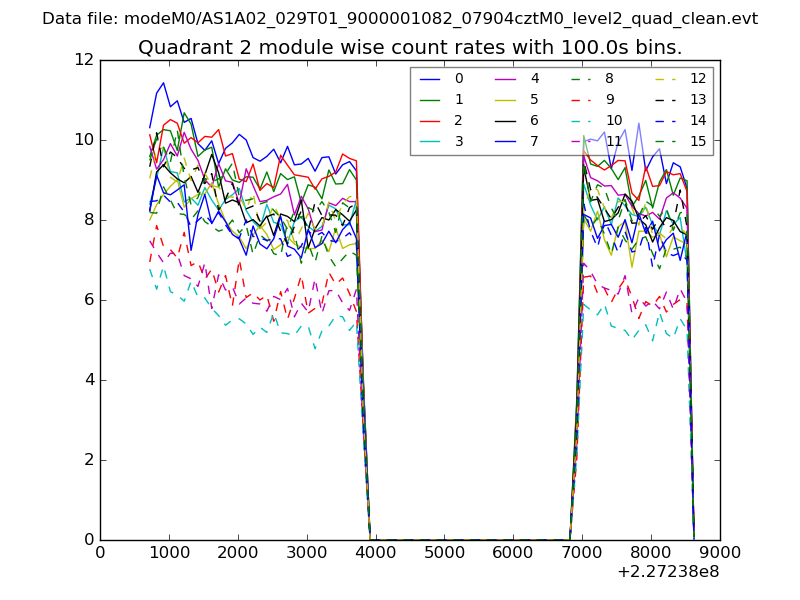
| Module-wise count rates for Quadrant B Data is divided into 100 sec bins |
 |
 |
| Module-wise count rates for Quadrant C Data is divided into 100 sec bins |
 |
 |
| Module-wise count rates for Quadrant D Data is divided into 100 sec bins |
 |
 |
| Parameter | Plot |
|---|---|
| CZT HV Monitor | 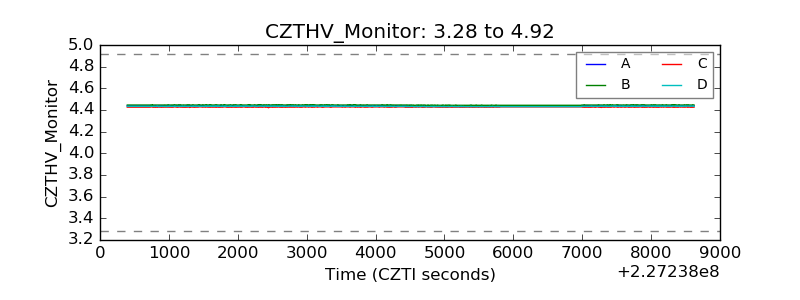 |
| D_VDD | 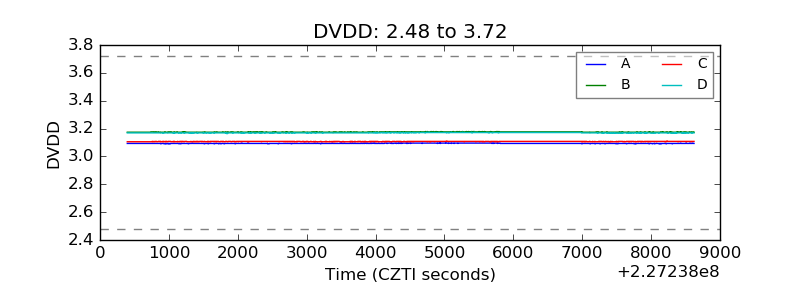 |
| Temperature 1 | 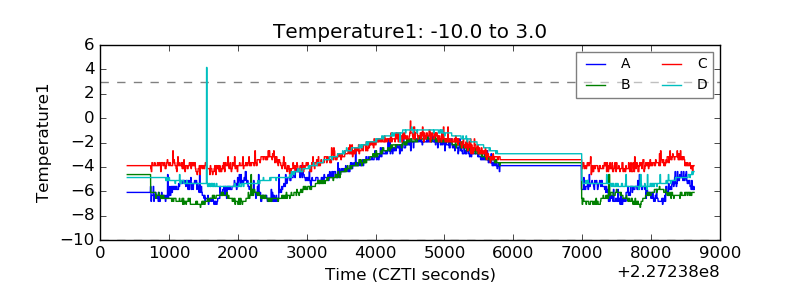 |
| Veto HV Monitor | 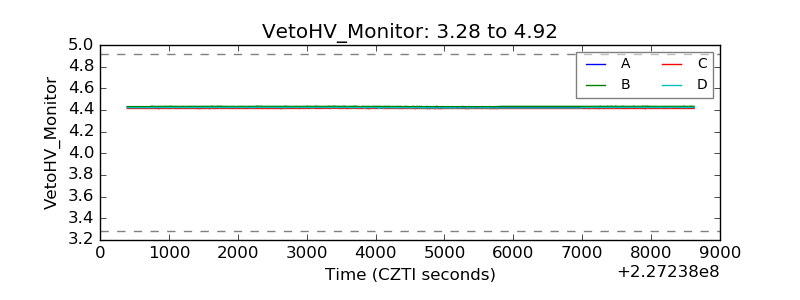 |
| Veto LLD | 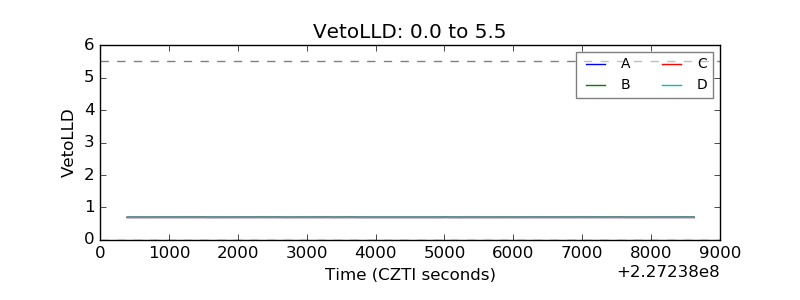 |
| Alpha Counter | 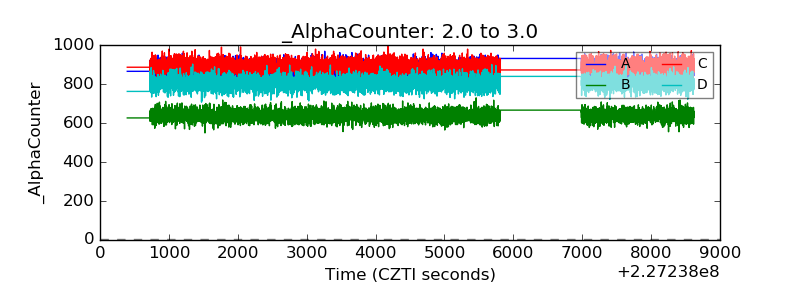 |
| _CPM_Rate | 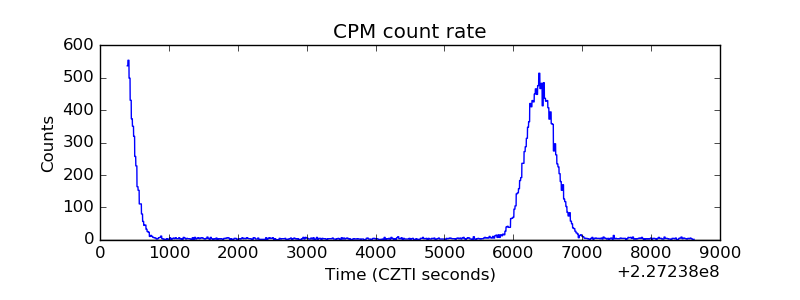 |
| CZT Counter | 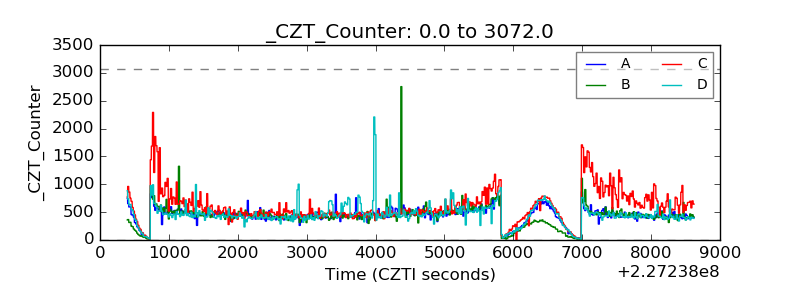 |
| +2.5 Volts monitor |  |
| +5 Volts monitor | 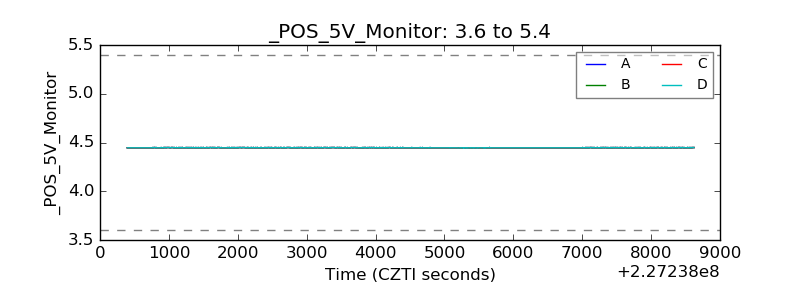 |
| _ROLL_ROT | 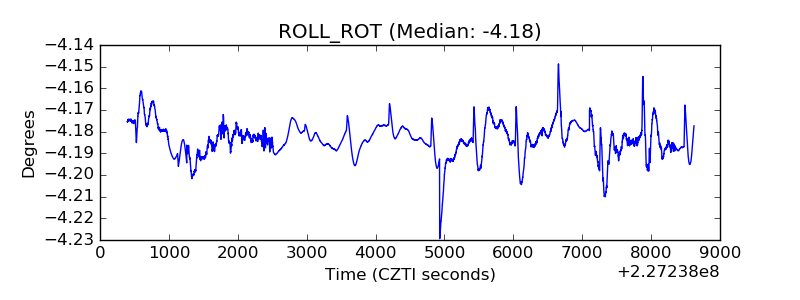 |
| _Roll_DEC | 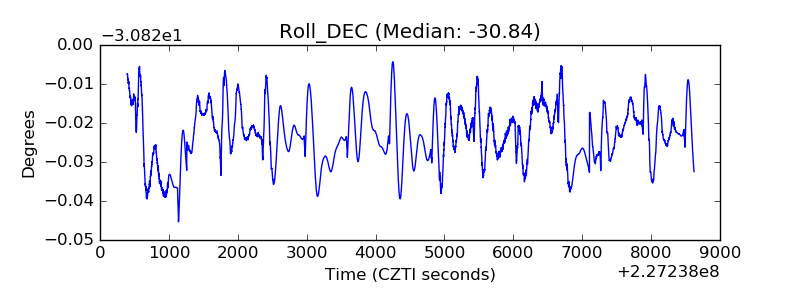 |
| _Roll_RA | 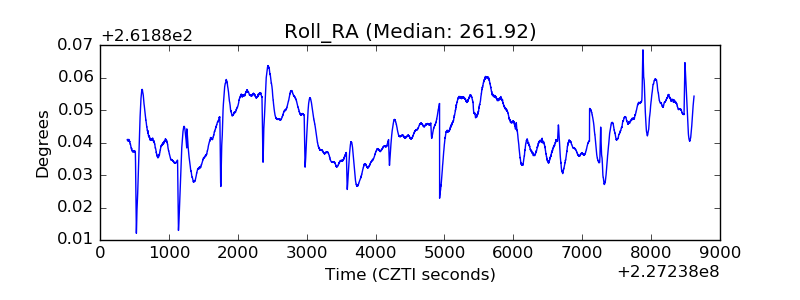 |
| Veto Counter | 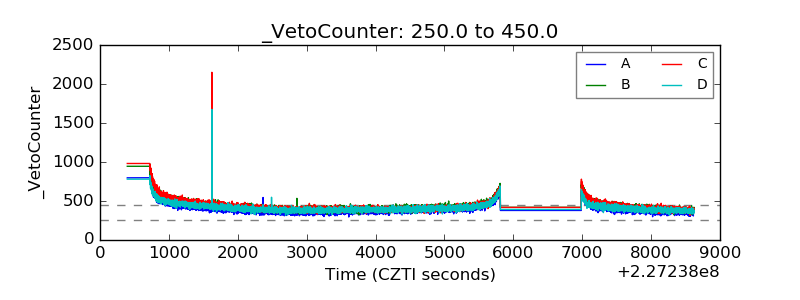 |