| Param | Original file | Final file |
|---|---|---|
| Filename | modeM0/AS1A02_029T01_9000001082_07911cztM0_level2.evt | modeM0/AS1A02_029T01_9000001082_07911cztM0_level2_quad_clean.evt |
| Size (bytes) | 2,826,325,440 | 442,944,000 |
| Size | 2.6 GB | 422.4 MB |
| Events in quadrant A | 18,520,602 | 2,721,408 |
| Events in quadrant B | 18,583,092 | 2,800,802 |
| Events in quadrant C | 24,938,433 | 2,728,373 |
| Events in quadrant D | 21,025,246 | 2,589,971 |
| Mode M0 | |||
|---|---|---|---|
| Quadrant | BADHDUFLAG | Total packets | Discarded packets |
| A | 0 | 80378 | 7 |
| B | 0 | 80117 | 15 |
| C | 0 | 100136 | 10 |
| D | 0 | 88891 | 11 |
| Mode SS | |||
|---|---|---|---|
| Quadrant | BADHDUFLAG | Total packets | Discarded packets |
| A | 0 | 762 | 0 |
| B | 0 | 762 | 0 |
| C | 0 | 762 | 0 |
| D | 0 | 762 | 0 |
| Mode M9 | |||
|---|---|---|---|
| Quadrant | BADHDUFLAG | Total packets | Discarded packets |
| A | 0 | 23 | 0 |
| B | 0 | 23 | 0 |
| C | 0 | 23 | 0 |
| D | 0 | 23 | 0 |
| Quadrant | Total seconds | Saturated seconds | Saturation percentage |
|---|---|---|---|
| A | 37475 | 1057 | 2.820547% |
| B | 37471 | 931 | 2.484588% |
| C | 37474 | 969 | 2.585793% |
| D | 37473 | 1712 | 4.568623% |
Noise dominated data is calculated using 1-second bins in cleaned event files. If a bin has >2000 counts, and if more than 50% of those come from <1% of pixels, then it is considered to be noise-dominated and hence unusable.
| Quadrant | # 1 sec bins | Bins with >0 counts | Bins with >2000 counts | High rate bins dominated by noise | Noise dominated (total time) | Noise dominated (detector-on time) | Marked lightcurve |
|---|---|---|---|---|---|---|---|
| A | 39925 | 37483 | 201 | 201 | 0.50% | 0.54% | 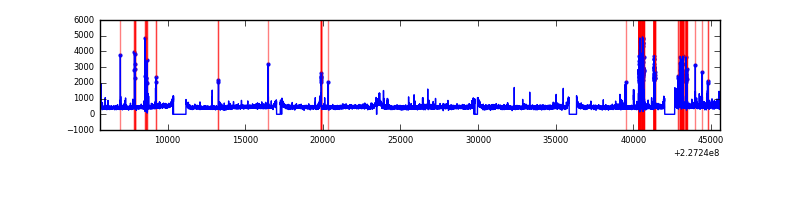 |
| B | 39925 | 37484 | 101 | 101 | 0.25% | 0.27% | 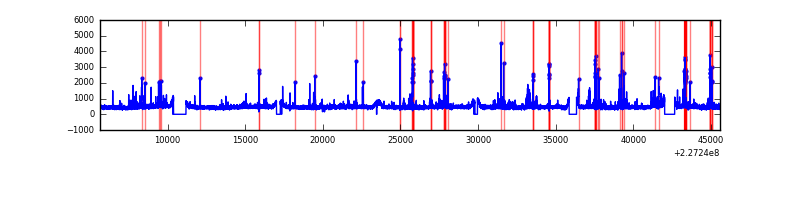 |
| C | 39925 | 37484 | 163 | 163 | 0.41% | 0.43% | 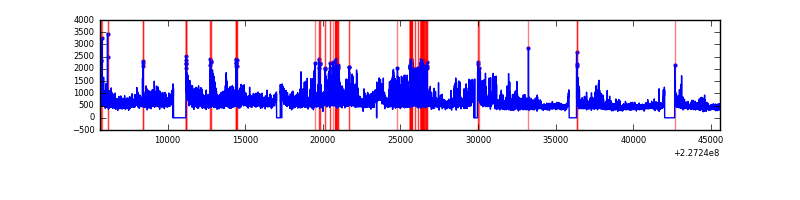 |
| D | 39925 | 37484 | 930 | 930 | 2.33% | 2.48% | 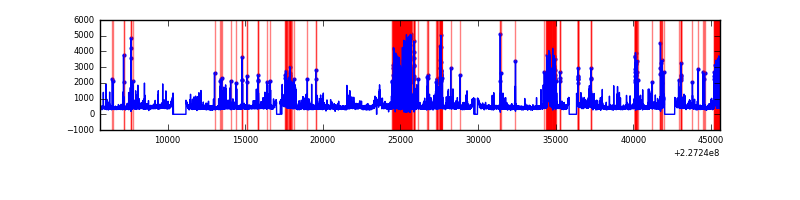 |
Top three noisy pixels from each quadrant. If the there are fewer than three noisy pixels in the level2.evt file, extra rows are filled as -1
| Pixel properties | Quadrant properties | ||||||
|---|---|---|---|---|---|---|---|
| Quadrant | DetID | PixID | Counts | Sigma | Mean | Median | Sigma |
| A | 15 | 239 | 1037087 | 1163.13 | 4378 | 4276 | 888.0 |
| A | 0 | 128 | 274940 | 304.82 | 4378 | 4276 | 888.0 |
| A | 15 | 234 | 241762 | 267.45 | 4378 | 4276 | 888.0 |
| B | 4 | 239 | 373007 | 441.52 | 4422 | 4313 | 835.1 |
| B | 4 | 173 | 264248 | 311.28 | 4422 | 4313 | 835.1 |
| B | 15 | 255 | 129923 | 150.42 | 4422 | 4313 | 835.1 |
| C | 1 | 16 | 8091053 | 8196.23 | 4288 | 4303 | 986.6 |
| C | 12 | 4 | 42738 | 38.96 | 4288 | 4303 | 986.6 |
| C | 13 | 61 | 32998 | 29.08 | 4288 | 4303 | 986.6 |
| D | 1 | 52 | 3753079 | 3601.31 | 4260 | 4120 | 1041.0 |
| D | 4 | 95 | 383888 | 364.81 | 4260 | 4120 | 1041.0 |
| D | 2 | 14 | 317743 | 301.27 | 4260 | 4120 | 1041.0 |
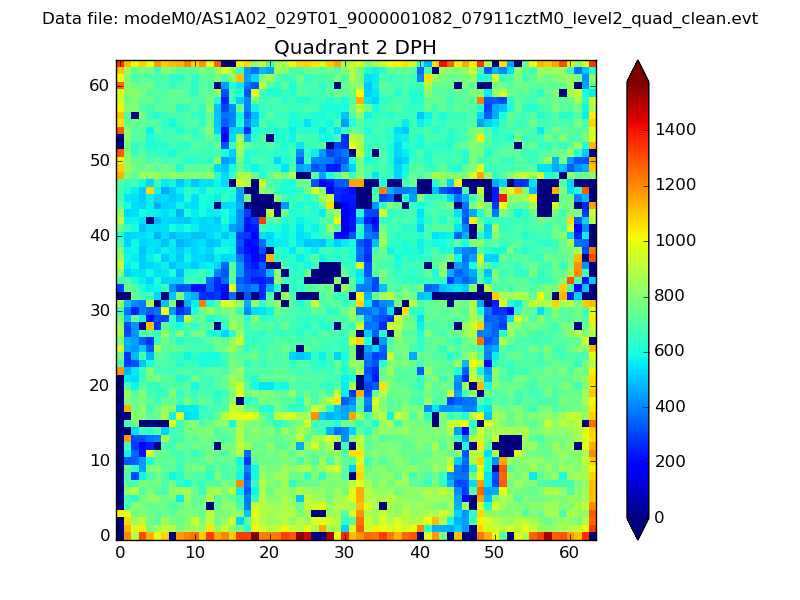
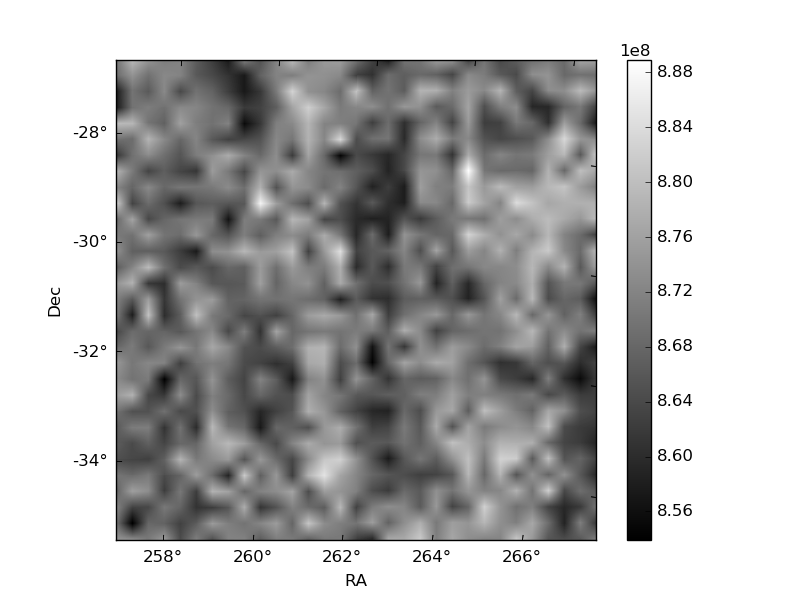
Histogram calculated using DETX and DETY for each event in the final _common_clean file
| Quadrant A | 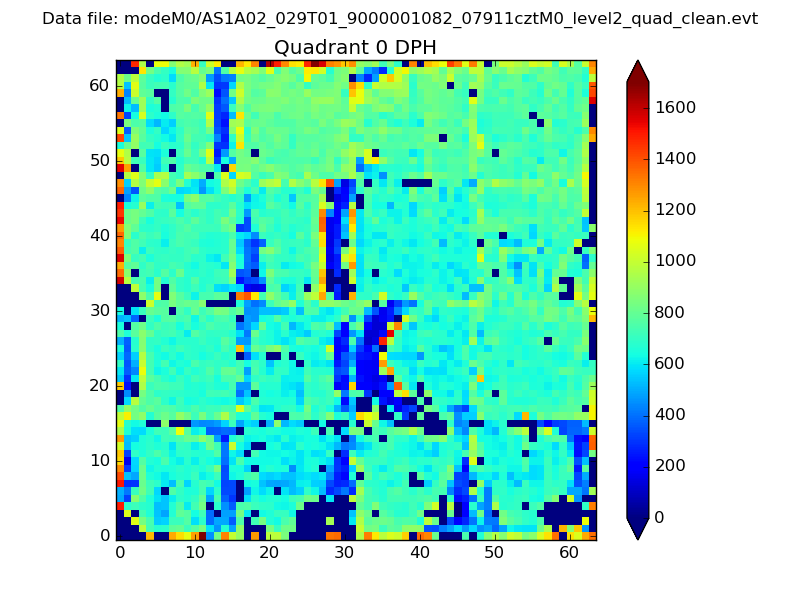 |
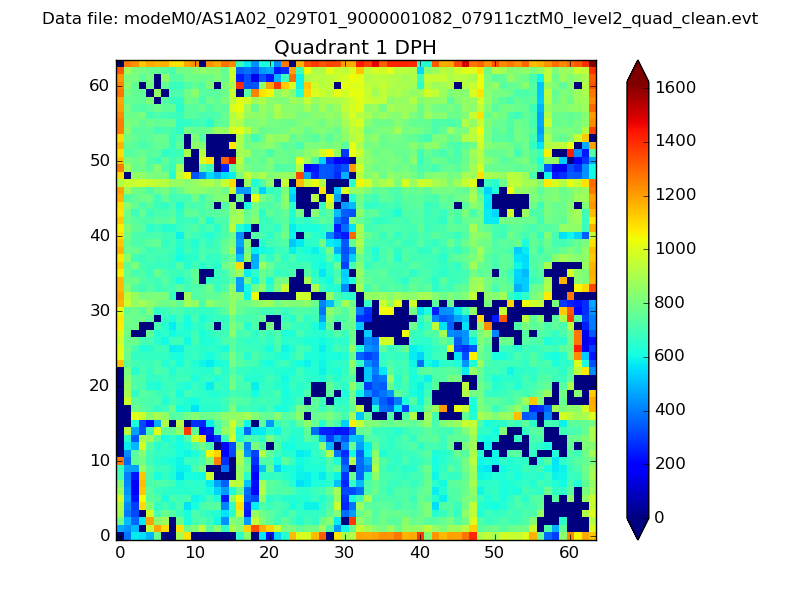 |
Quadrant B |
|---|---|---|---|
| Quadrant D | 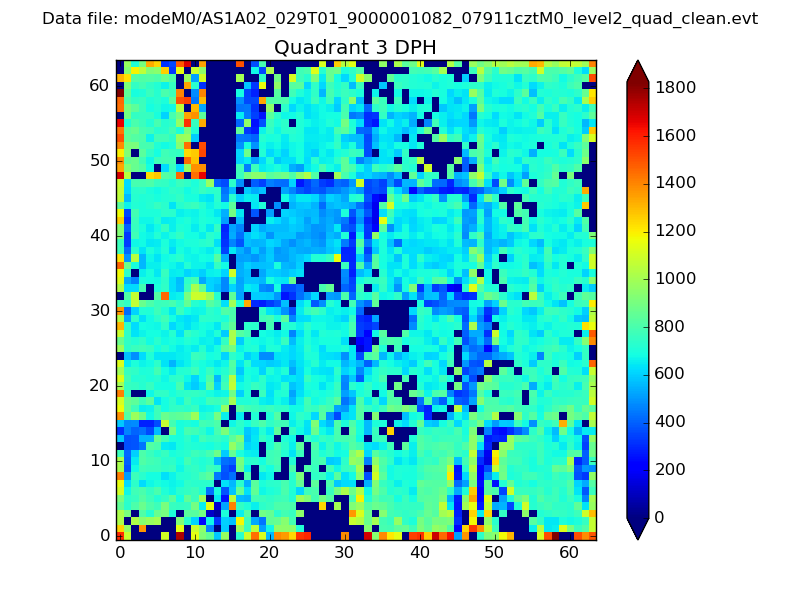 |
 |
Quadrant C |
| Plot type | Count rate plots | Images |
|---|---|---|
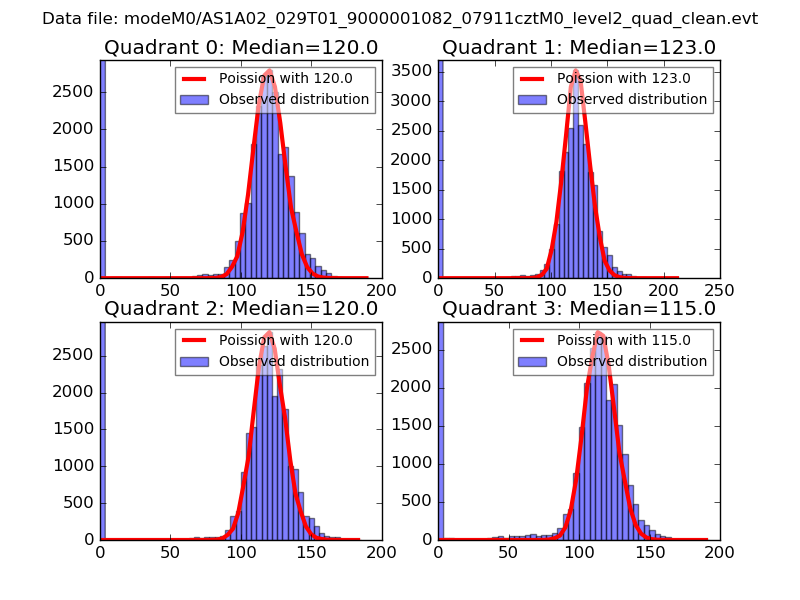
| Comparison with Poisson distribution Blue bars denote a histogram of data divided into 1 sec bins. Red curve is a Poisson curve with rate = median count rate of data. |
 |
 |
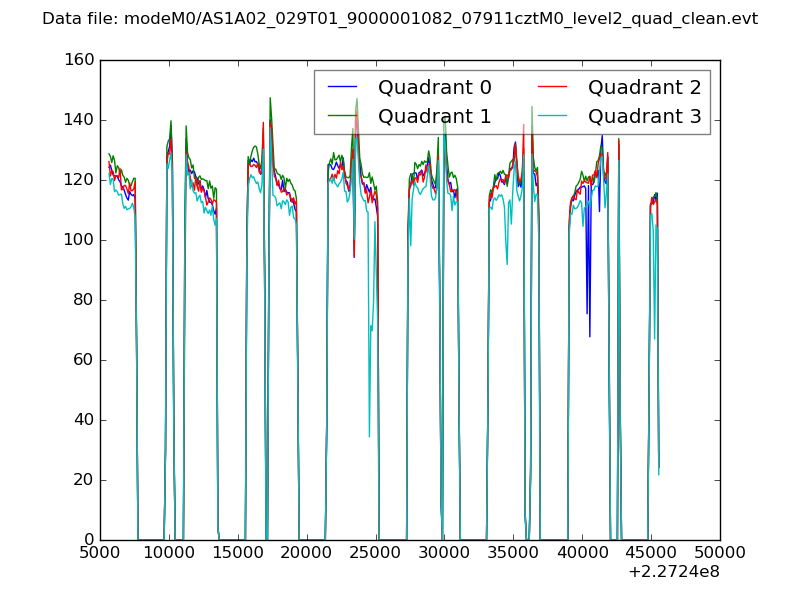
| Quadrant-wise count rates Data is divided into 100 sec bins |
 |
|
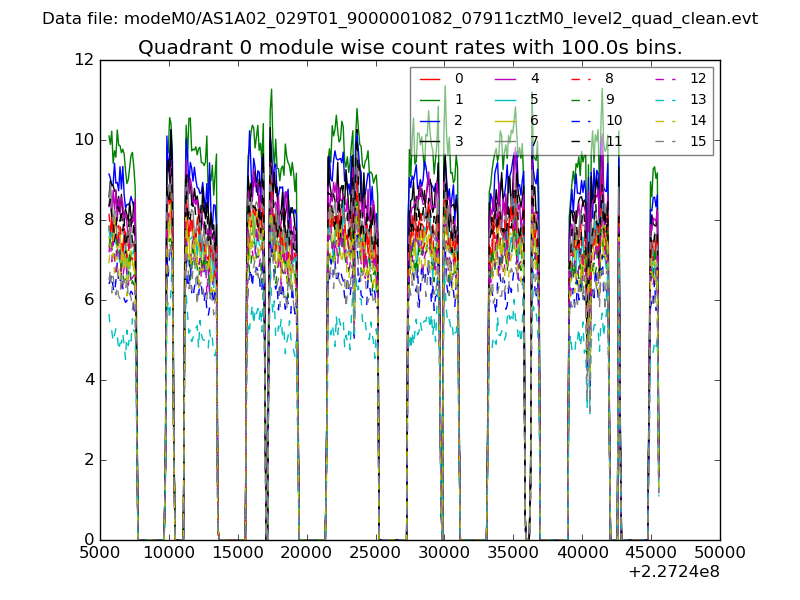
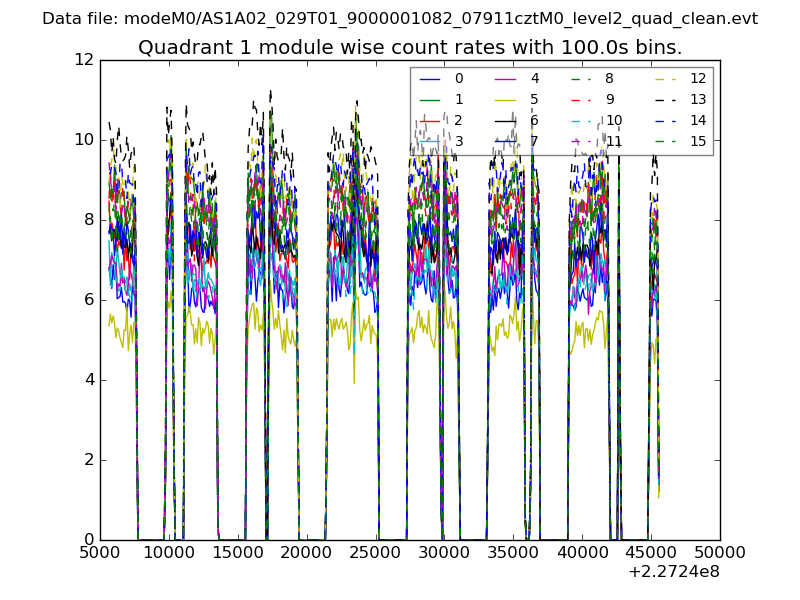
| Module-wise count rates for Quadrant A Data is divided into 100 sec bins |
 |
 |
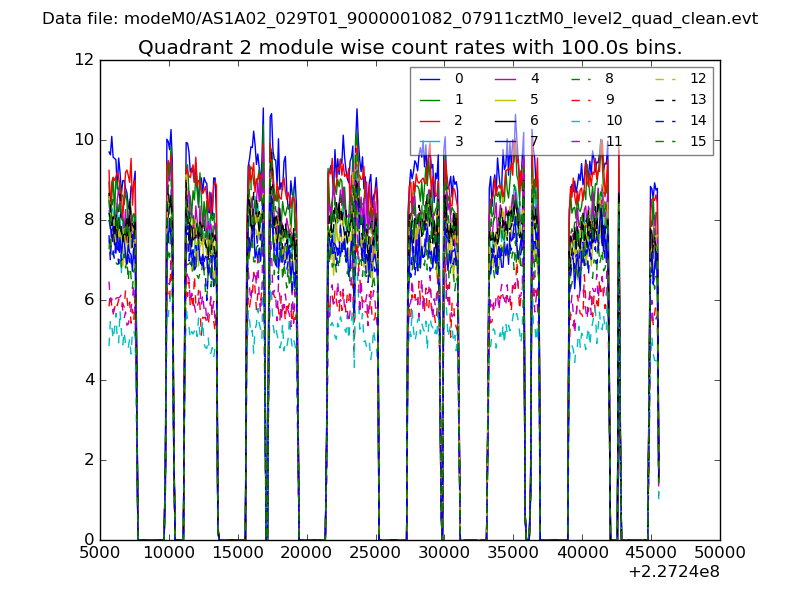
| Module-wise count rates for Quadrant B Data is divided into 100 sec bins |
 |
 |
| Module-wise count rates for Quadrant C Data is divided into 100 sec bins |
 |
 |
| Module-wise count rates for Quadrant D Data is divided into 100 sec bins |
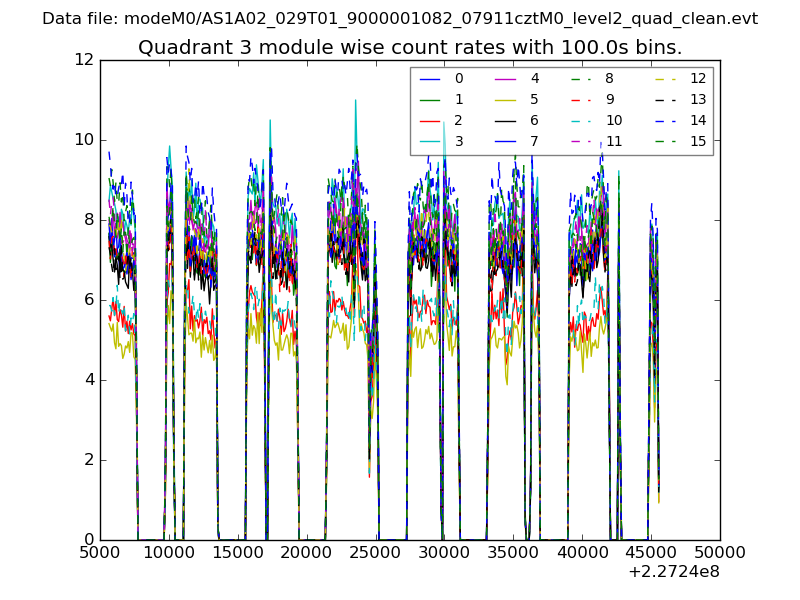 |
 |
| Parameter | Plot |
|---|---|
| CZT HV Monitor | 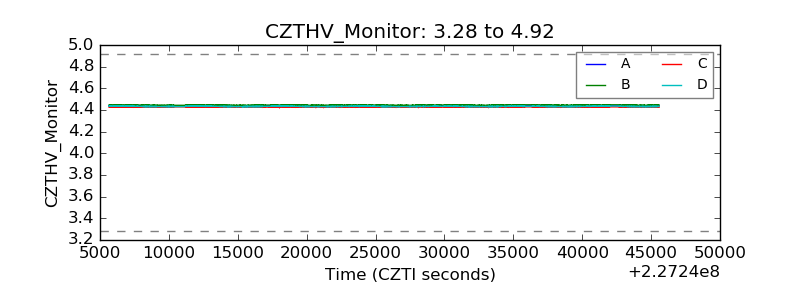 |
| D_VDD |  |
| Temperature 1 | 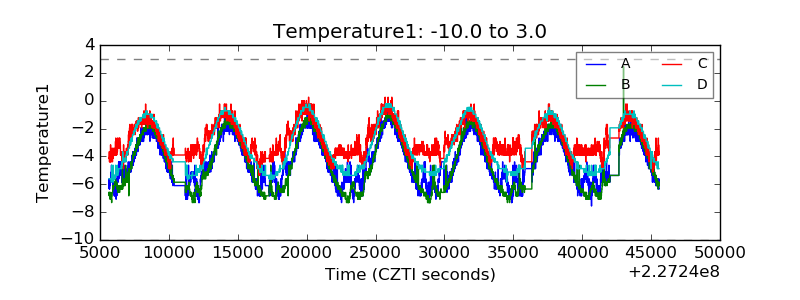 |
| Veto HV Monitor | 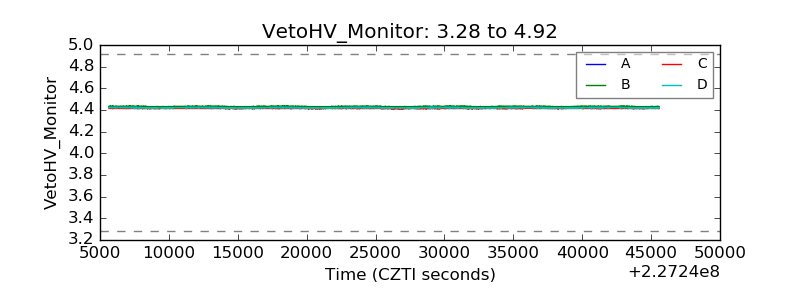 |
| Veto LLD | 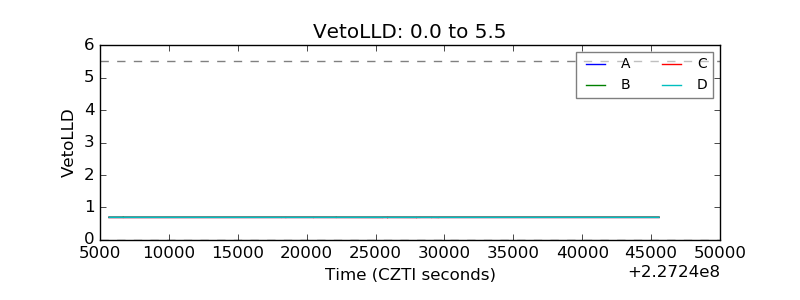 |
| Alpha Counter | 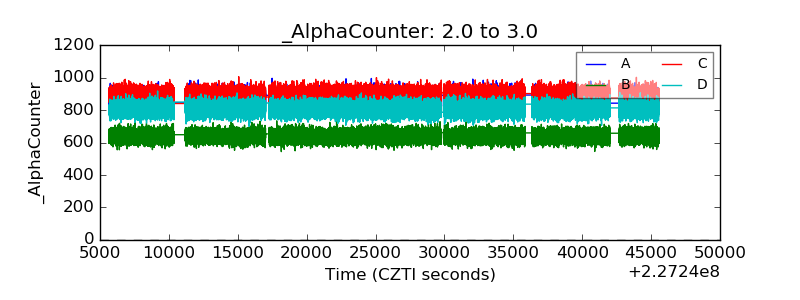 |
| _CPM_Rate | 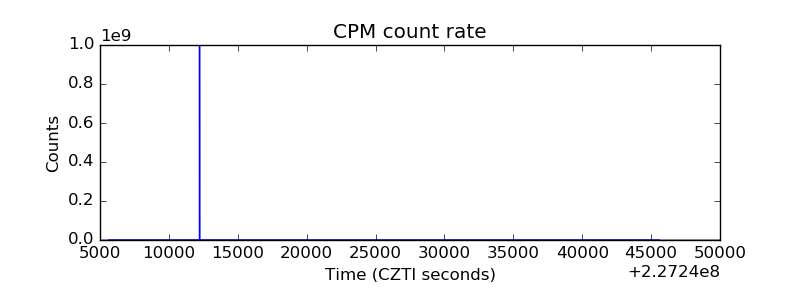 |
| CZT Counter | 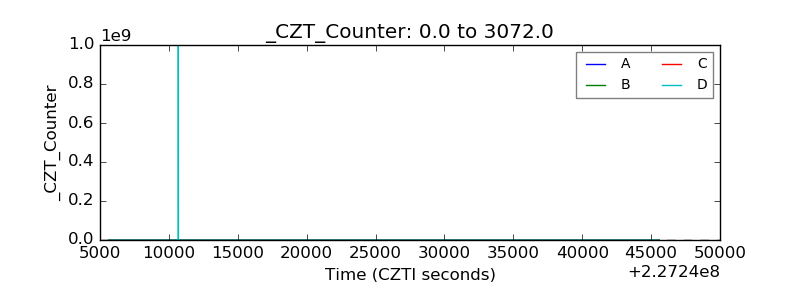 |
| +2.5 Volts monitor |  |
| +5 Volts monitor |  |
| _ROLL_ROT | 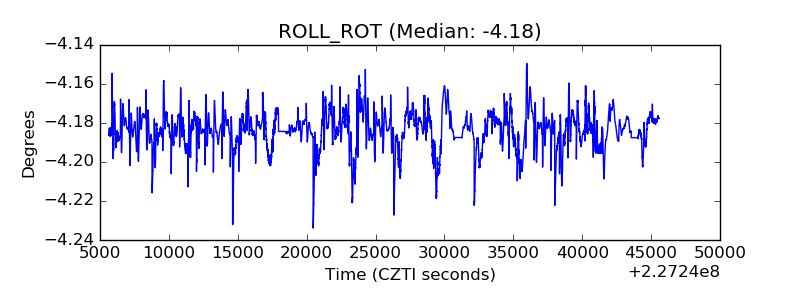 |
| _Roll_DEC | 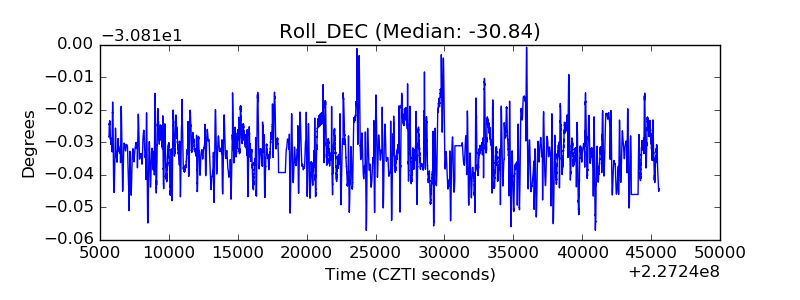 |
| _Roll_RA |  |
| Veto Counter | 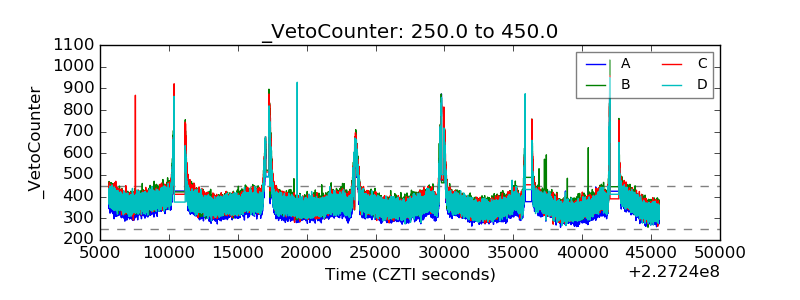 |