| Param | Original file | Final file |
|---|---|---|
| Filename | modeM0/AS1A02_158T01_9000001080cztM0_level2.fits | modeM0/AS1A02_158T01_9000001080cztM0_level2_quad_clean.evt |
| Size (bytes) | 307,126,080 | 340,384,320 |
| Size | 292.9 MB | 324.6 MB |
| Events in quadrant A | 1,842,772 | 2,119,519 |
| Events in quadrant B | 1,799,172 | 2,140,586 |
| Events in quadrant C | 1,835,482 | 2,038,901 |
| Events in quadrant D | 1,506,940 | 1,694,259 |
| Mode SS | |||
|---|---|---|---|
| Quadrant | BADHDUFLAG | Total packets | Discarded packets |
| A | 0 | 686 | 0 |
| B | 0 | 686 | 0 |
| C | 0 | 686 | 0 |
| D | 0 | 686 | 0 |
| Mode M9 | |||
|---|---|---|---|
| Quadrant | BADHDUFLAG | Total packets | Discarded packets |
| A | 0 | 54 | 0 |
| B | 0 | 54 | 0 |
| C | 0 | 54 | 0 |
| D | 0 | 54 | 0 |
| Mode M0 | |||
|---|---|---|---|
| Quadrant | BADHDUFLAG | Total packets | Discarded packets |
| A | 0 | 69441 | 0 |
| B | 0 | 70944 | 0 |
| C | 0 | 76736 | 0 |
| D | 0 | 91545 | 0 |
| Quadrant | Total seconds | Saturated seconds | Saturation percentage |
|---|---|---|---|
| A | 33711 | 423 | 1.254783% |
| B | 33711 | 468 | 1.388271% |
| C | 33711 | 413 | 1.225119% |
| D | 33711 | 2891 | 8.575836% |
Noise dominated data is calculated using 1-second bins in cleaned event files. If a bin has >2000 counts, and if more than 50% of those come from <1% of pixels, then it is considered to be noise-dominated and hence unusable.
| Quadrant | # 1 sec bins | Bins with >0 counts | Bins with >2000 counts | High rate bins dominated by noise | Noise dominated (total time) | Noise dominated (detector-on time) | Marked lightcurve |
|---|---|---|---|---|---|---|---|
| A | 38536 | 33711 | 0 | 0 | 0.00% | 0.00% | 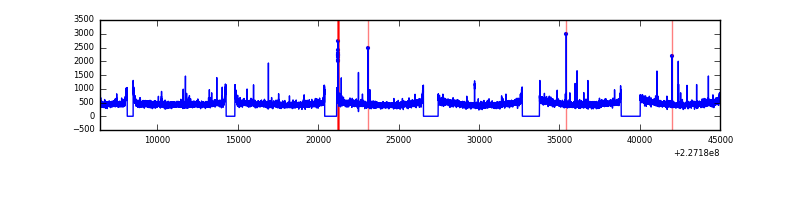 |
| B | 38536 | 33710 | 0 | 0 | 0.00% | 0.00% |  |
| C | 38536 | 33711 | 0 | 0 | 0.00% | 0.00% | 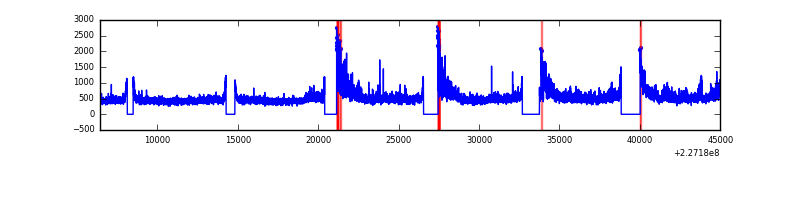 |
| D | 38536 | 33690 | 0 | 0 | 0.00% | 0.00% |  |
Top three noisy pixels from each quadrant. If the there are fewer than three noisy pixels in the level2.evt file, extra rows are filled as -1
| Pixel properties | Quadrant properties | ||||||
|---|---|---|---|---|---|---|---|
| Quadrant | DetID | PixID | Counts | Sigma | Mean | Median | Sigma |
| A | 0 | 29 | 1824 | 11.08 | 479 | 446 | 124.3 |
| A | 7 | 110 | 1578 | 9.1 | 479 | 446 | 124.3 |
| A | 0 | 30 | 1439 | 7.99 | 479 | 446 | 124.3 |
| B | 2 | 9 | 1561 | 11.48 | 473 | 448 | 97.0 |
| B | 14 | 254 | 1306 | 8.85 | 473 | 448 | 97.0 |
| B | 5 | 225 | 1230 | 8.07 | 473 | 448 | 97.0 |
| C | 1 | 80 | 1390 | 7.37 | 483 | 449 | 127.7 |
| C | 12 | 241 | 1317 | 6.8 | 483 | 449 | 127.7 |
| C | 1 | 81 | 1312 | 6.76 | 483 | 449 | 127.7 |
| D | 7 | 5 | 1106 | 6.23 | 429 | 390 | 115.0 |
| D | 6 | 231 | 1102 | 6.19 | 429 | 390 | 115.0 |
| D | 11 | 82 | 1091 | 6.09 | 429 | 390 | 115.0 |
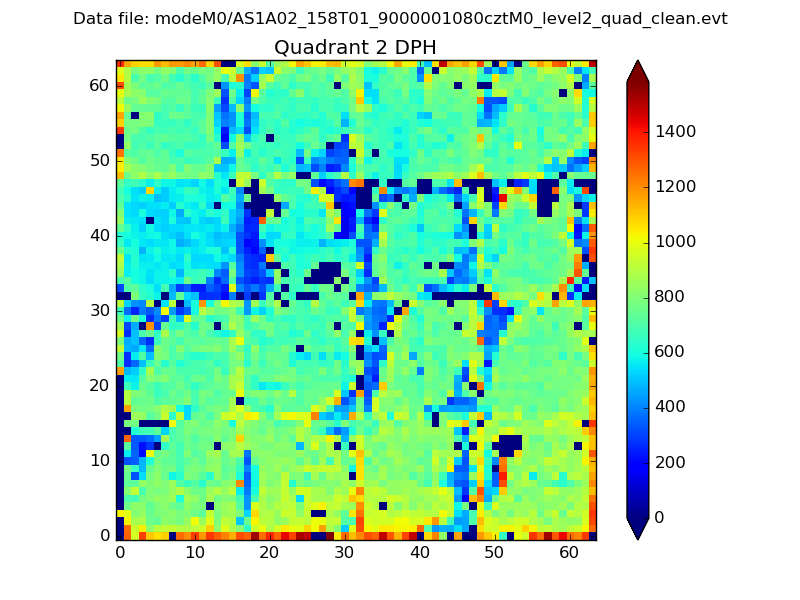
Histogram calculated using DETX and DETY for each event in the final _common_clean file
| Quadrant A | 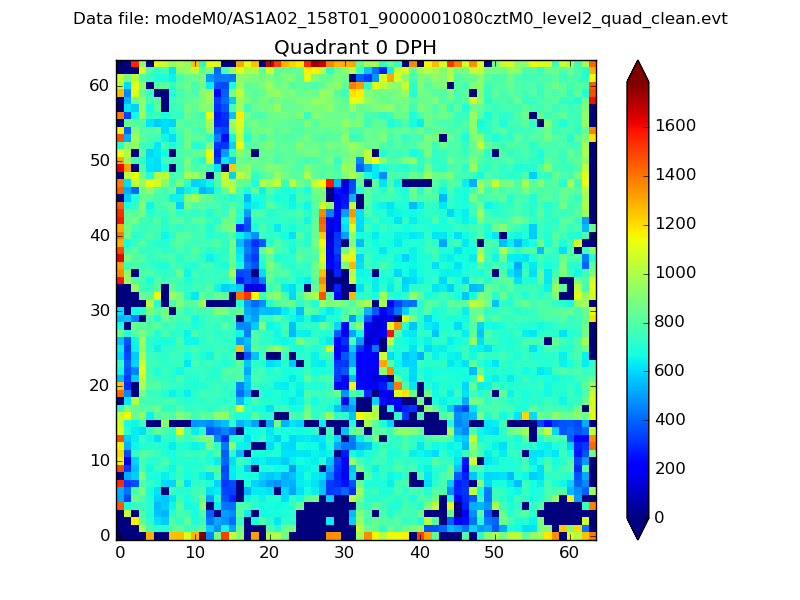 |
 |
Quadrant B |
|---|---|---|---|
| Quadrant D | 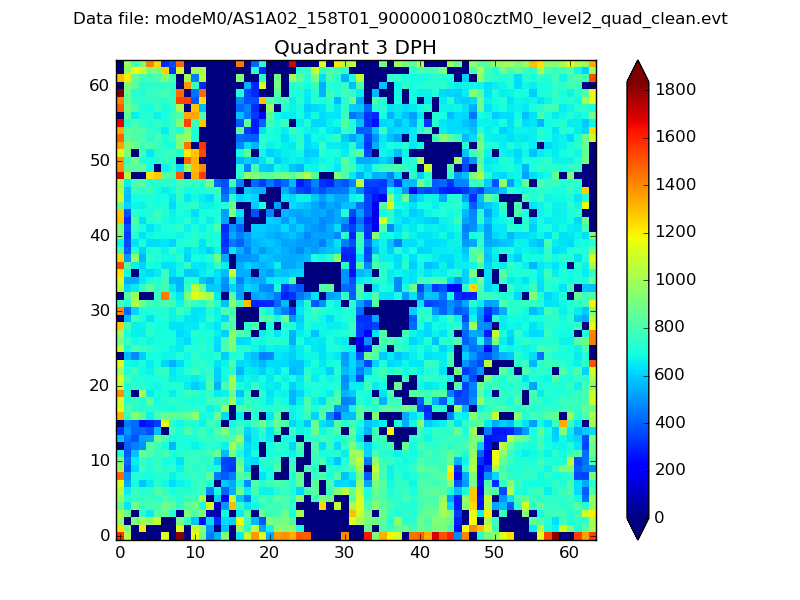 |
 |
Quadrant C |
| Plot type | Count rate plots | Images |
|---|---|---|
| Comparison with Poisson distribution Blue bars denote a histogram of data divided into 1 sec bins. Red curve is a Poisson curve with rate = median count rate of data. |
 |
 |
| Quadrant-wise count rates Data is divided into 100 sec bins |
 |
|
| Module-wise count rates for Quadrant A Data is divided into 100 sec bins |
 |
 |
| Module-wise count rates for Quadrant B Data is divided into 100 sec bins |
 |
 |
| Module-wise count rates for Quadrant C Data is divided into 100 sec bins |
 |
 |
| Module-wise count rates for Quadrant D Data is divided into 100 sec bins |
 |
 |
| Parameter | Plot |
|---|---|
| CZT HV Monitor |  |
| D_VDD | 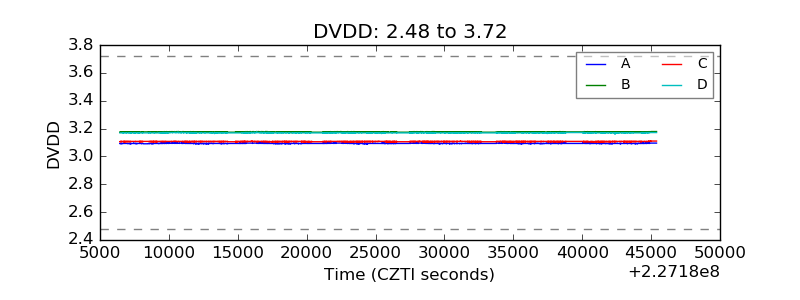 |
| Temperature 1 |  |
| Veto HV Monitor | 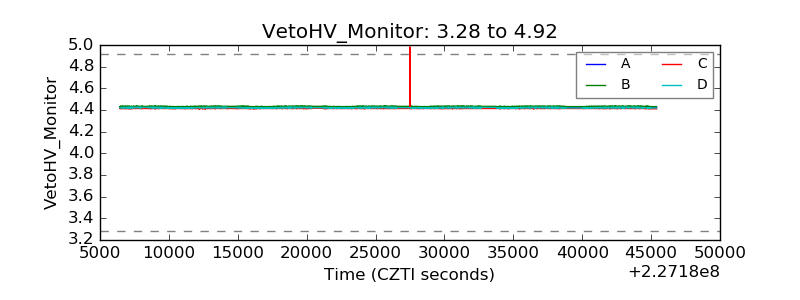 |
| Veto LLD |  |
| Alpha Counter | 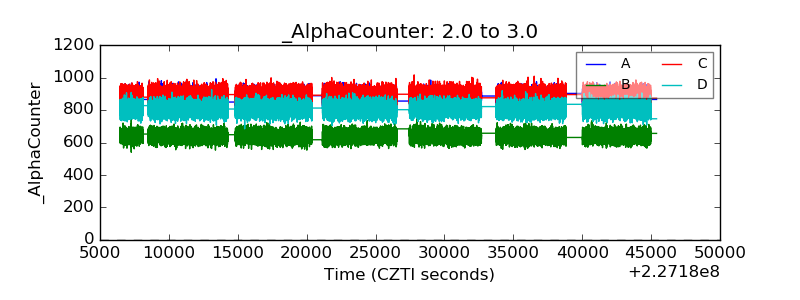 |
| _CPM_Rate |  |
| CZT Counter | 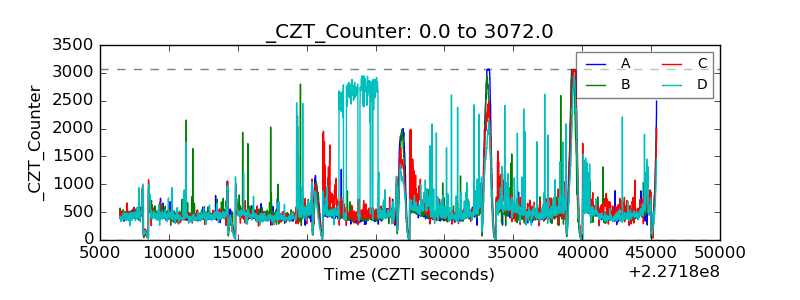 |
| +2.5 Volts monitor |  |
| +5 Volts monitor |  |
| _ROLL_ROT | 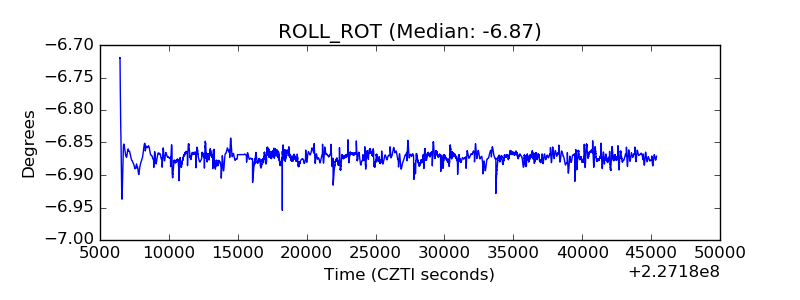 |
| _Roll_DEC | 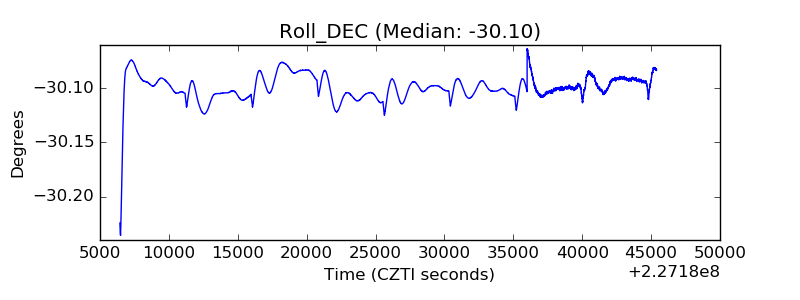 |
| _Roll_RA |  |
| Veto Counter |  |