| Param | Original file | Final file |
|---|---|---|
| Filename | modeM0/AS1A02_158T01_9000001080_07896cztM0_level2.evt | modeM0/AS1A02_158T01_9000001080_07896cztM0_level2_quad_clean.evt |
| Size (bytes) | 699,091,200 | 132,995,520 |
| Size | 666.7 MB | 126.8 MB |
| Events in quadrant A | 5,057,452 | 815,374 |
| Events in quadrant B | 5,354,784 | 828,341 |
| Events in quadrant C | 5,001,324 | 826,428 |
| Events in quadrant D | 5,004,376 | 788,029 |
| Mode SS | |||
|---|---|---|---|
| Quadrant | BADHDUFLAG | Total packets | Discarded packets |
| A | 0 | 224 | 0 |
| B | 0 | 224 | 0 |
| C | 0 | 224 | 0 |
| D | 0 | 224 | 0 |
| Mode M9 | |||
|---|---|---|---|
| Quadrant | BADHDUFLAG | Total packets | Discarded packets |
| A | 0 | 10 | 0 |
| B | 0 | 10 | 0 |
| C | 0 | 10 | 0 |
| D | 0 | 10 | 0 |
| Mode M0 | |||
|---|---|---|---|
| Quadrant | BADHDUFLAG | Total packets | Discarded packets |
| A | 0 | 22868 | 3 |
| B | 0 | 23405 | 2 |
| C | 0 | 22817 | 2 |
| D | 0 | 23104 | 2 |
| Quadrant | Total seconds | Saturated seconds | Saturation percentage |
|---|---|---|---|
| A | 11123 | 203 | 1.825047% |
| B | 11123 | 229 | 2.058797% |
| C | 11123 | 132 | 1.186730% |
| D | 11123 | 144 | 1.294615% |
Noise dominated data is calculated using 1-second bins in cleaned event files. If a bin has >2000 counts, and if more than 50% of those come from <1% of pixels, then it is considered to be noise-dominated and hence unusable.
| Quadrant | # 1 sec bins | Bins with >0 counts | Bins with >2000 counts | High rate bins dominated by noise | Noise dominated (total time) | Noise dominated (detector-on time) | Marked lightcurve |
|---|---|---|---|---|---|---|---|
| A | 12038 | 11125 | 0 | 0 | 0.00% | 0.00% | 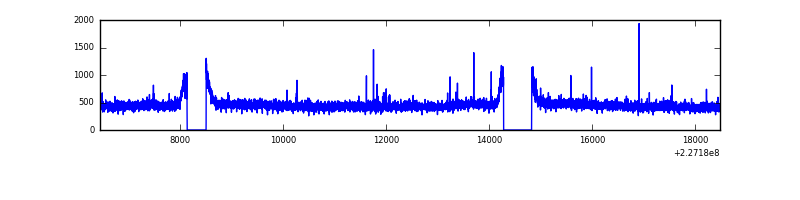 |
| B | 12038 | 11125 | 17 | 17 | 0.14% | 0.15% | 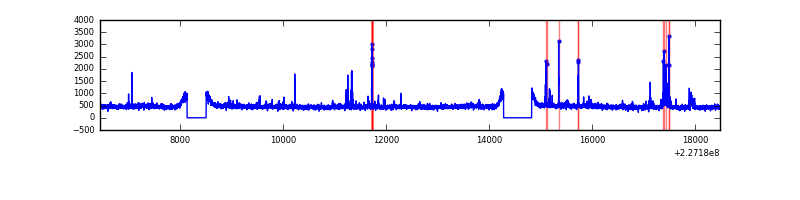 |
| C | 12038 | 11125 | 0 | 0 | 0.00% | 0.00% | 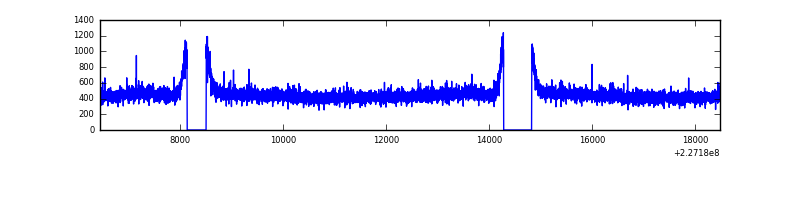 |
| D | 12038 | 11125 | 7 | 7 | 0.06% | 0.06% | 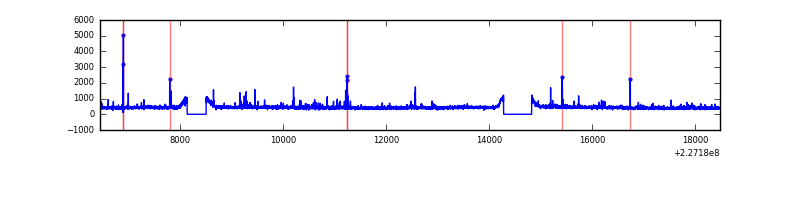 |
Top three noisy pixels from each quadrant. If the there are fewer than three noisy pixels in the level2.evt file, extra rows are filled as -1
| Pixel properties | Quadrant properties | ||||||
|---|---|---|---|---|---|---|---|
| Quadrant | DetID | PixID | Counts | Sigma | Mean | Median | Sigma |
| A | 15 | 239 | 27473 | 98.57 | 1296 | 1266 | 265.9 |
| A | 8 | 15 | 15446 | 53.33 | 1296 | 1266 | 265.9 |
| A | 0 | 226 | 11975 | 40.28 | 1296 | 1266 | 265.9 |
| B | 4 | 239 | 104929 | 410.56 | 1309 | 1277 | 252.5 |
| B | 4 | 81 | 69242 | 269.21 | 1309 | 1277 | 252.5 |
| B | 0 | 213 | 40780 | 156.47 | 1309 | 1277 | 252.5 |
| C | 14 | 67 | 12733 | 38.29 | 1277 | 1282 | 299.1 |
| C | 13 | 61 | 9612 | 27.85 | 1277 | 1282 | 299.1 |
| C | 1 | 16 | 5777 | 15.03 | 1277 | 1282 | 299.1 |
| D | 13 | 104 | 50932 | 157.87 | 1271 | 1232 | 314.8 |
| D | 2 | 234 | 43503 | 134.27 | 1271 | 1232 | 314.8 |
| D | 4 | 95 | 43167 | 133.2 | 1271 | 1232 | 314.8 |
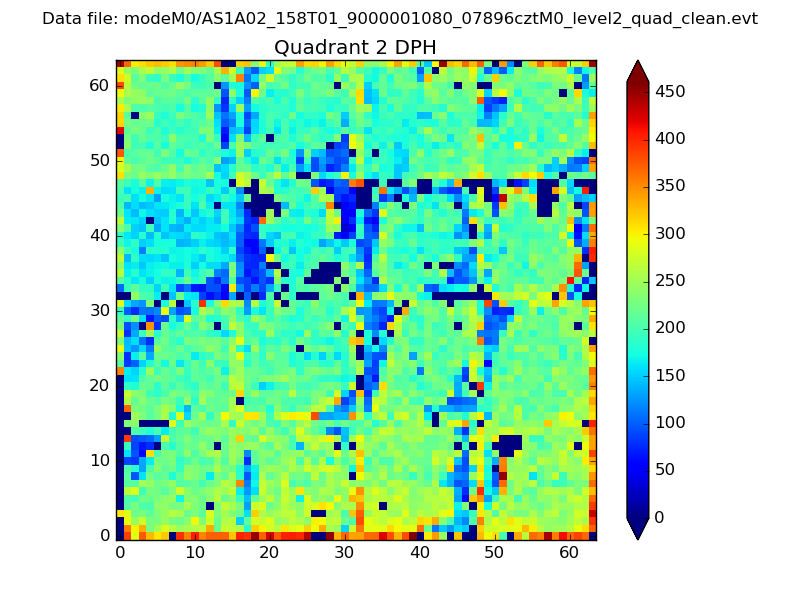
Histogram calculated using DETX and DETY for each event in the final _common_clean file
| Quadrant A |  |
 |
Quadrant B |
|---|---|---|---|
| Quadrant D | 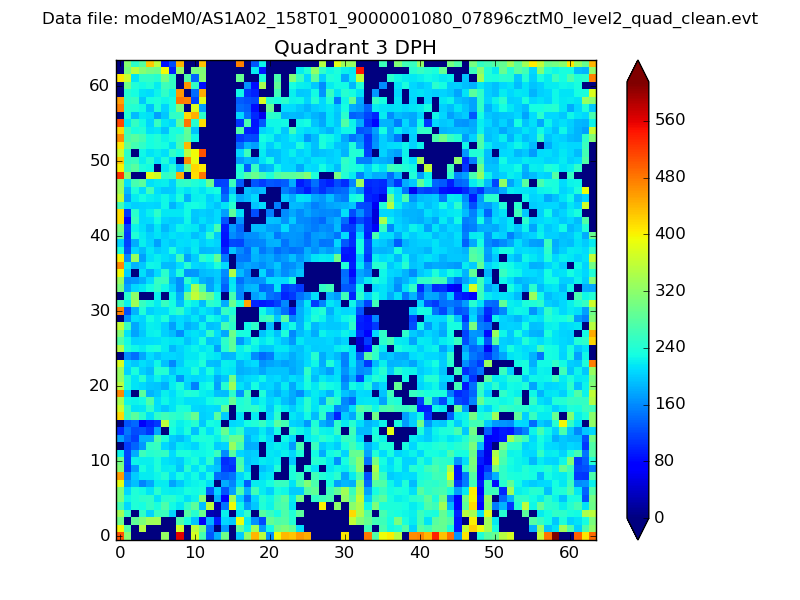 |
 |
Quadrant C |
| Plot type | Count rate plots | Images |
|---|---|---|
| Comparison with Poisson distribution Blue bars denote a histogram of data divided into 1 sec bins. Red curve is a Poisson curve with rate = median count rate of data. |
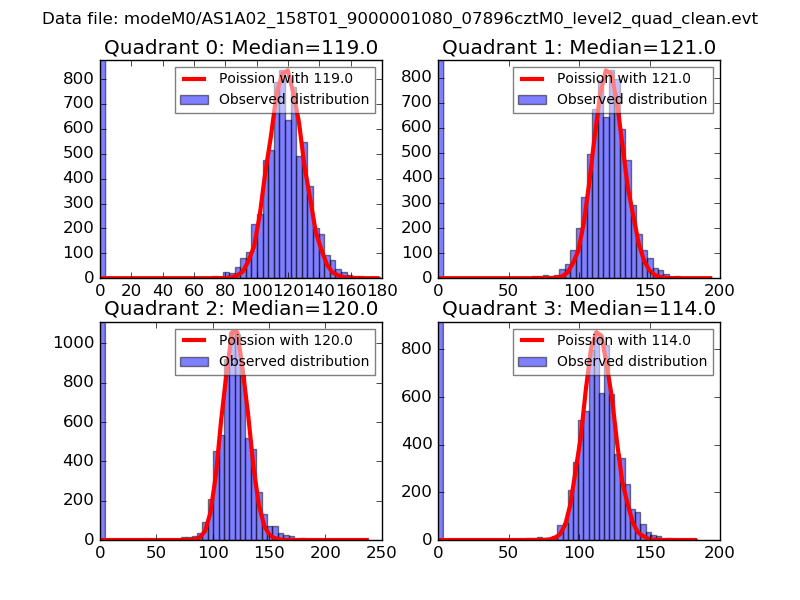 |
 |
| Quadrant-wise count rates Data is divided into 100 sec bins |
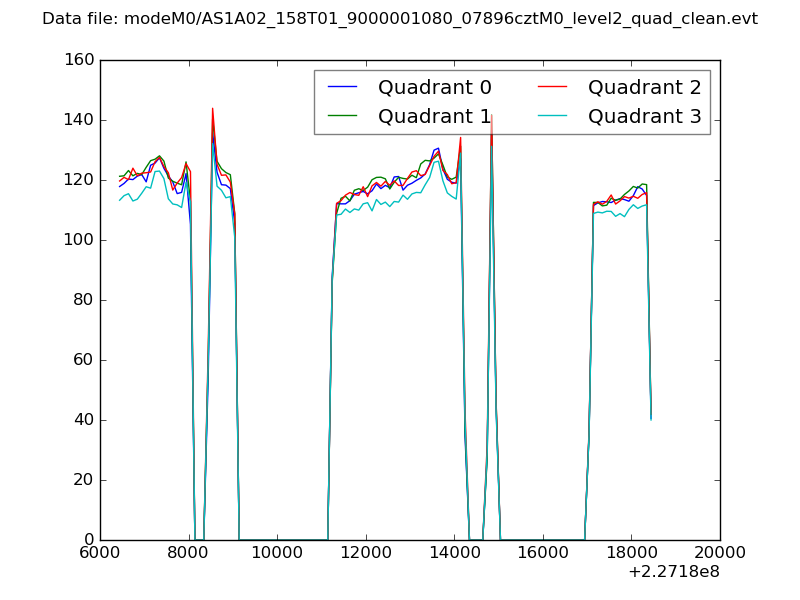 |
|
| Module-wise count rates for Quadrant A Data is divided into 100 sec bins |
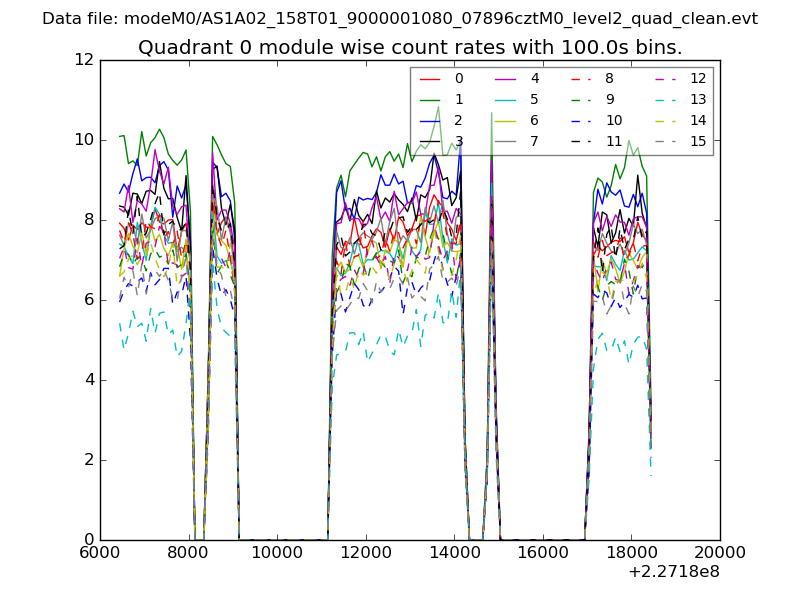 |
 |
| Module-wise count rates for Quadrant B Data is divided into 100 sec bins |
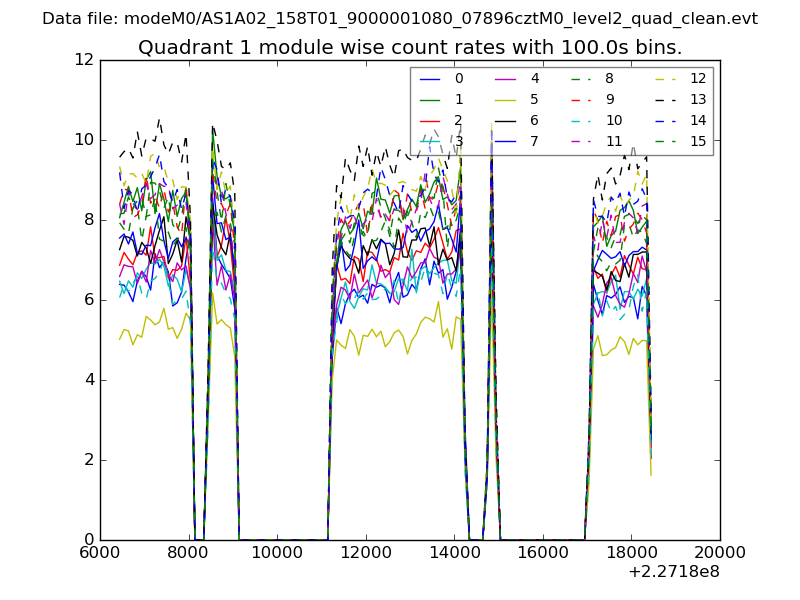 |
 |
| Module-wise count rates for Quadrant C Data is divided into 100 sec bins |
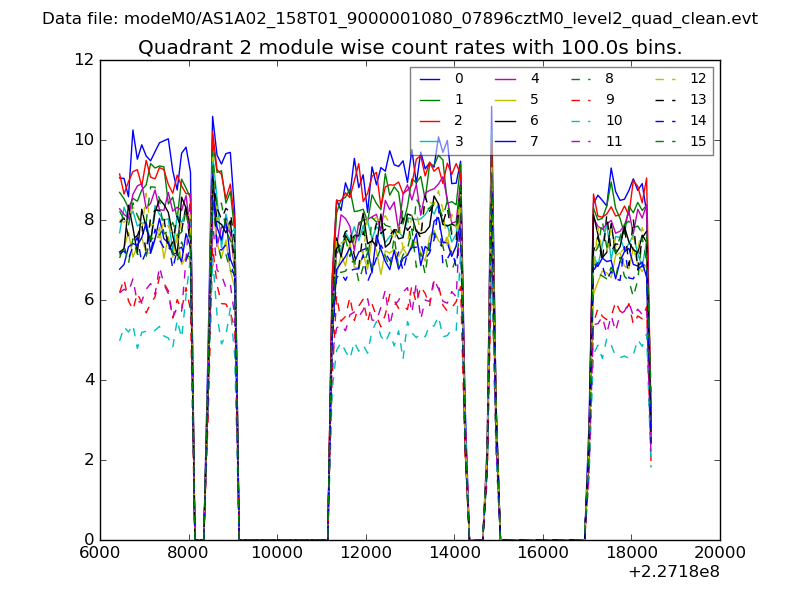 |
 |
| Module-wise count rates for Quadrant D Data is divided into 100 sec bins |
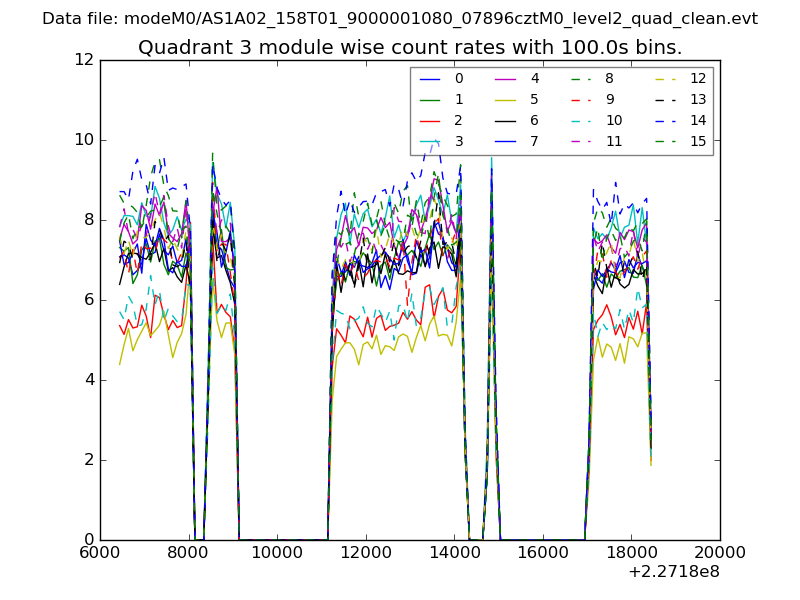 |
 |
| Parameter | Plot |
|---|---|
| CZT HV Monitor | 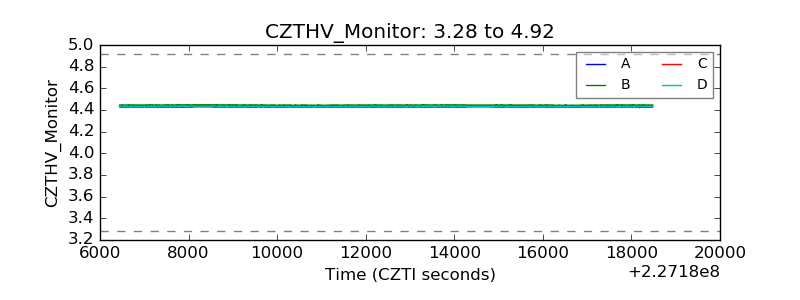 |
| D_VDD | 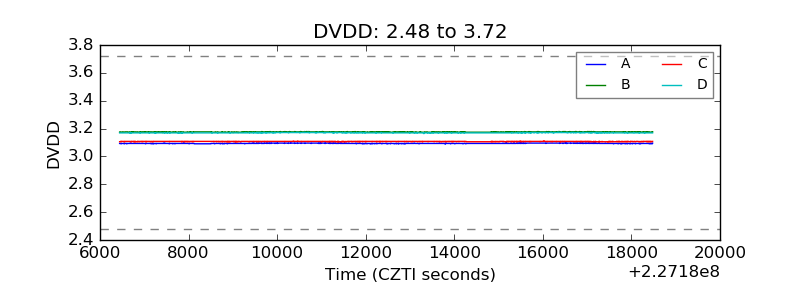 |
| Temperature 1 | 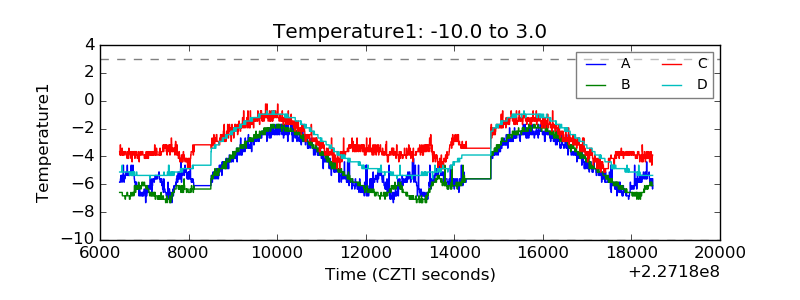 |
| Veto HV Monitor | 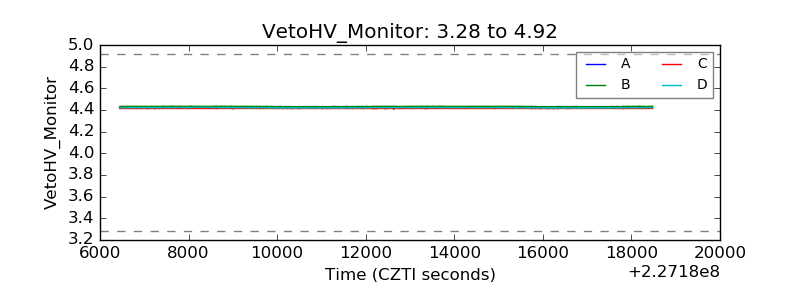 |
| Veto LLD | 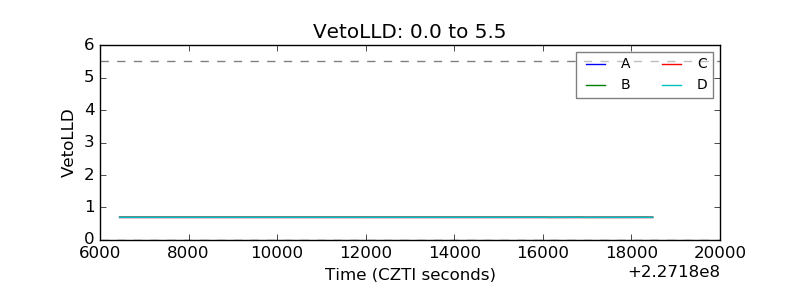 |
| Alpha Counter | 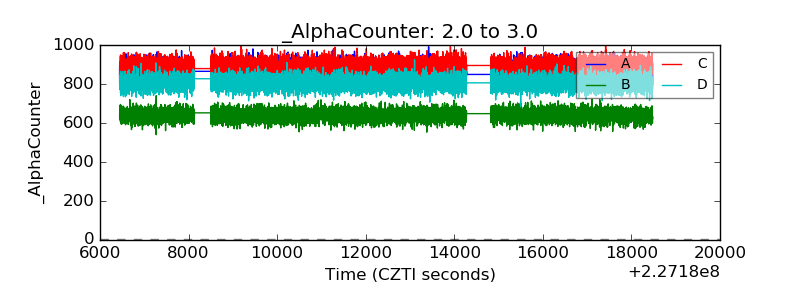 |
| _CPM_Rate | 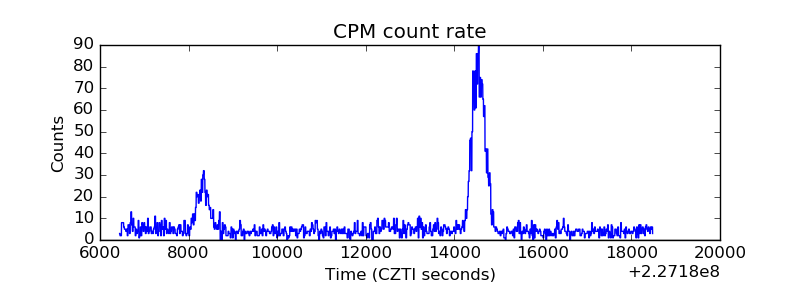 |
| CZT Counter | 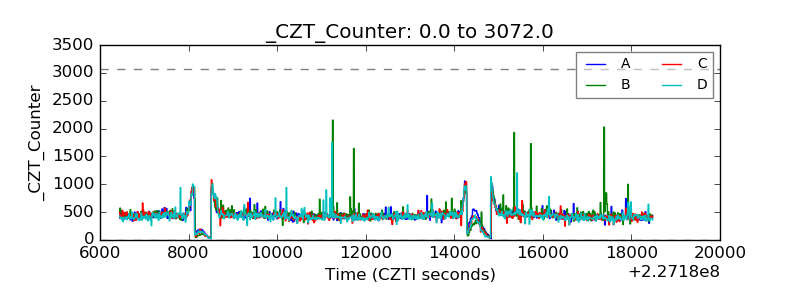 |
| +2.5 Volts monitor |  |
| +5 Volts monitor | 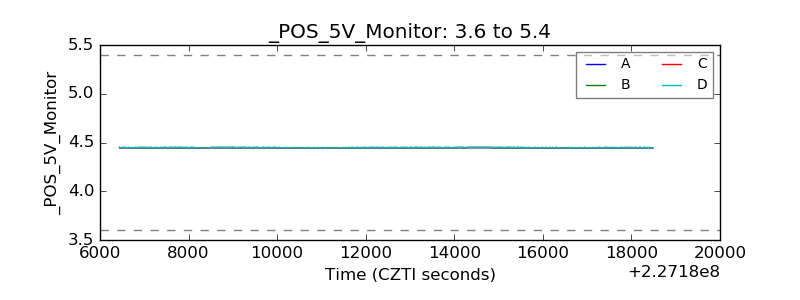 |
| _ROLL_ROT | 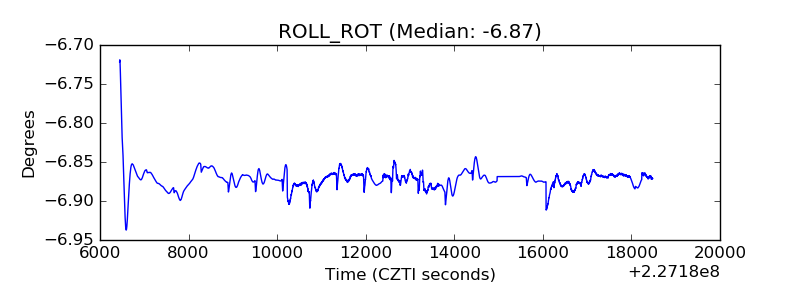 |
| _Roll_DEC | 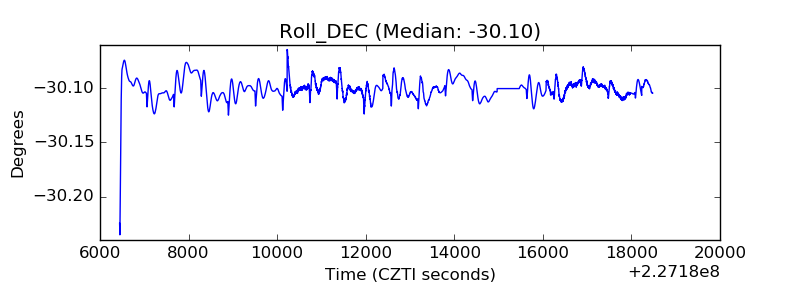 |
| _Roll_RA | 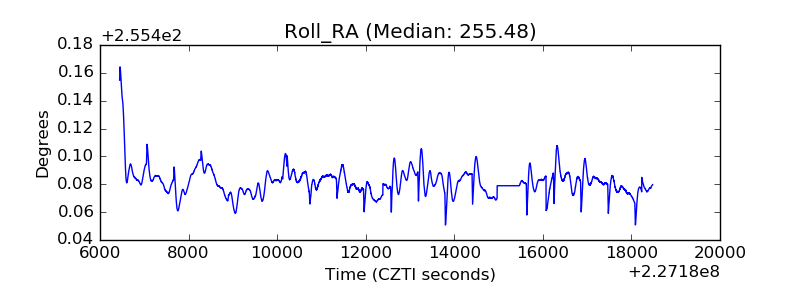 |
| Veto Counter | 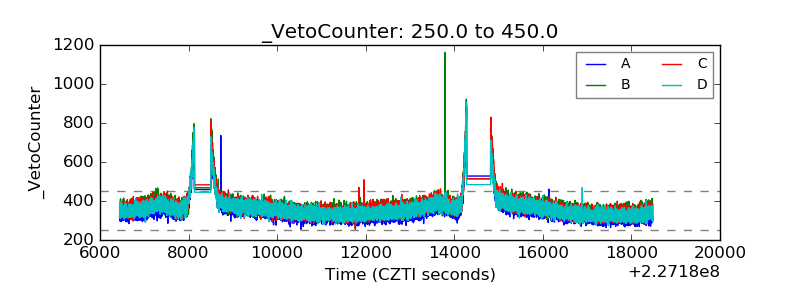 |