| Param | Original file | Final file |
|---|---|---|
| Filename | modeM0/AS1A02_158T01_9000001080_07897cztM0_level2.evt | modeM0/AS1A02_158T01_9000001080_07897cztM0_level2_quad_clean.evt |
| Size (bytes) | 875,459,520 | 124,591,680 |
| Size | 834.9 MB | 118.8 MB |
| Events in quadrant A | 4,625,085 | 809,493 |
| Events in quadrant B | 4,813,686 | 822,297 |
| Events in quadrant C | 5,832,455 | 810,176 |
| Events in quadrant D | 10,556,568 | 628,510 |
| Mode SS | |||
|---|---|---|---|
| Quadrant | BADHDUFLAG | Total packets | Discarded packets |
| A | 0 | 208 | 0 |
| B | 0 | 208 | 0 |
| C | 0 | 208 | 0 |
| D | 0 | 208 | 0 |
| Mode M9 | |||
|---|---|---|---|
| Quadrant | BADHDUFLAG | Total packets | Discarded packets |
| A | 0 | 16 | 0 |
| B | 0 | 16 | 0 |
| C | 0 | 16 | 0 |
| D | 0 | 16 | 0 |
| Mode M0 | |||
|---|---|---|---|
| Quadrant | BADHDUFLAG | Total packets | Discarded packets |
| A | 0 | 20803 | 3 |
| B | 0 | 21100 | 2 |
| C | 0 | 24100 | 2 |
| D | 0 | 38483 | 2 |
| Quadrant | Total seconds | Saturated seconds | Saturation percentage |
|---|---|---|---|
| A | 10123 | 118 | 1.165662% |
| B | 10123 | 116 | 1.145905% |
| C | 10123 | 174 | 1.718858% |
| D | 10123 | 2537 | 25.061741% |
Noise dominated data is calculated using 1-second bins in cleaned event files. If a bin has >2000 counts, and if more than 50% of those come from <1% of pixels, then it is considered to be noise-dominated and hence unusable.
| Quadrant | # 1 sec bins | Bins with >0 counts | Bins with >2000 counts | High rate bins dominated by noise | Noise dominated (total time) | Noise dominated (detector-on time) | Marked lightcurve |
|---|---|---|---|---|---|---|---|
| A | 11783 | 10125 | 10 | 10 | 0.08% | 0.10% |  |
| B | 11783 | 10125 | 7 | 7 | 0.06% | 0.07% | 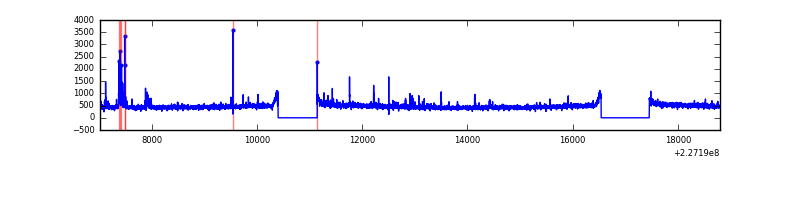 |
| C | 11783 | 10125 | 31 | 31 | 0.26% | 0.31% | 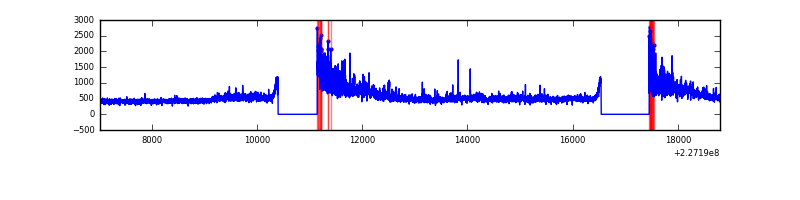 |
| D | 11783 | 10125 | 2401 | 2401 | 20.38% | 23.71% | 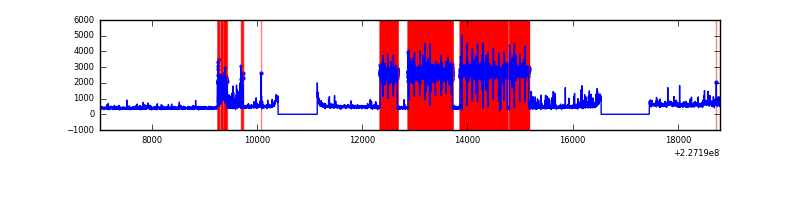 |
Top three noisy pixels from each quadrant. If the there are fewer than three noisy pixels in the level2.evt file, extra rows are filled as -1
| Pixel properties | Quadrant properties | ||||||
|---|---|---|---|---|---|---|---|
| Quadrant | DetID | PixID | Counts | Sigma | Mean | Median | Sigma |
| A | 15 | 234 | 33670 | 134.5 | 1183 | 1159 | 241.7 |
| A | 15 | 239 | 14245 | 54.14 | 1183 | 1159 | 241.7 |
| A | 8 | 15 | 11219 | 41.62 | 1183 | 1159 | 241.7 |
| B | 4 | 81 | 73499 | 316.09 | 1194 | 1163 | 228.8 |
| B | 0 | 213 | 30872 | 129.82 | 1194 | 1163 | 228.8 |
| B | 4 | 239 | 25420 | 106.0 | 1194 | 1163 | 228.8 |
| C | 1 | 16 | 1240732 | 4656.27 | 1155 | 1163 | 266.2 |
| C | 14 | 67 | 45486 | 166.49 | 1155 | 1163 | 266.2 |
| C | 9 | 68 | 40259 | 146.86 | 1155 | 1163 | 266.2 |
| D | 1 | 20 | 6606601 | 26853.28 | 1009 | 978 | 246.0 |
| D | 1 | 52 | 41507 | 164.76 | 1009 | 978 | 246.0 |
| D | 2 | 234 | 31677 | 124.8 | 1009 | 978 | 246.0 |
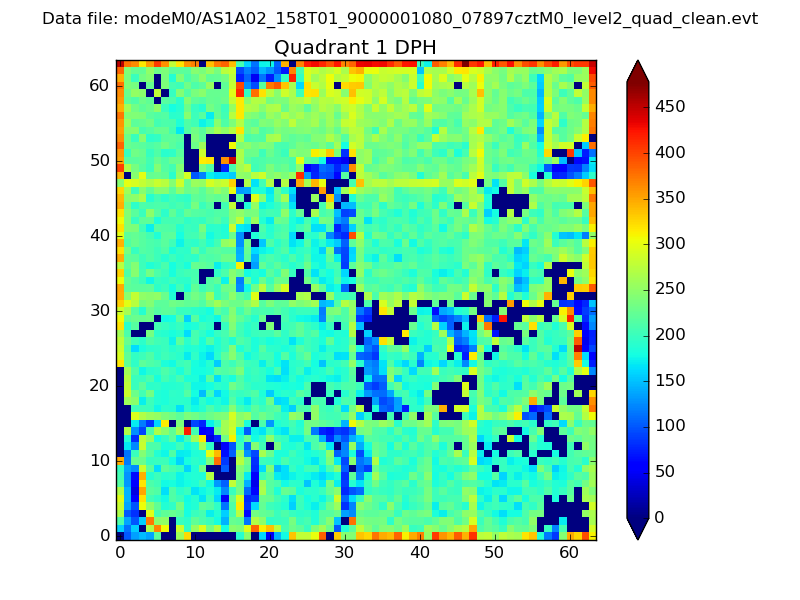
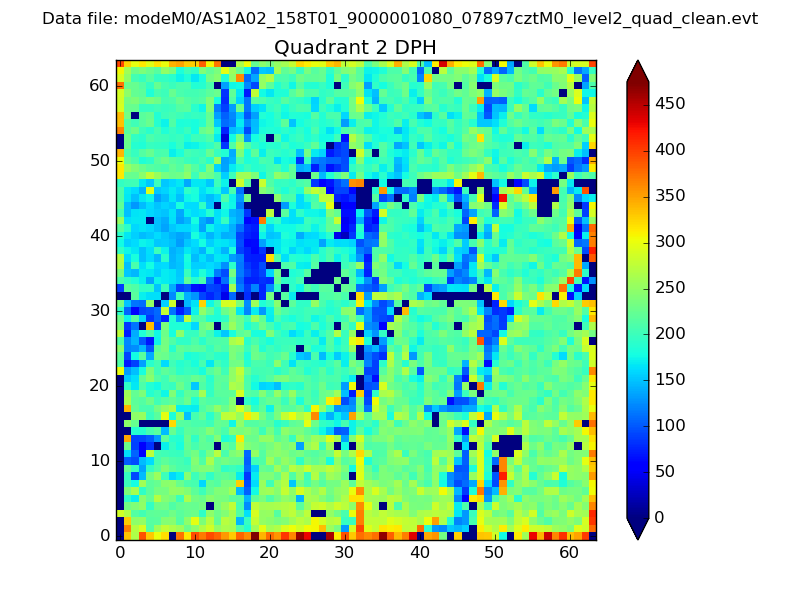
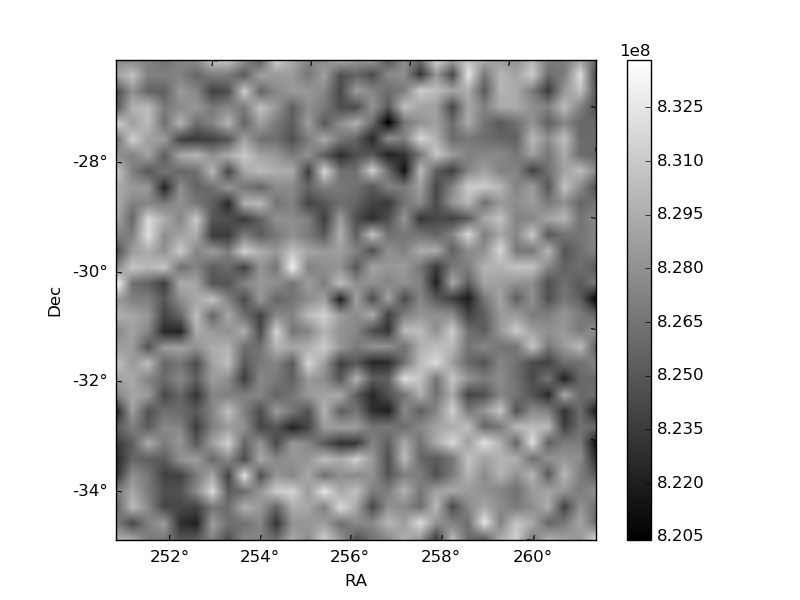
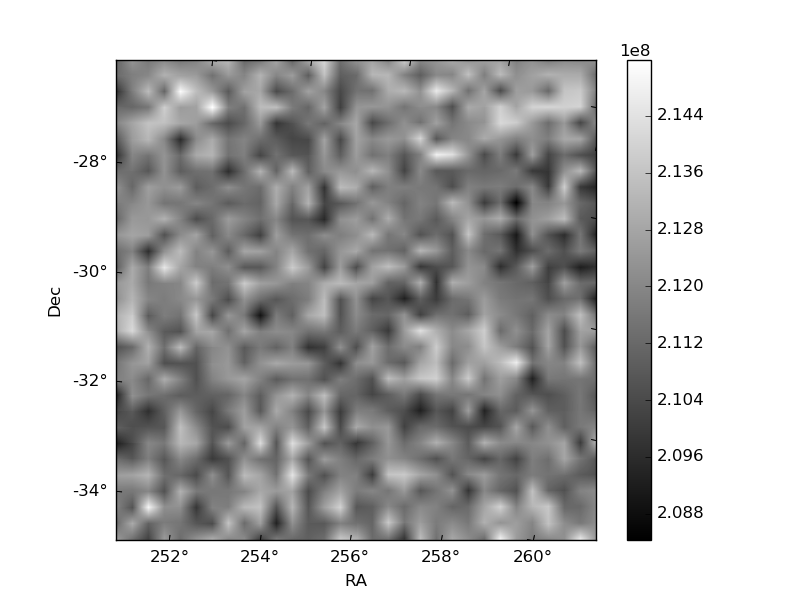
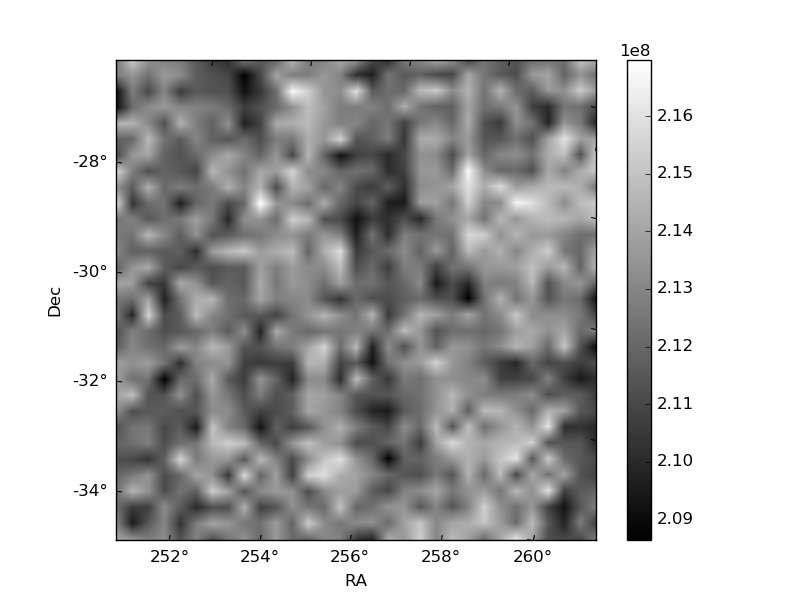
Histogram calculated using DETX and DETY for each event in the final _common_clean file
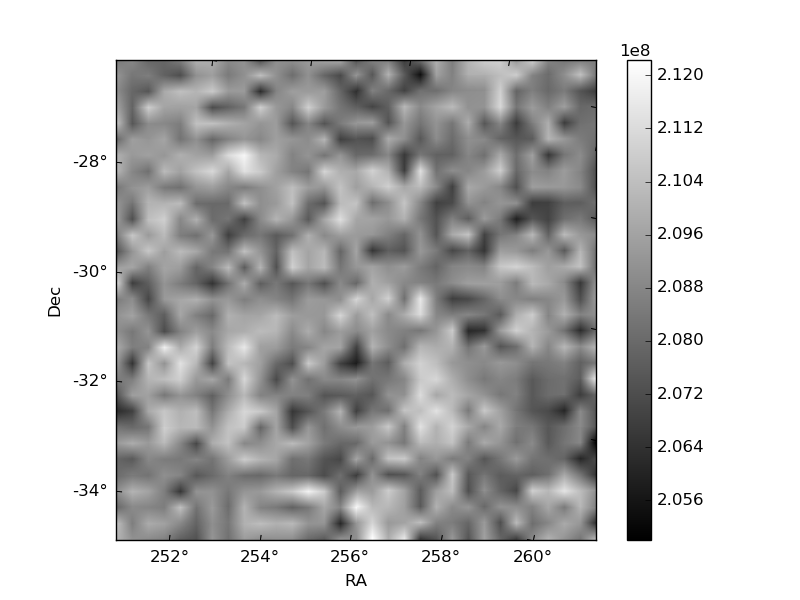
| Quadrant A | 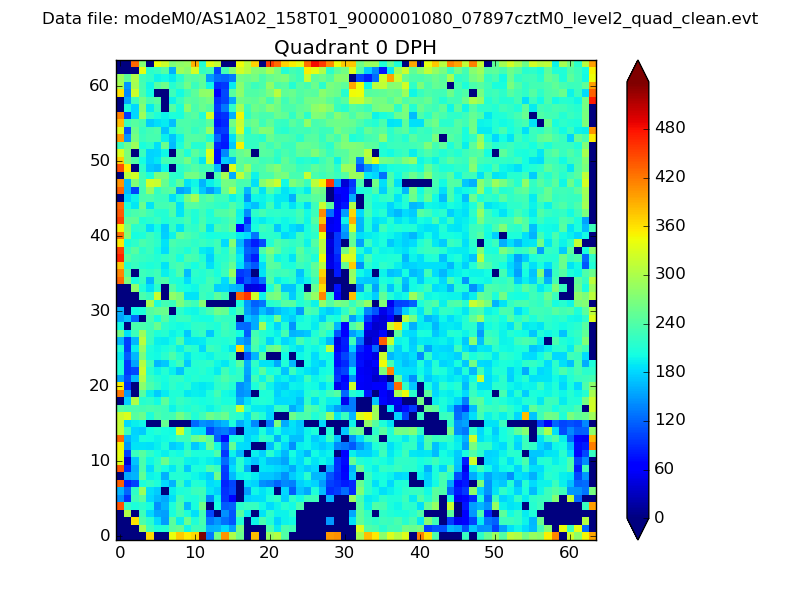 |
 |
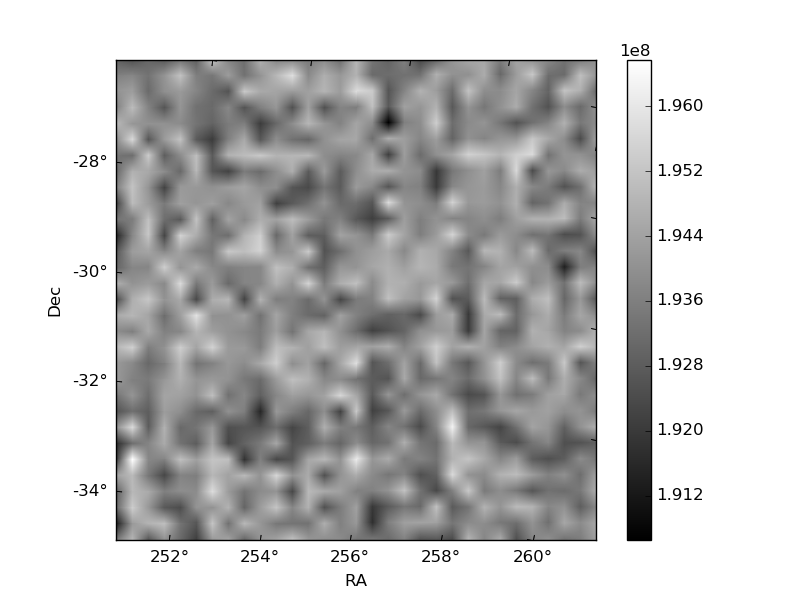
Quadrant B |
|---|---|---|---|
| Quadrant D | 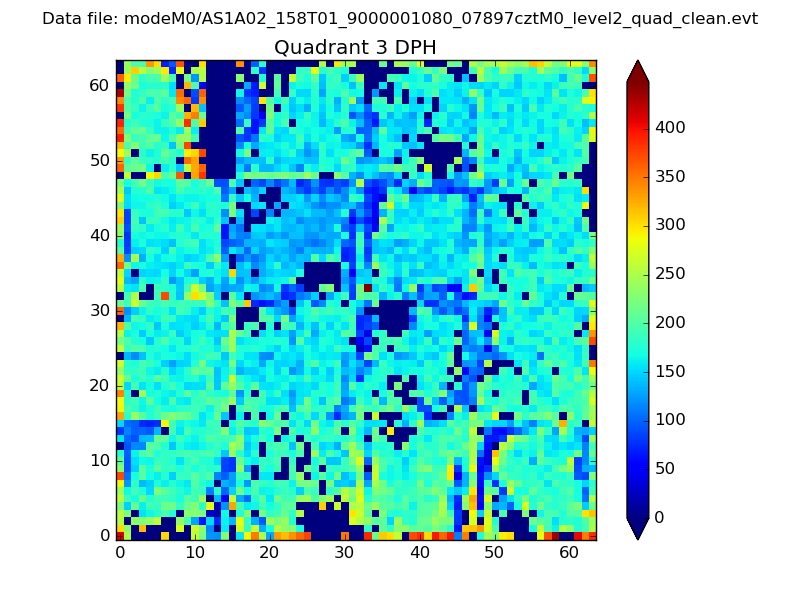 |
 |
Quadrant C |
| Plot type | Count rate plots | Images |
|---|---|---|
| Comparison with Poisson distribution Blue bars denote a histogram of data divided into 1 sec bins. Red curve is a Poisson curve with rate = median count rate of data. |
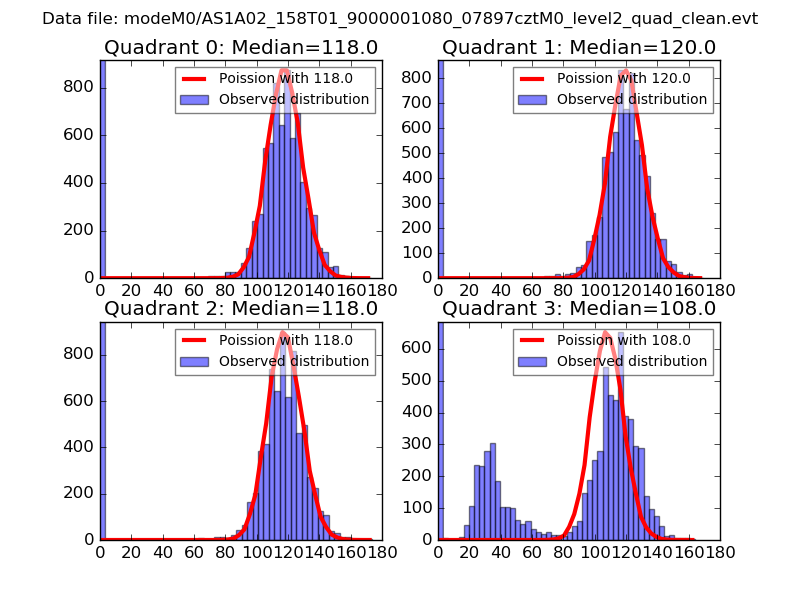 |
 |
| Quadrant-wise count rates Data is divided into 100 sec bins |
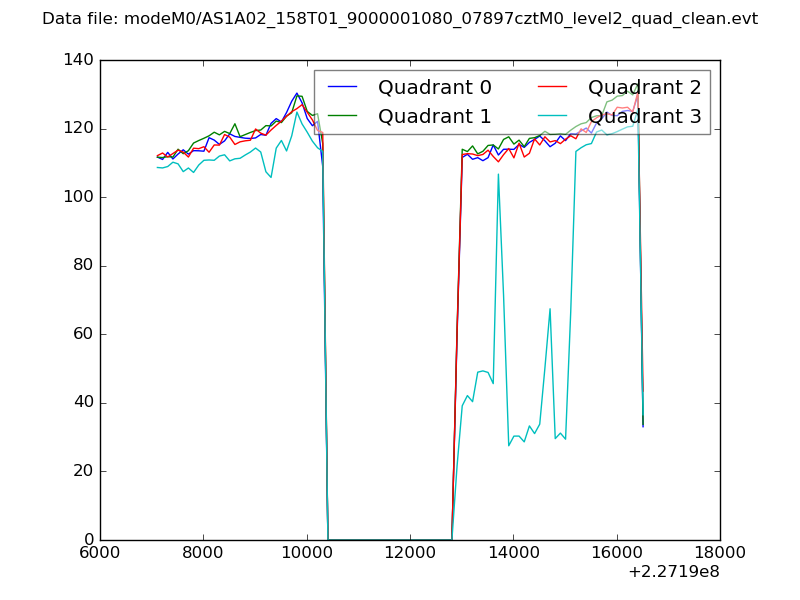 |
|
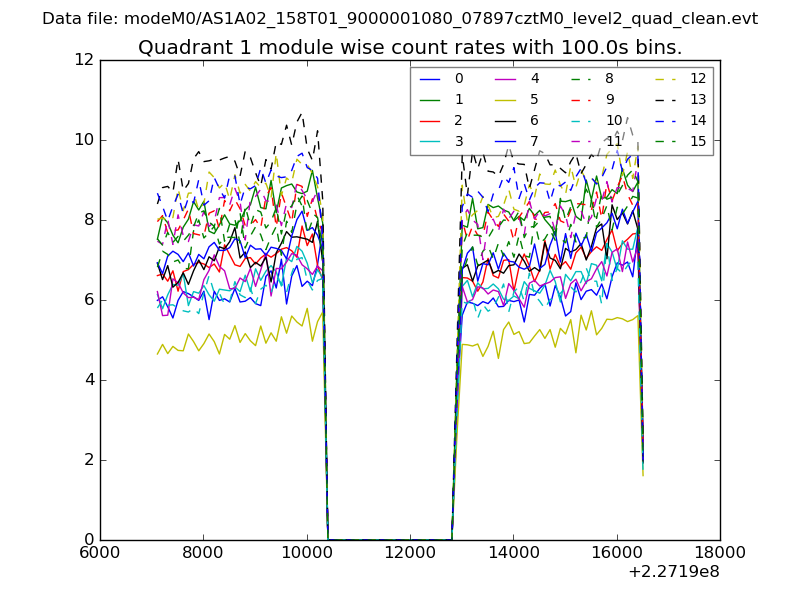
| Module-wise count rates for Quadrant A Data is divided into 100 sec bins |
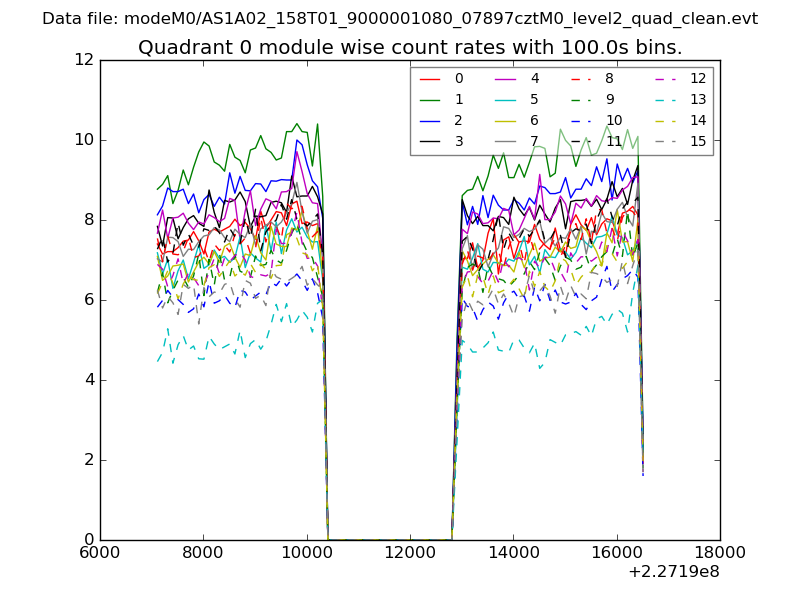 |
 |
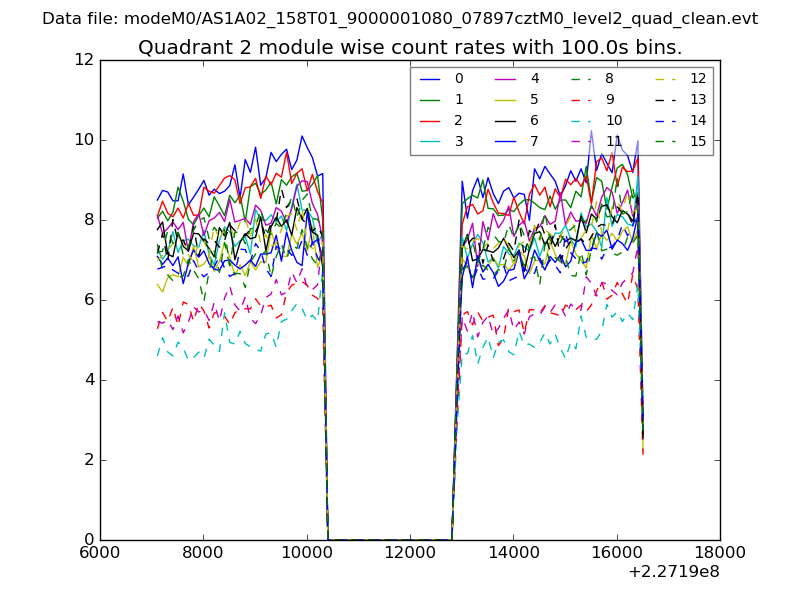
| Module-wise count rates for Quadrant B Data is divided into 100 sec bins |
 |
 |
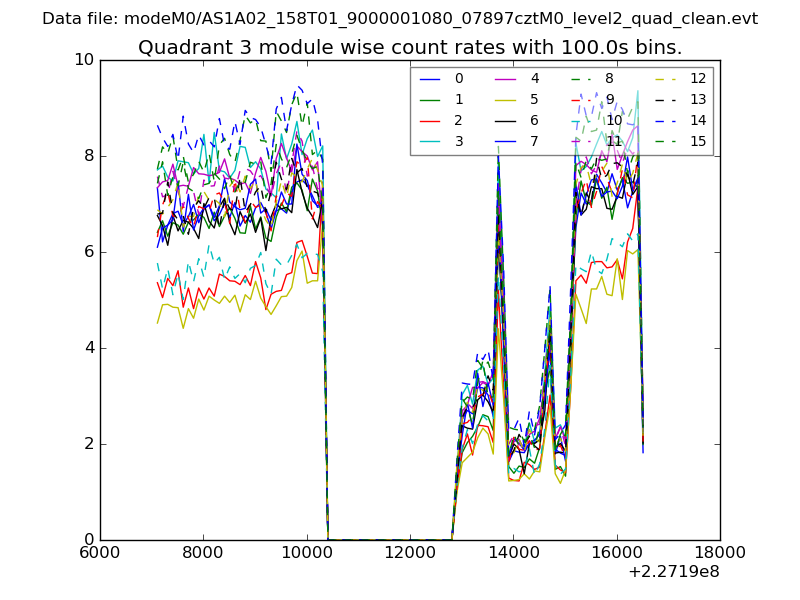
| Module-wise count rates for Quadrant C Data is divided into 100 sec bins |
 |
 |
| Module-wise count rates for Quadrant D Data is divided into 100 sec bins |
 |
 |
| Parameter | Plot |
|---|---|
| CZT HV Monitor | 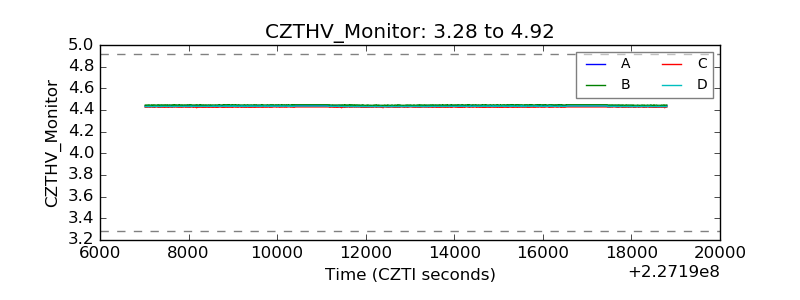 |
| D_VDD | 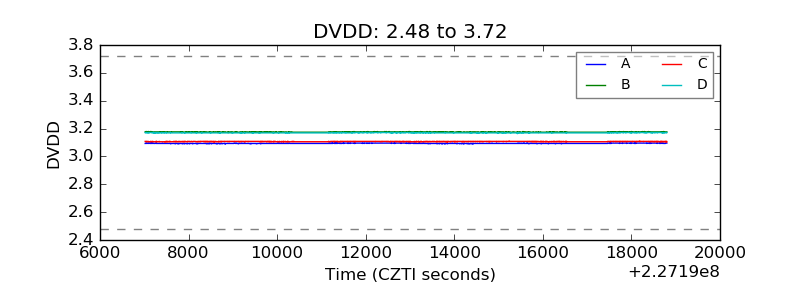 |
| Temperature 1 | 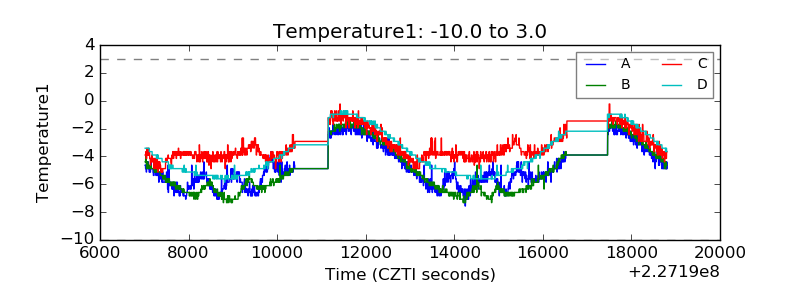 |
| Veto HV Monitor | 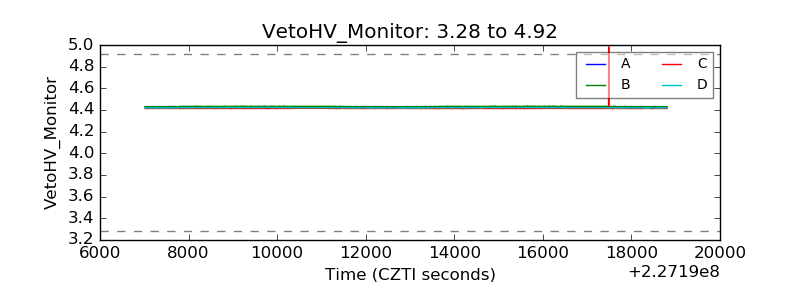 |
| Veto LLD | 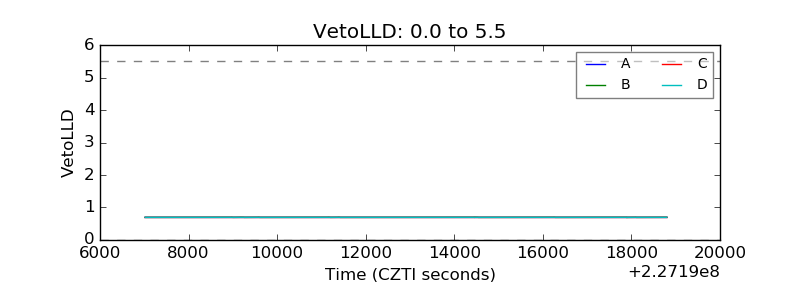 |
| Alpha Counter | 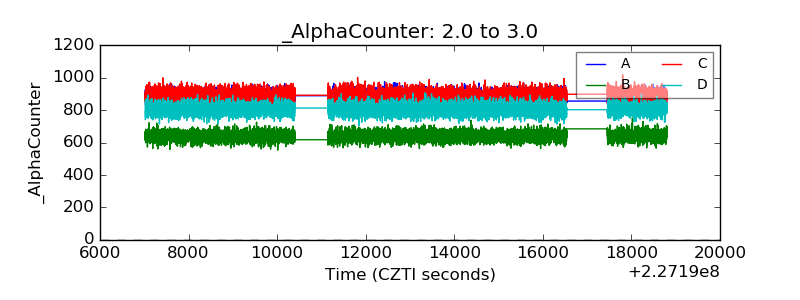 |
| _CPM_Rate | 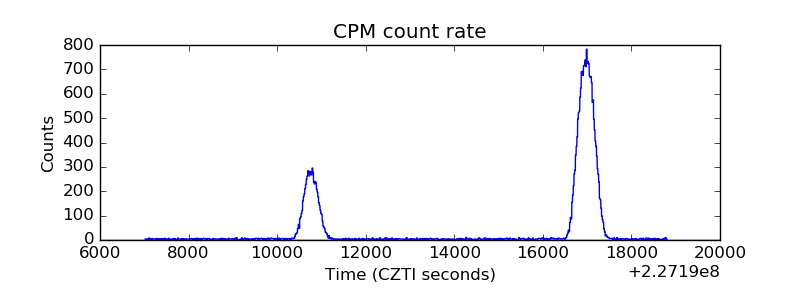 |
| CZT Counter | 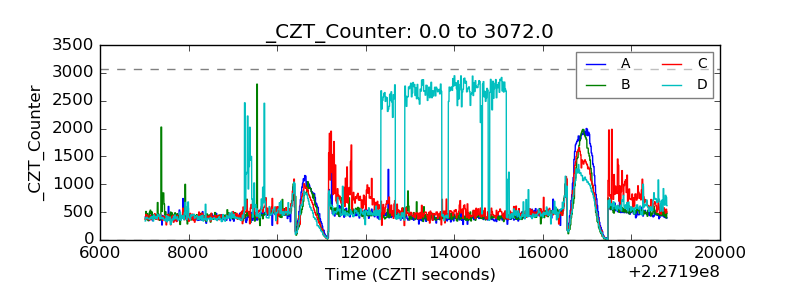 |
| +2.5 Volts monitor |  |
| +5 Volts monitor |  |
| _ROLL_ROT | 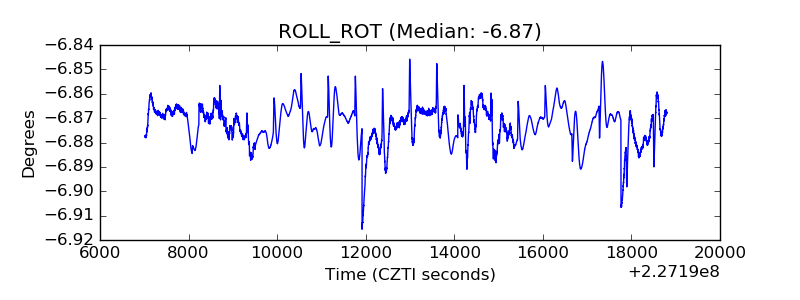 |
| _Roll_DEC | 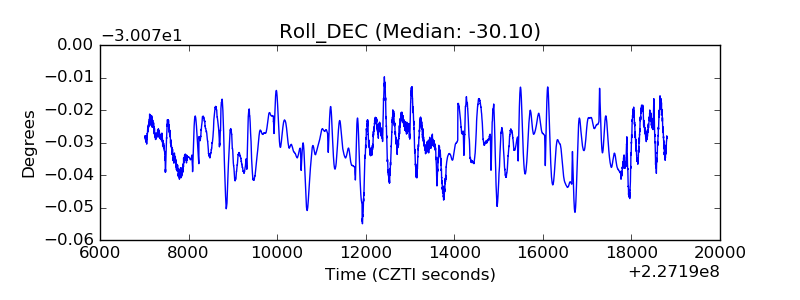 |
| _Roll_RA | 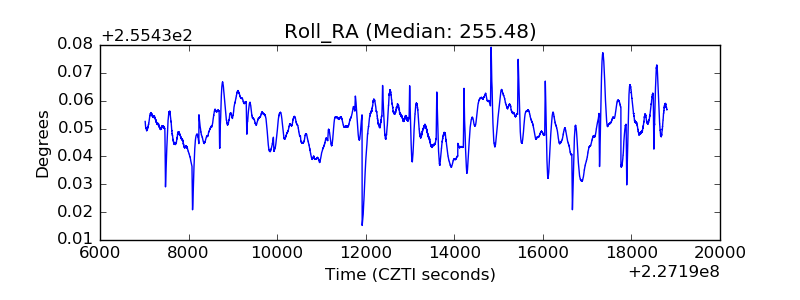 |
| Veto Counter | 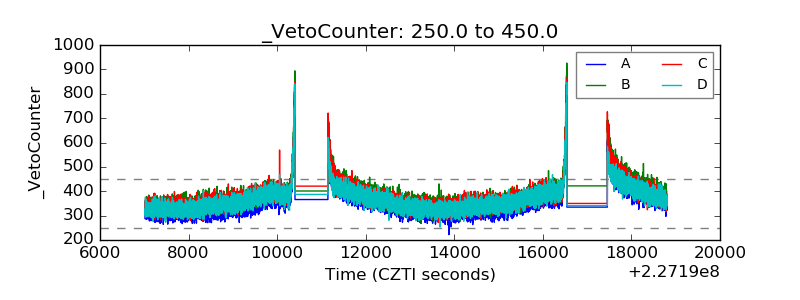 |