| Param | Original file | Final file |
|---|---|---|
| Filename | modeM0/AS1A02_158T01_9000001080_07900cztM0_level2.evt | modeM0/AS1A02_158T01_9000001080_07900cztM0_level2_quad_clean.evt |
| Size (bytes) | 474,739,200 | 87,056,640 |
| Size | 452.7 MB | 83.0 MB |
| Events in quadrant A | 2,970,914 | 555,000 |
| Events in quadrant B | 3,201,476 | 567,829 |
| Events in quadrant C | 3,955,386 | 553,971 |
| Events in quadrant D | 3,827,910 | 525,579 |
| Mode SS | |||
|---|---|---|---|
| Quadrant | BADHDUFLAG | Total packets | Discarded packets |
| A | 0 | 126 | 0 |
| B | 0 | 126 | 0 |
| C | 0 | 126 | 0 |
| D | 0 | 126 | 0 |
| Mode M9 | |||
|---|---|---|---|
| Quadrant | BADHDUFLAG | Total packets | Discarded packets |
| A | 0 | 12 | 0 |
| B | 0 | 12 | 0 |
| C | 0 | 12 | 0 |
| D | 0 | 12 | 0 |
| Mode M0 | |||
|---|---|---|---|
| Quadrant | BADHDUFLAG | Total packets | Discarded packets |
| A | 0 | 12920 | 2 |
| B | 0 | 13656 | 1 |
| C | 0 | 15791 | 1 |
| D | 0 | 15342 | 1 |
| Quadrant | Total seconds | Saturated seconds | Saturation percentage |
|---|---|---|---|
| A | 6218 | 42 | 0.675458% |
| B | 6218 | 64 | 1.029270% |
| C | 6218 | 62 | 0.997105% |
| D | 6218 | 109 | 1.752975% |
Noise dominated data is calculated using 1-second bins in cleaned event files. If a bin has >2000 counts, and if more than 50% of those come from <1% of pixels, then it is considered to be noise-dominated and hence unusable.
| Quadrant | # 1 sec bins | Bins with >0 counts | Bins with >2000 counts | High rate bins dominated by noise | Noise dominated (total time) | Noise dominated (detector-on time) | Marked lightcurve |
|---|---|---|---|---|---|---|---|
| A | 7403 | 6219 | 1 | 1 | 0.01% | 0.02% | 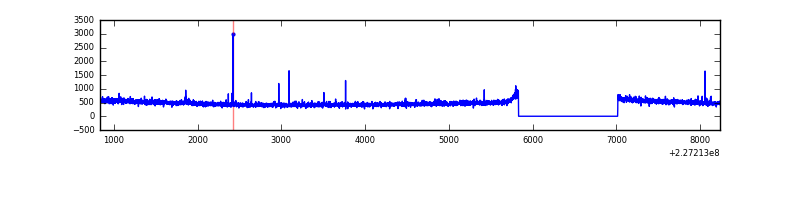 |
| B | 7403 | 6219 | 11 | 11 | 0.15% | 0.18% | 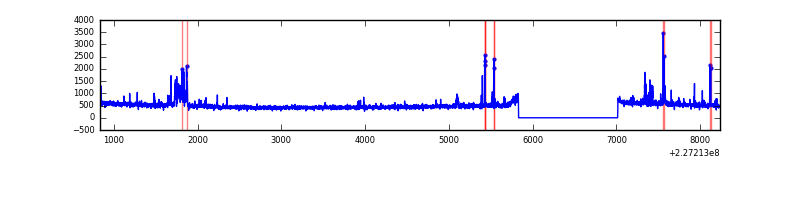 |
| C | 7403 | 6219 | 5 | 5 | 0.07% | 0.08% | 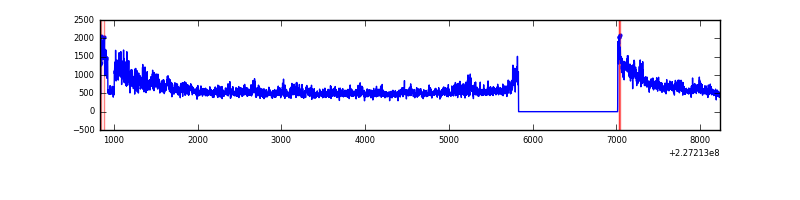 |
| D | 7403 | 6219 | 66 | 66 | 0.89% | 1.06% | 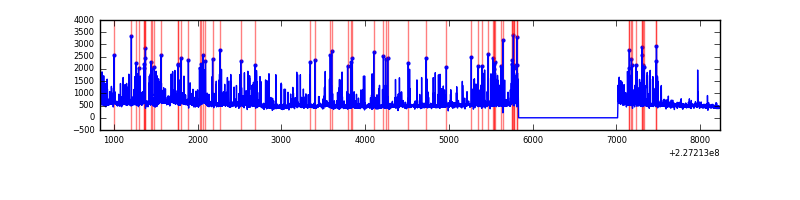 |
Top three noisy pixels from each quadrant. If the there are fewer than three noisy pixels in the level2.evt file, extra rows are filled as -1
| Pixel properties | Quadrant properties | ||||||
|---|---|---|---|---|---|---|---|
| Quadrant | DetID | PixID | Counts | Sigma | Mean | Median | Sigma |
| A | 8 | 15 | 26126 | 165.81 | 755 | 740 | 153.1 |
| A | 15 | 239 | 17618 | 110.24 | 755 | 740 | 153.1 |
| A | 15 | 223 | 12259 | 75.24 | 755 | 740 | 153.1 |
| B | 5 | 255 | 105487 | 720.87 | 765 | 746 | 145.3 |
| B | 4 | 239 | 84410 | 575.81 | 765 | 746 | 145.3 |
| B | 4 | 81 | 16450 | 108.08 | 765 | 746 | 145.3 |
| C | 1 | 16 | 1072158 | 6253.18 | 734 | 738 | 171.3 |
| C | 9 | 68 | 17035 | 95.11 | 734 | 738 | 171.3 |
| C | 13 | 61 | 5706 | 28.99 | 734 | 738 | 171.3 |
| D | 1 | 20 | 912501 | 5154.79 | 725 | 703 | 176.9 |
| D | 1 | 52 | 104629 | 587.54 | 725 | 703 | 176.9 |
| D | 2 | 234 | 19110 | 104.06 | 725 | 703 | 176.9 |
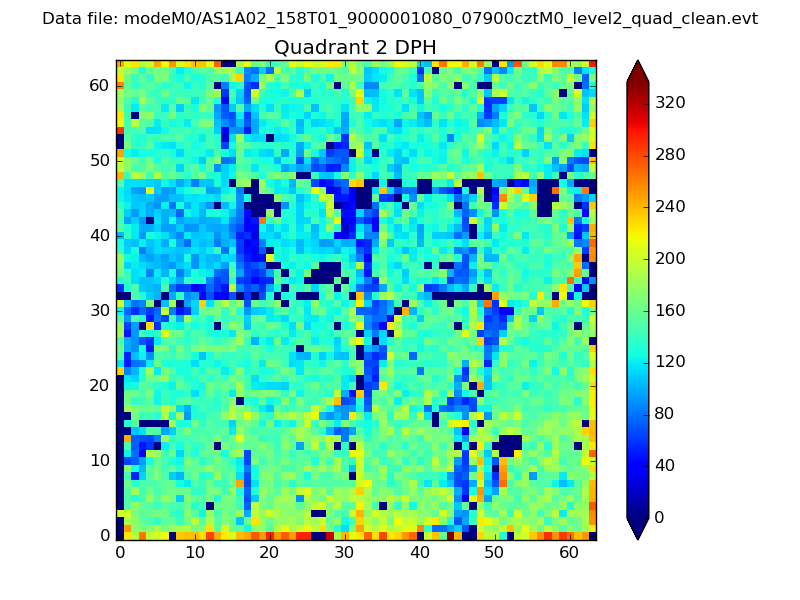
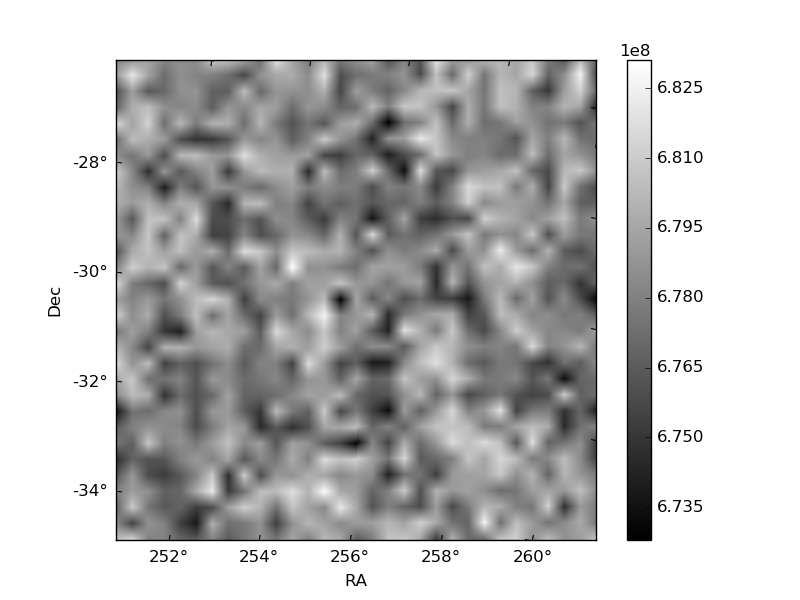
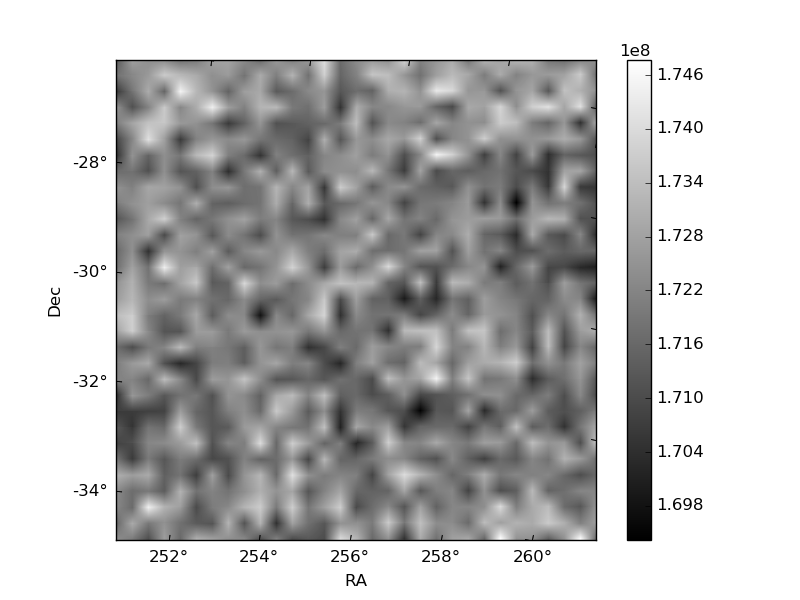
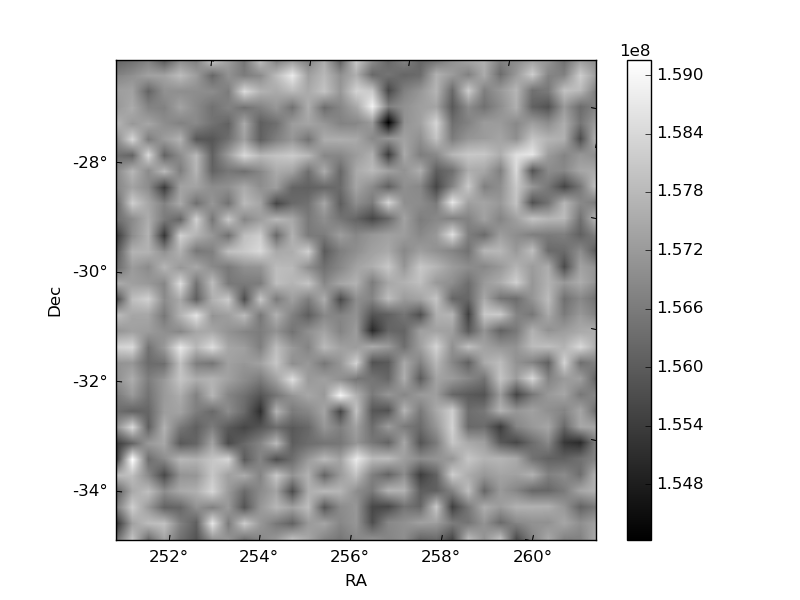
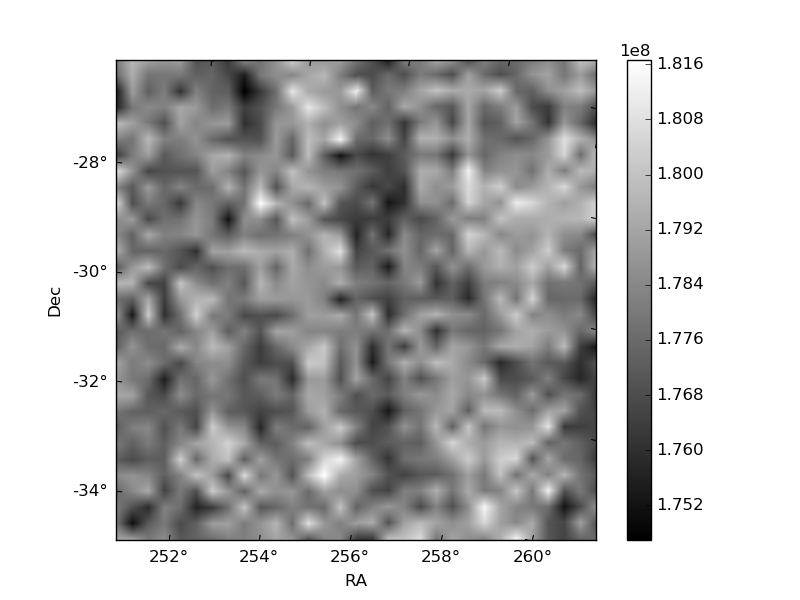
Histogram calculated using DETX and DETY for each event in the final _common_clean file
| Quadrant A | 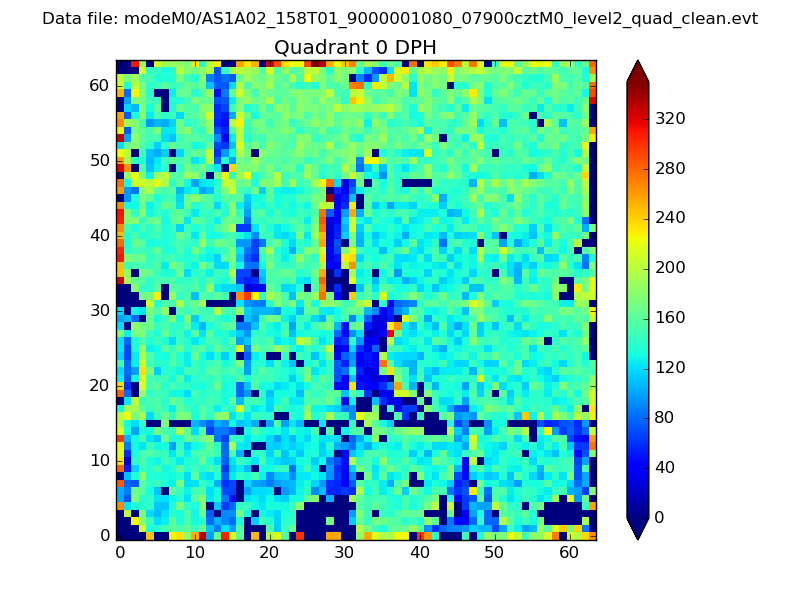 |
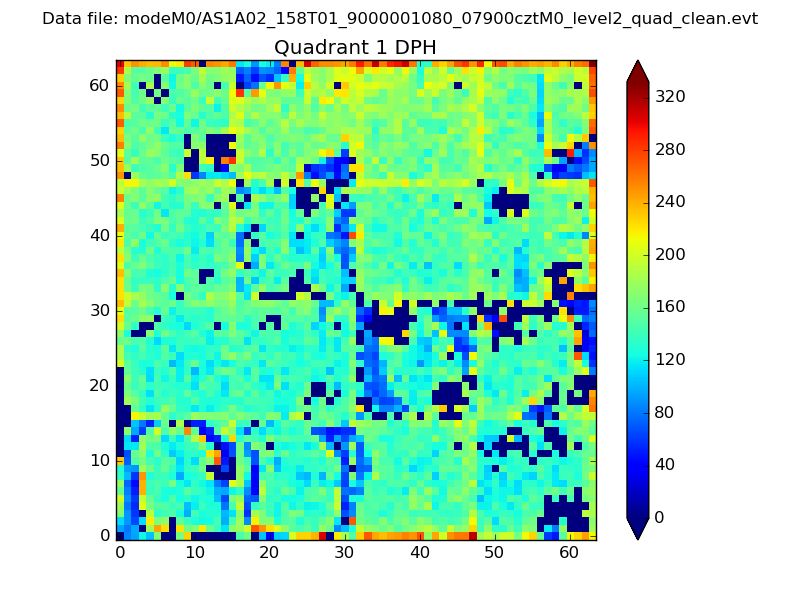 |
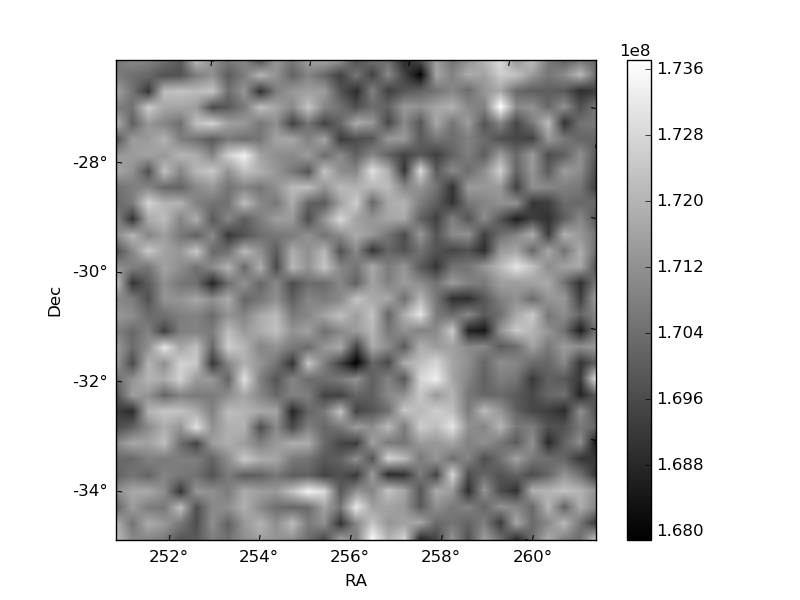
Quadrant B |
|---|---|---|---|
| Quadrant D | 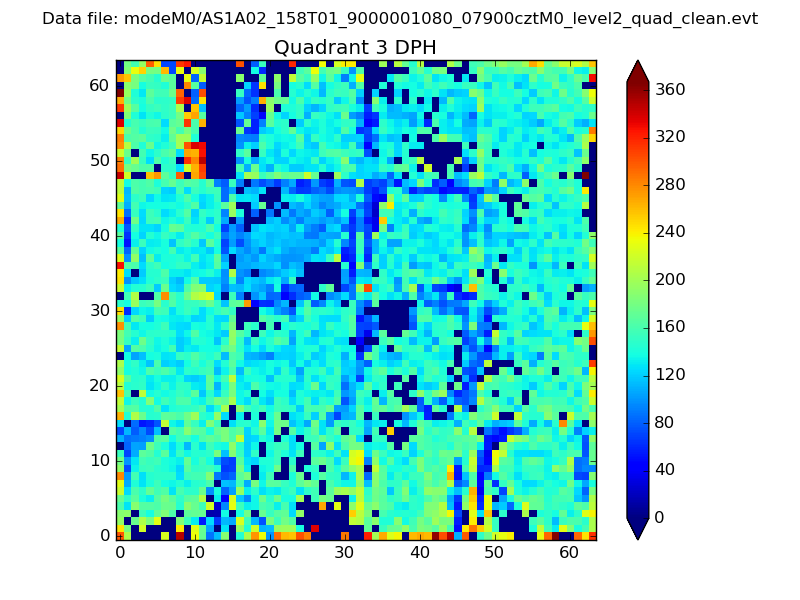 |
 |
Quadrant C |
| Plot type | Count rate plots | Images |
|---|---|---|
| Comparison with Poisson distribution Blue bars denote a histogram of data divided into 1 sec bins. Red curve is a Poisson curve with rate = median count rate of data. |
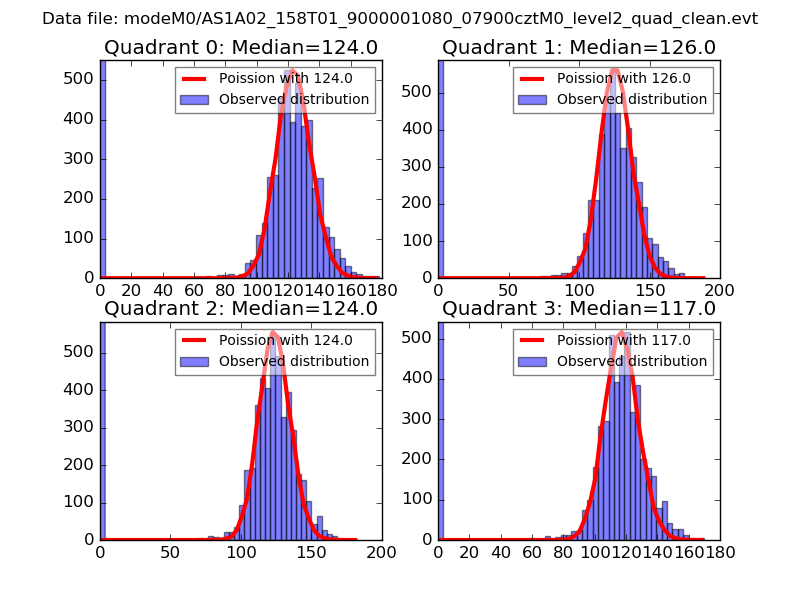 |
 |
| Quadrant-wise count rates Data is divided into 100 sec bins |
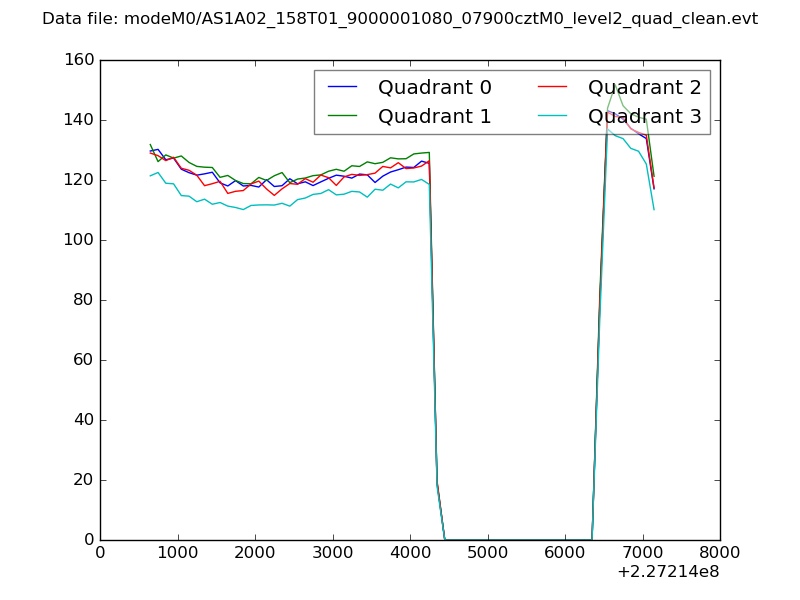 |
|
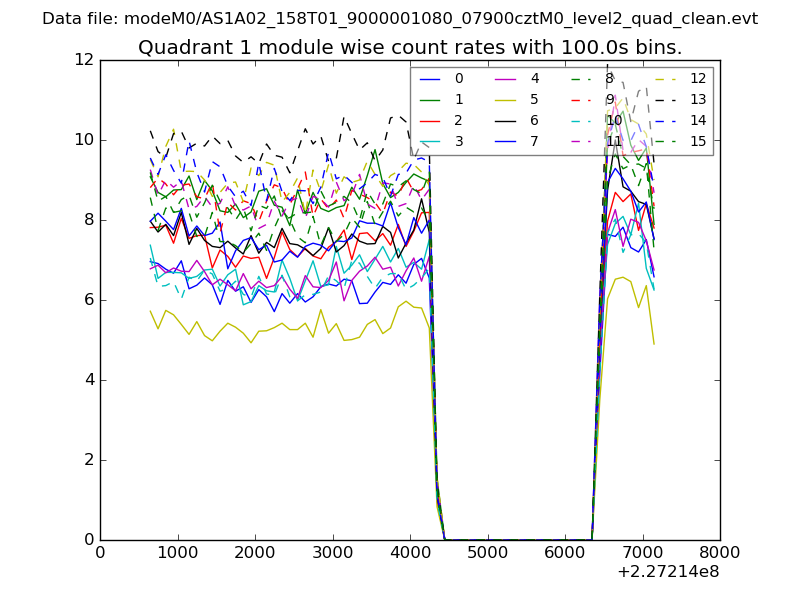
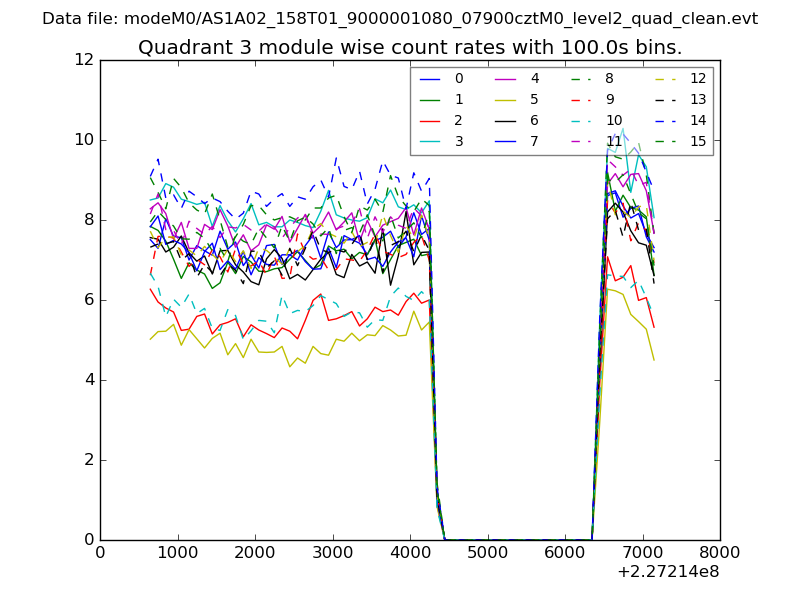
| Module-wise count rates for Quadrant A Data is divided into 100 sec bins |
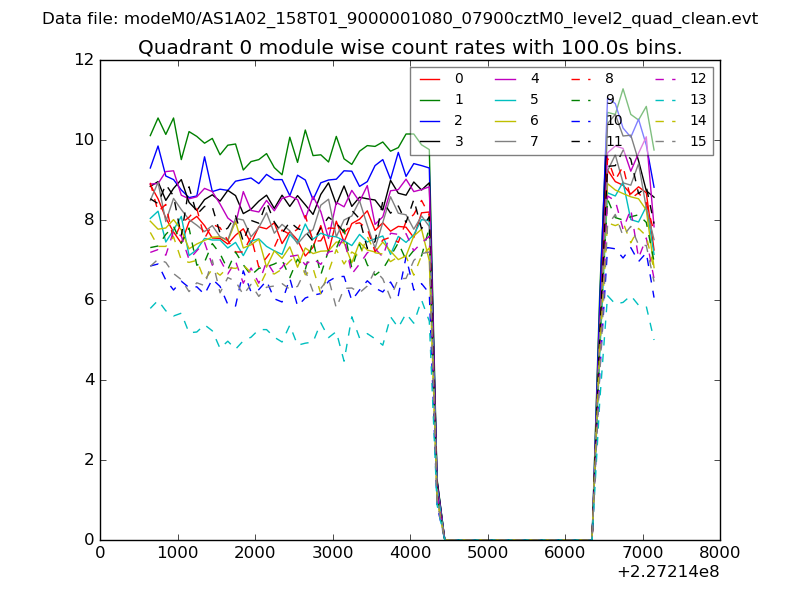 |
 |
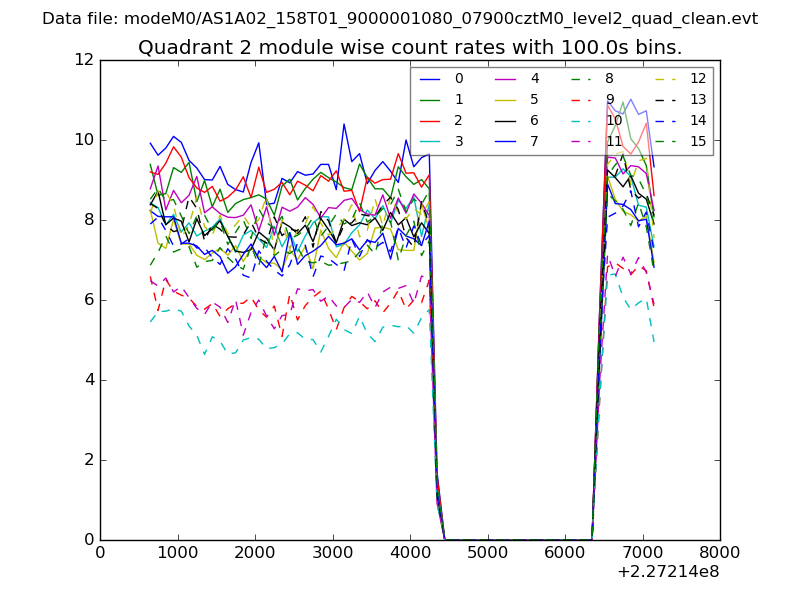
| Module-wise count rates for Quadrant B Data is divided into 100 sec bins |
 |
 |
| Module-wise count rates for Quadrant C Data is divided into 100 sec bins |
 |
 |
| Module-wise count rates for Quadrant D Data is divided into 100 sec bins |
 |
 |
| Parameter | Plot |
|---|---|
| CZT HV Monitor | 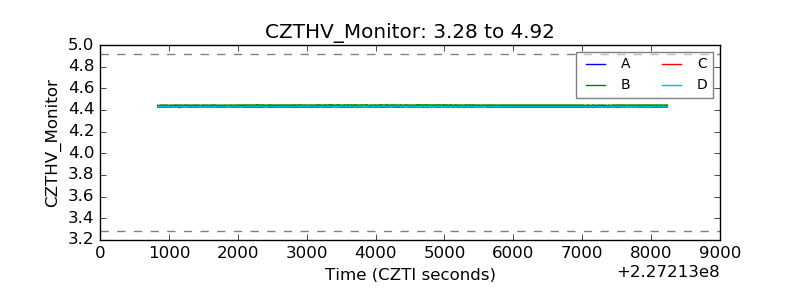 |
| D_VDD | 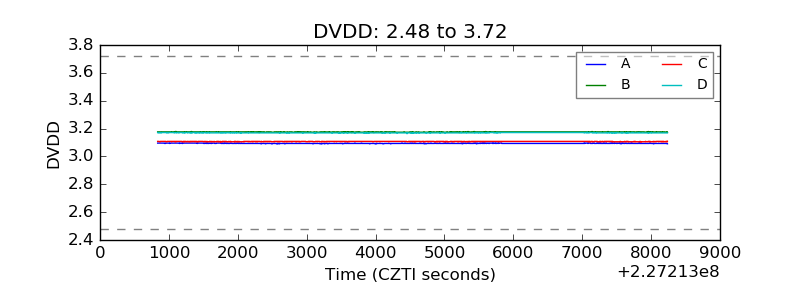 |
| Temperature 1 | 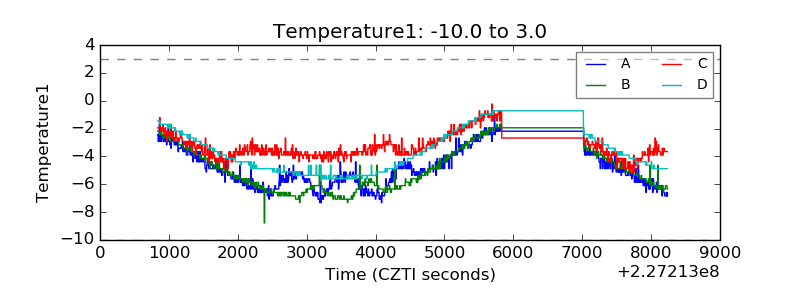 |
| Veto HV Monitor | 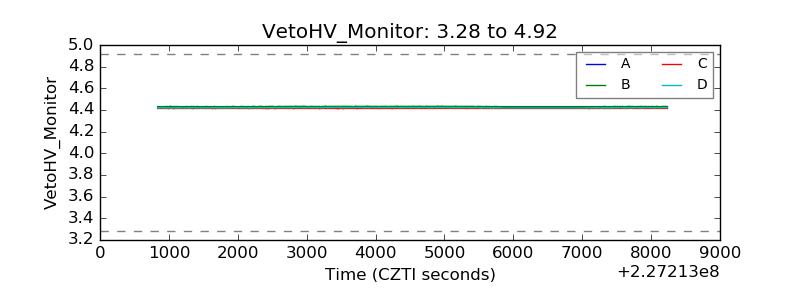 |
| Veto LLD | 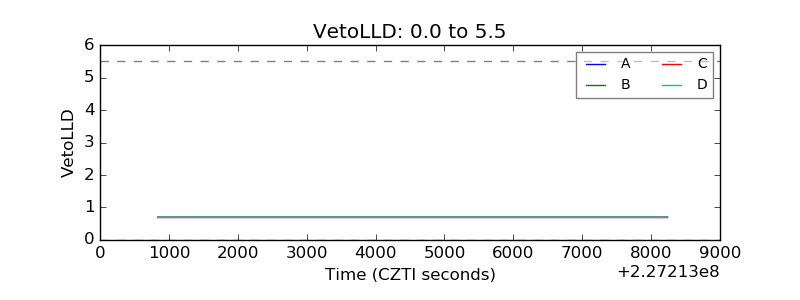 |
| Alpha Counter | 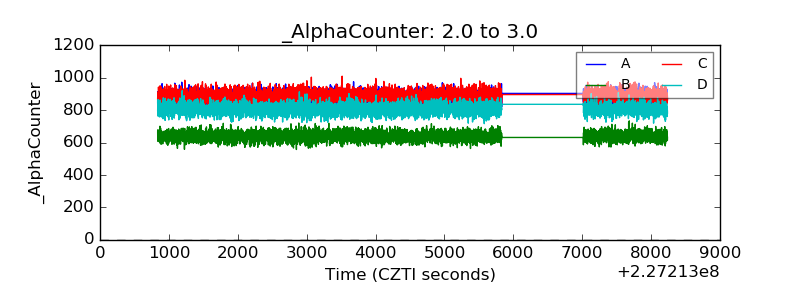 |
| _CPM_Rate | 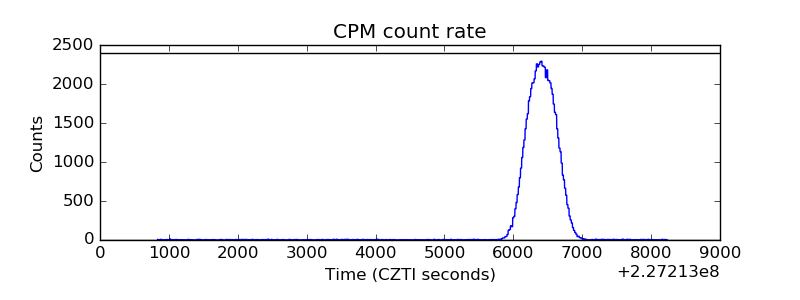 |
| CZT Counter | 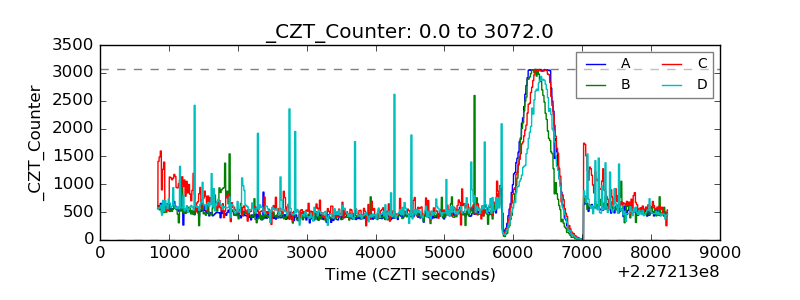 |
| +2.5 Volts monitor |  |
| +5 Volts monitor | 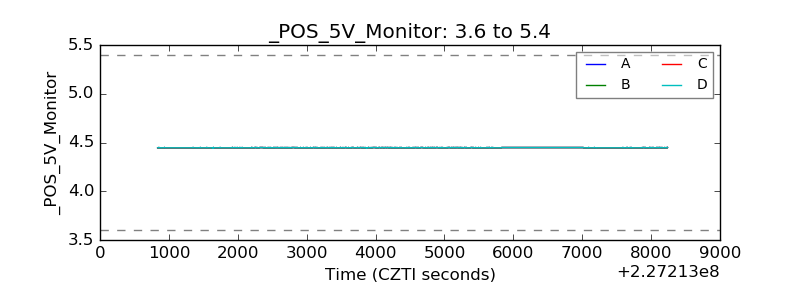 |
| _ROLL_ROT | 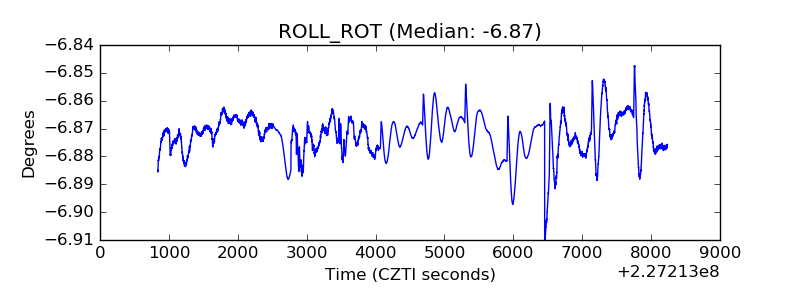 |
| _Roll_DEC | 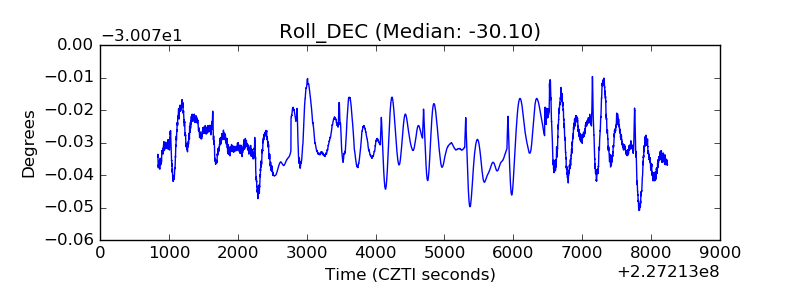 |
| _Roll_RA | 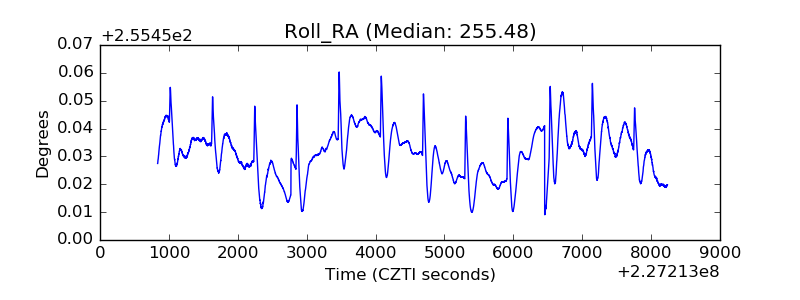 |
| Veto Counter | 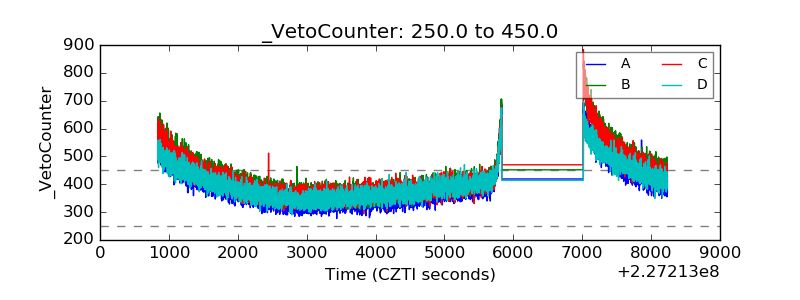 |