| Param | Original file | Final file |
|---|---|---|
| Filename | modeM0/AS1A02_027T01_9000001084cztM0_level2.fits | modeM0/AS1A02_027T01_9000001084cztM0_level2_quad_clean.evt |
| Size (bytes) | 926,740,800 | 989,193,600 |
| Size | 883.8 MB | 943.4 MB |
| Events in quadrant A | 5,525,430 | 5,872,222 |
| Events in quadrant B | 5,436,502 | 6,006,619 |
| Events in quadrant C | 5,554,858 | 5,910,094 |
| Events in quadrant D | 4,774,334 | 5,397,232 |
| Mode SS | |||
|---|---|---|---|
| Quadrant | BADHDUFLAG | Total packets | Discarded packets |
| A | 0 | 2010 | 0 |
| B | 0 | 2010 | 0 |
| C | 0 | 2011 | 0 |
| D | 0 | 2010 | 0 |
| Mode M0 | |||
|---|---|---|---|
| Quadrant | BADHDUFLAG | Total packets | Discarded packets |
| A | 0 | 208359 | 0 |
| B | 0 | 215309 | 0 |
| C | 0 | 234361 | 0 |
| D | 0 | 223259 | 0 |
| Mode M9 | |||
|---|---|---|---|
| Quadrant | BADHDUFLAG | Total packets | Discarded packets |
| A | 0 | 173 | 0 |
| B | 0 | 173 | 0 |
| C | 0 | 173 | 0 |
| D | 0 | 173 | 0 |
| Quadrant | Total seconds | Saturated seconds | Saturation percentage |
|---|---|---|---|
| A | 98842 | 1459 | 1.476093% |
| B | 98841 | 1915 | 1.937455% |
| C | 98838 | 1974 | 1.997208% |
| D | 98843 | 1727 | 1.747215% |
Noise dominated data is calculated using 1-second bins in cleaned event files. If a bin has >2000 counts, and if more than 50% of those come from <1% of pixels, then it is considered to be noise-dominated and hence unusable.
| Quadrant | # 1 sec bins | Bins with >0 counts | Bins with >2000 counts | High rate bins dominated by noise | Noise dominated (total time) | Noise dominated (detector-on time) | Marked lightcurve |
|---|---|---|---|---|---|---|---|
| A | 116099 | 98871 | 0 | 0 | 0.00% | 0.00% | 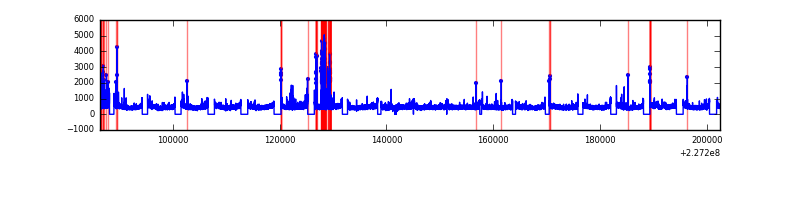 |
| B | 116099 | 98868 | 0 | 0 | 0.00% | 0.00% | 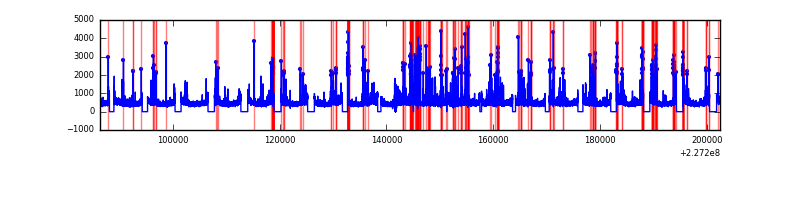 |
| C | 116099 | 98870 | 0 | 0 | 0.00% | 0.00% | 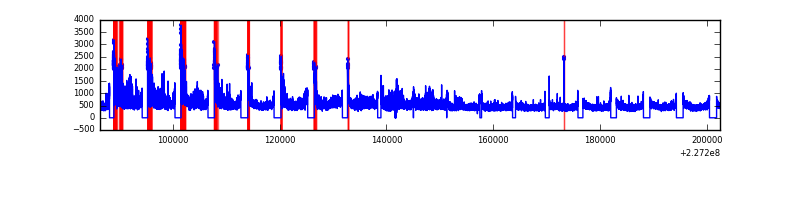 |
| D | 116099 | 98866 | 0 | 0 | 0.00% | 0.00% | 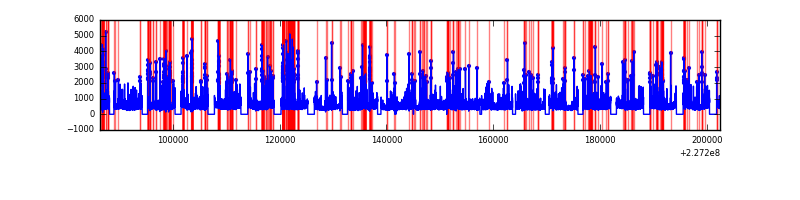 |
Top three noisy pixels from each quadrant. If the there are fewer than three noisy pixels in the level2.evt file, extra rows are filled as -1
| Pixel properties | Quadrant properties | ||||||
|---|---|---|---|---|---|---|---|
| Quadrant | DetID | PixID | Counts | Sigma | Mean | Median | Sigma |
| A | 0 | 29 | 5349 | 10.97 | 1438 | 1339 | 365.7 |
| A | 7 | 110 | 4674 | 9.12 | 1438 | 1339 | 365.7 |
| A | 0 | 30 | 4136 | 7.65 | 1438 | 1339 | 365.7 |
| B | 2 | 9 | 4836 | 12.53 | 1429 | 1360 | 277.4 |
| B | 2 | 8 | 3639 | 8.22 | 1429 | 1360 | 277.4 |
| B | 14 | 254 | 3623 | 8.16 | 1429 | 1360 | 277.4 |
| C | 1 | 80 | 4150 | 7.16 | 1467 | 1357 | 390.0 |
| C | 1 | 81 | 4108 | 7.05 | 1467 | 1357 | 390.0 |
| C | 12 | 241 | 3853 | 6.4 | 1467 | 1357 | 390.0 |
| D | 6 | 231 | 3477 | 6.14 | 1365 | 1238 | 364.8 |
| D | 11 | 82 | 3380 | 5.87 | 1365 | 1238 | 364.8 |
| D | 7 | 5 | 3369 | 5.84 | 1365 | 1238 | 364.8 |
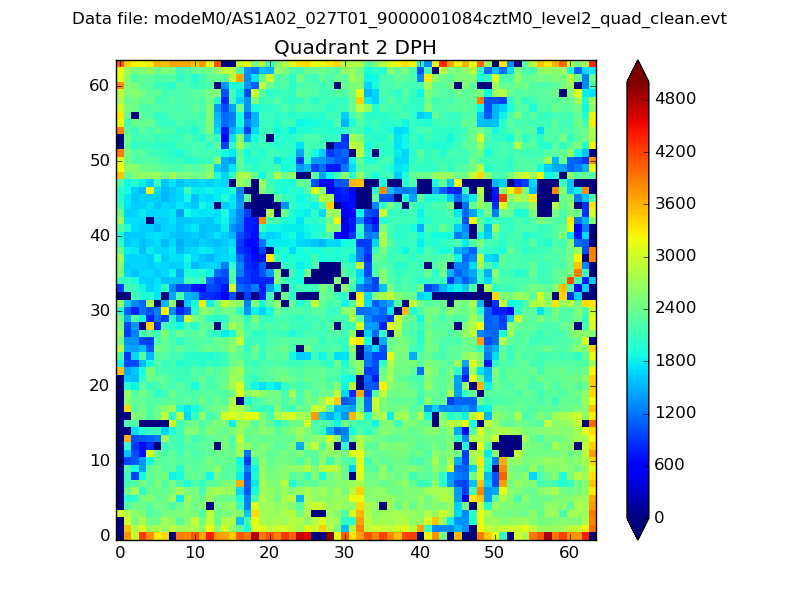
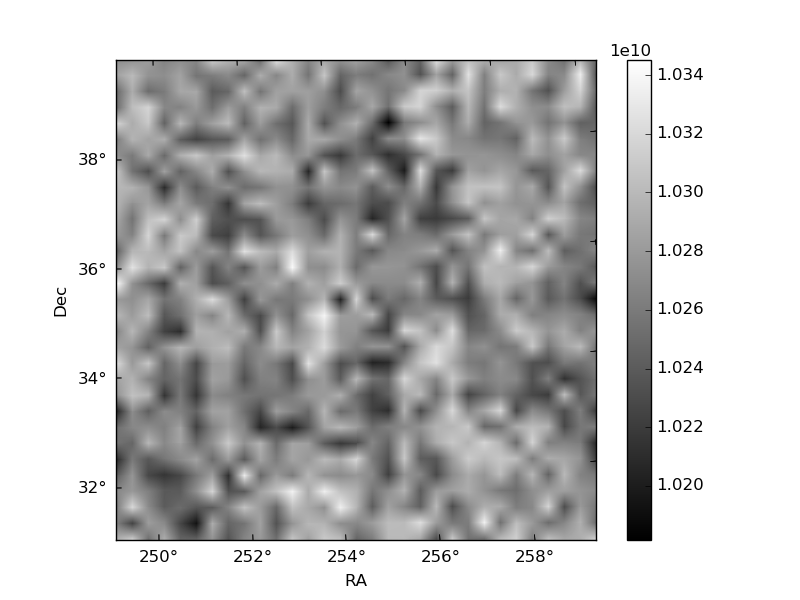
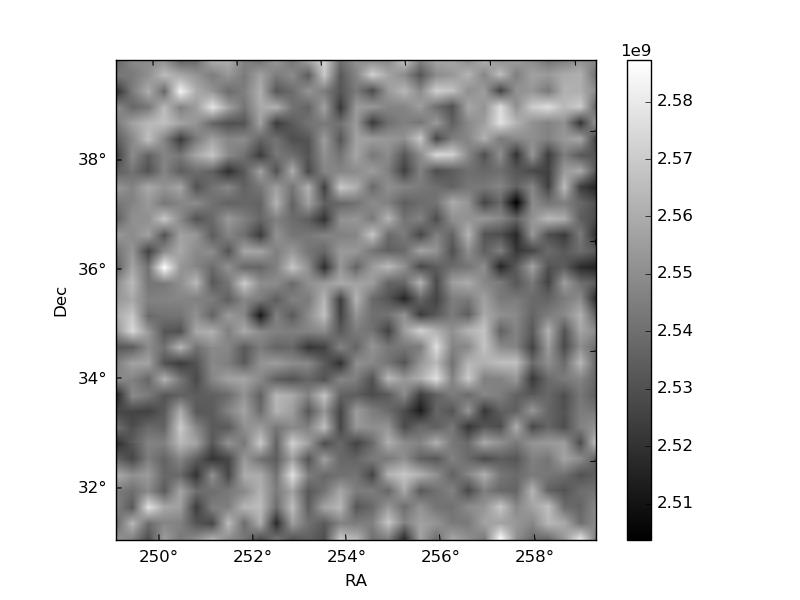
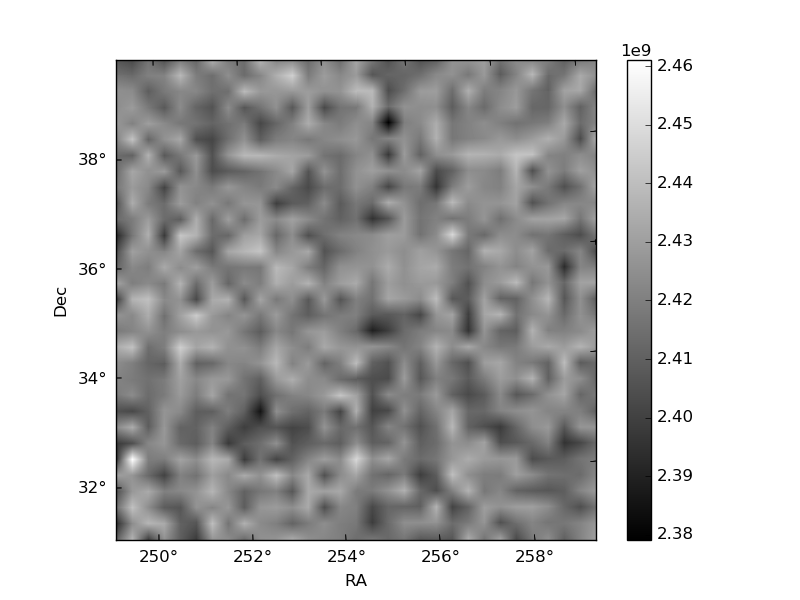
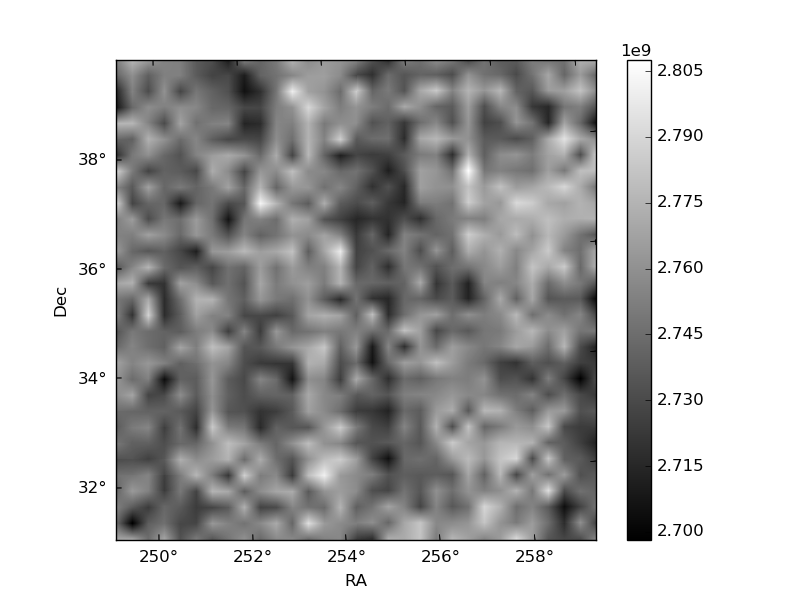
Histogram calculated using DETX and DETY for each event in the final _common_clean file
| Quadrant A | 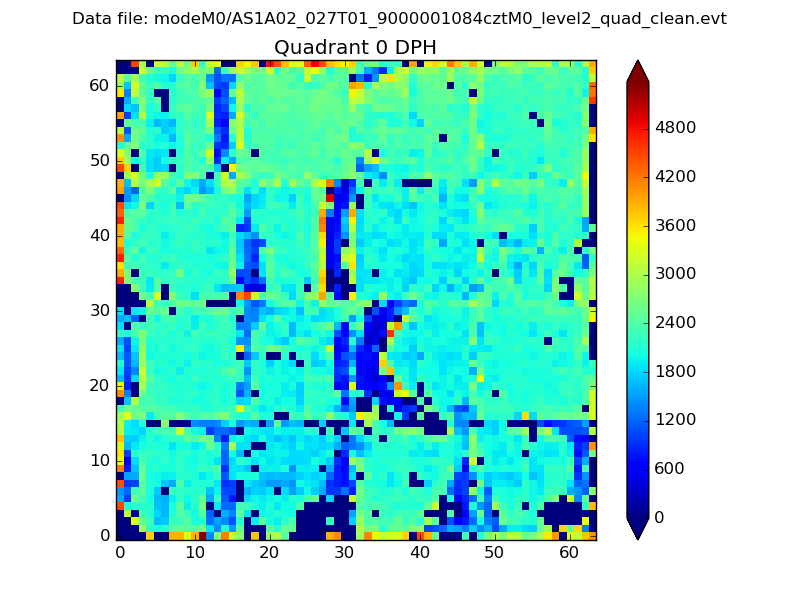 |
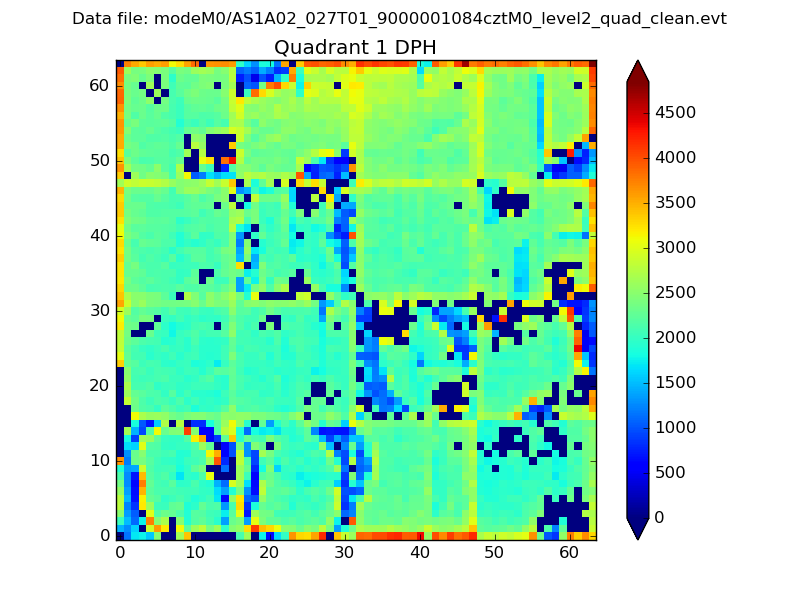 |
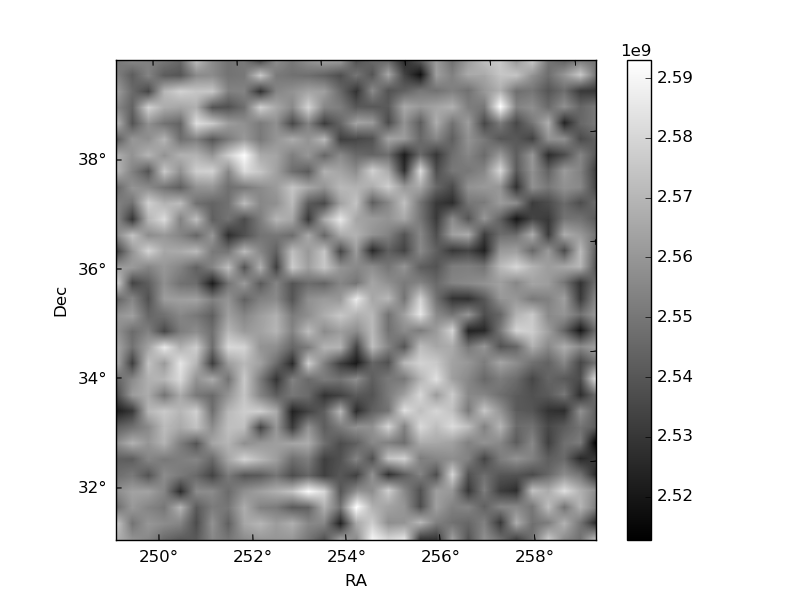
Quadrant B |
|---|---|---|---|
| Quadrant D | 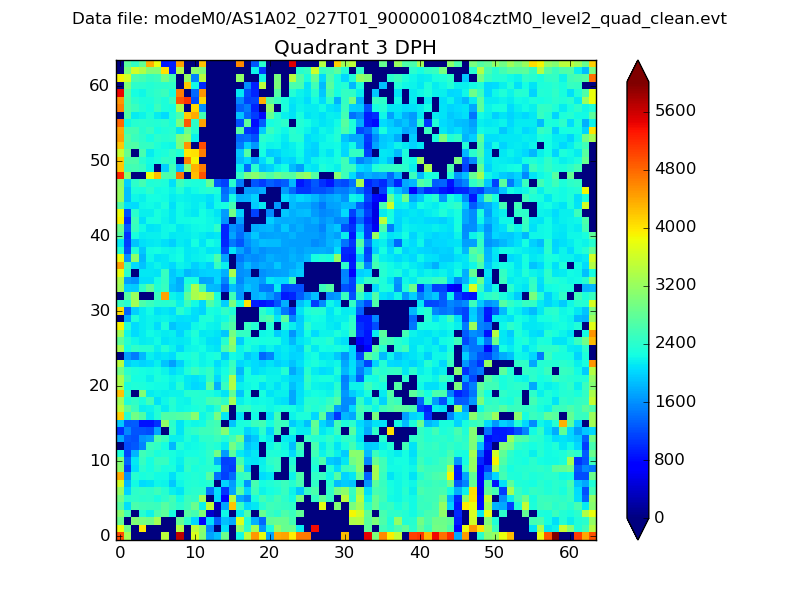 |
 |
Quadrant C |
| Plot type | Count rate plots | Images |
|---|---|---|
| Comparison with Poisson distribution Blue bars denote a histogram of data divided into 1 sec bins. Red curve is a Poisson curve with rate = median count rate of data. |
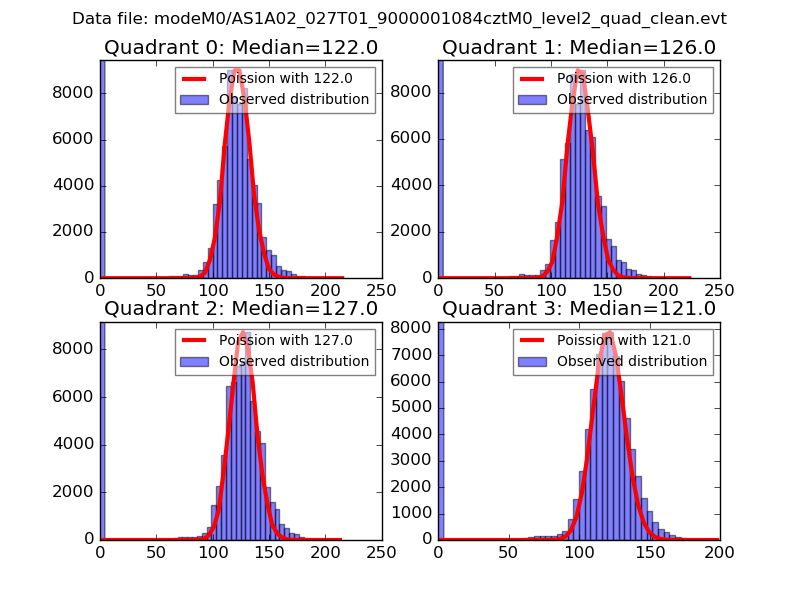 |
 |
| Quadrant-wise count rates Data is divided into 100 sec bins |
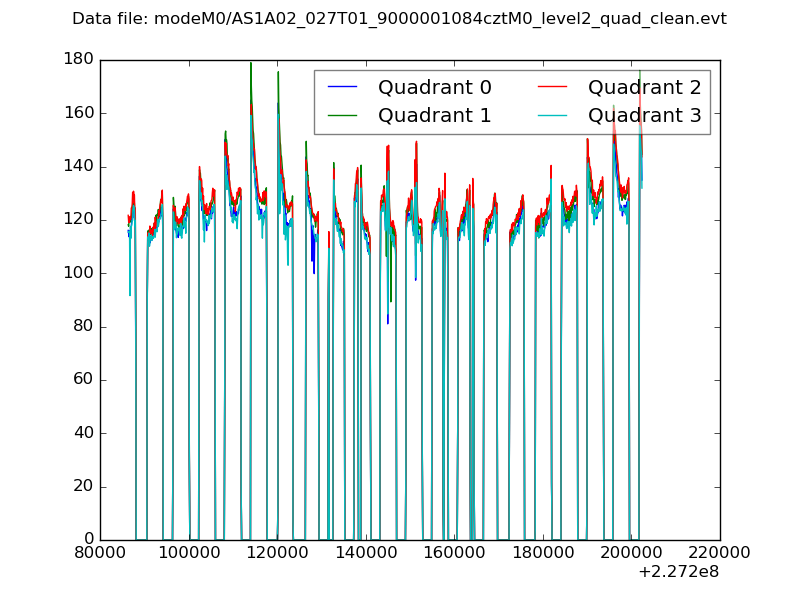 |
|
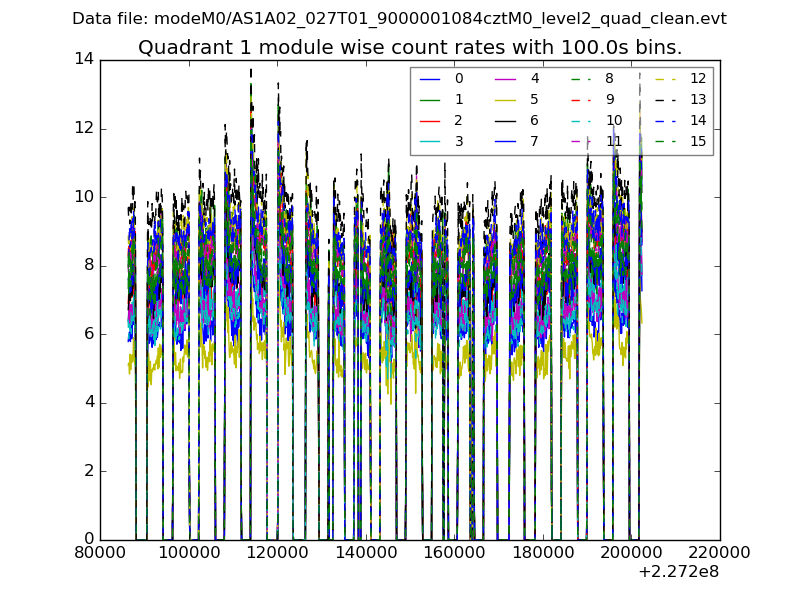
| Module-wise count rates for Quadrant A Data is divided into 100 sec bins |
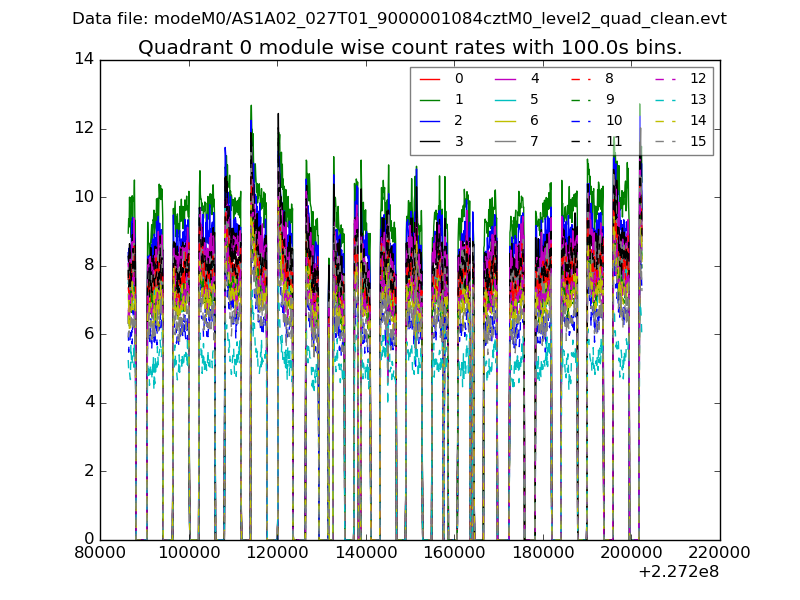 |
 |
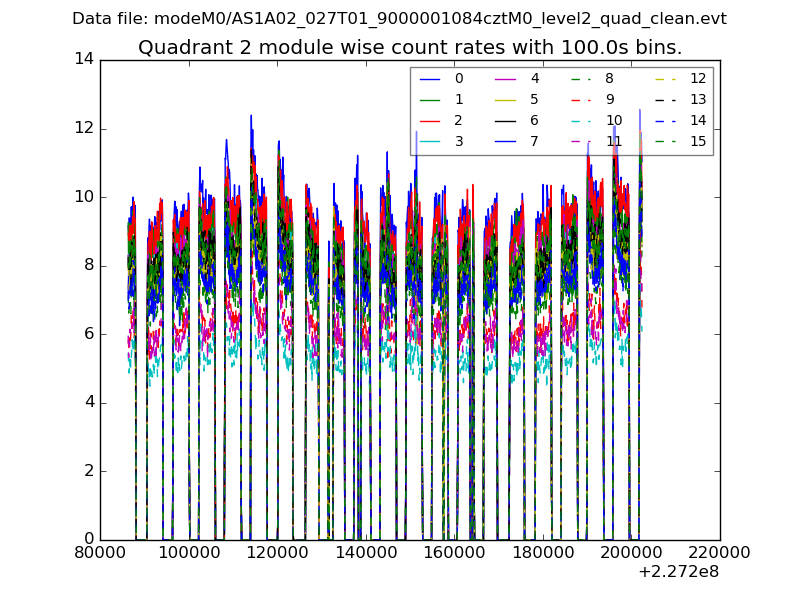
| Module-wise count rates for Quadrant B Data is divided into 100 sec bins |
 |
 |
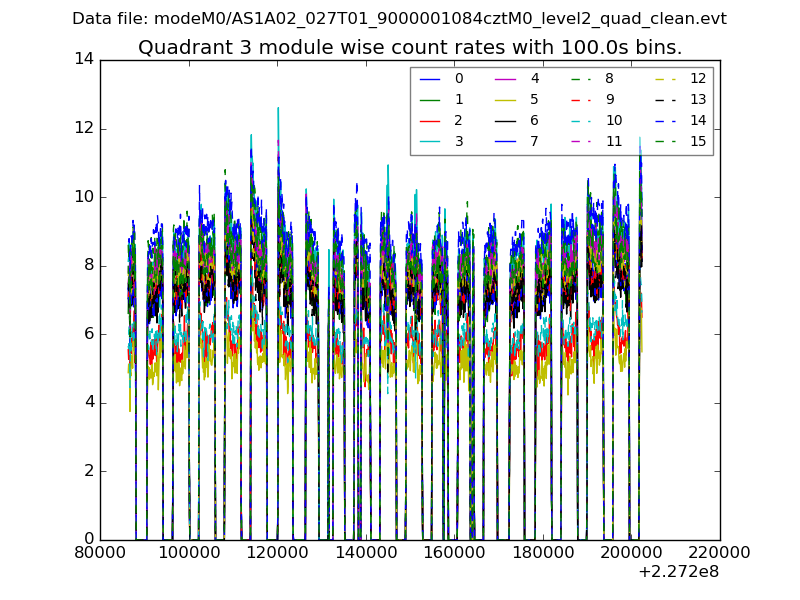
| Module-wise count rates for Quadrant C Data is divided into 100 sec bins |
 |
 |
| Module-wise count rates for Quadrant D Data is divided into 100 sec bins |
 |
 |
| Parameter | Plot |
|---|---|
| CZT HV Monitor | 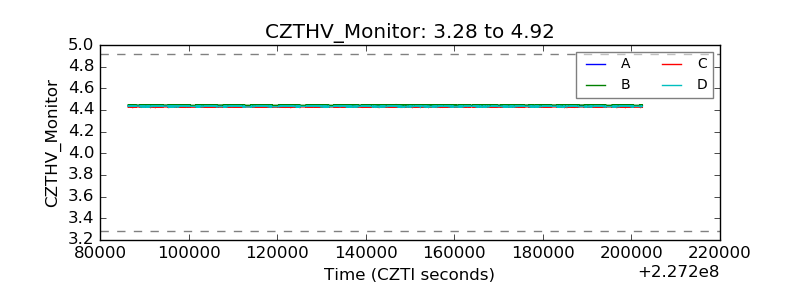 |
| D_VDD | 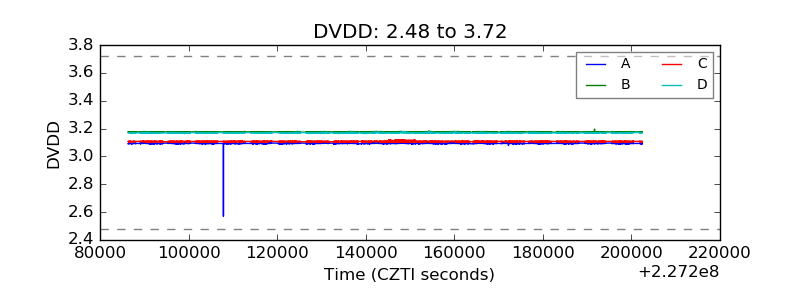 |
| Temperature 1 | 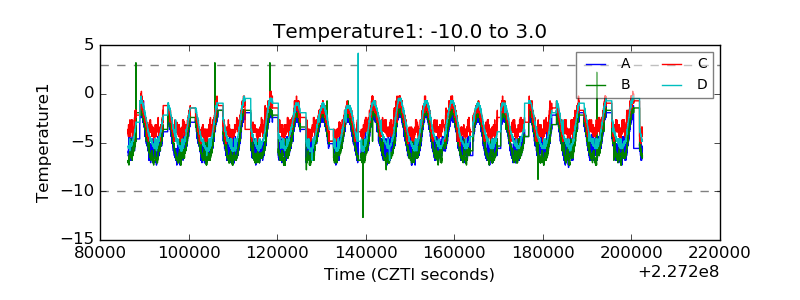 |
| Veto HV Monitor | 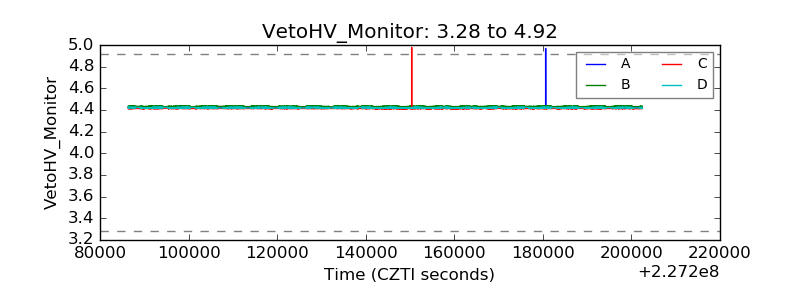 |
| Veto LLD | 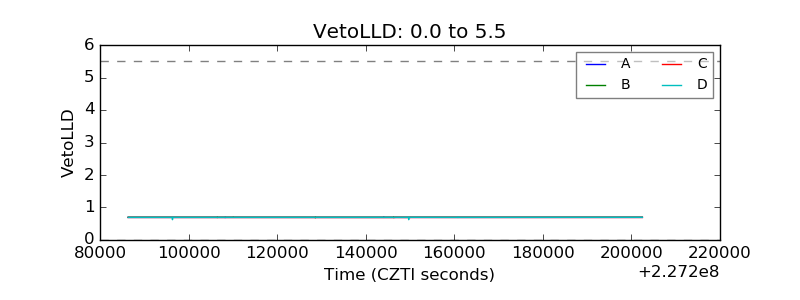 |
| Alpha Counter | 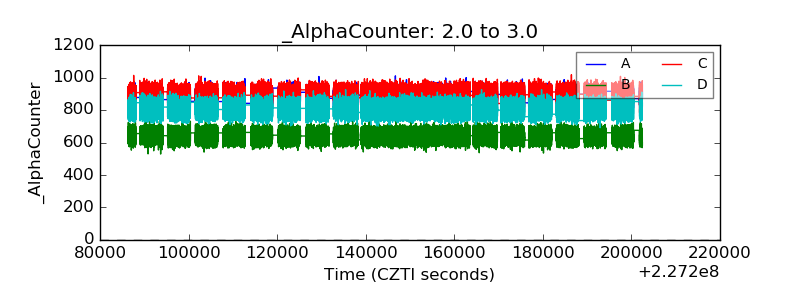 |
| _CPM_Rate | 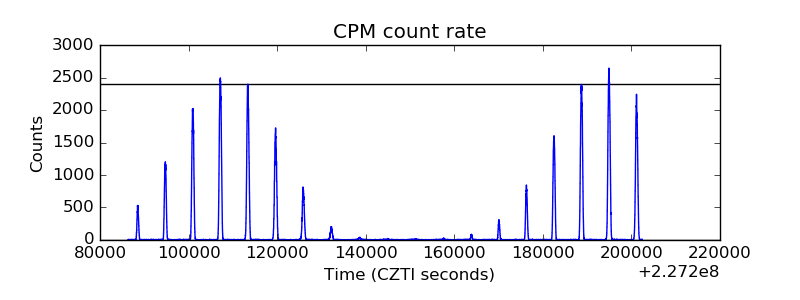 |
| CZT Counter | 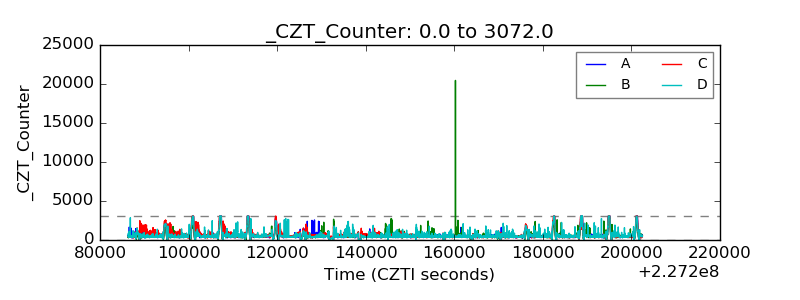 |
| +2.5 Volts monitor | 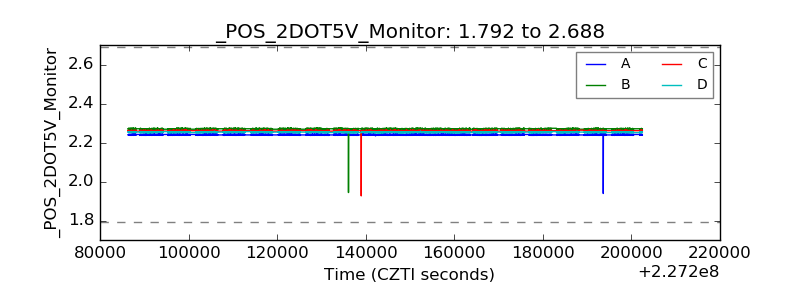 |
| +5 Volts monitor | 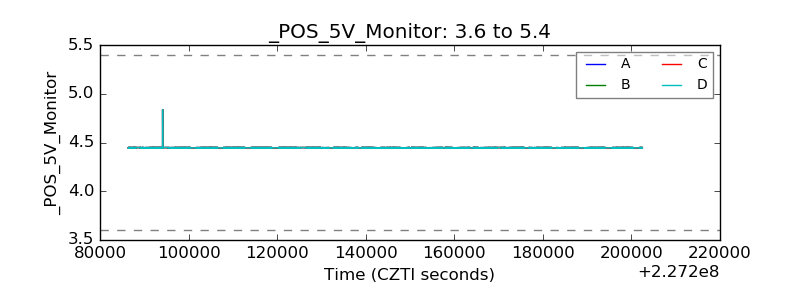 |
| _ROLL_ROT | 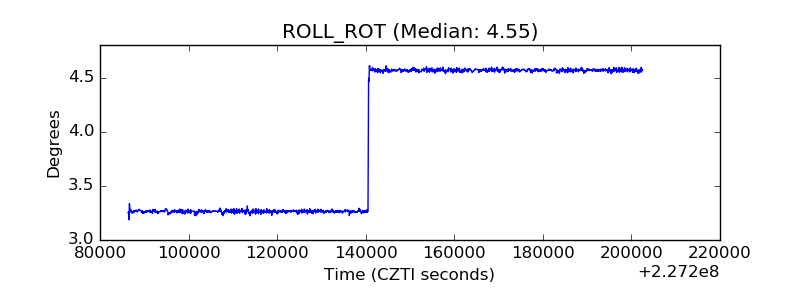 |
| _Roll_DEC | 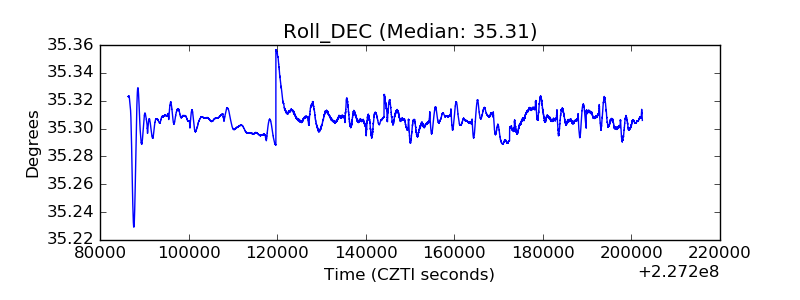 |
| _Roll_RA | 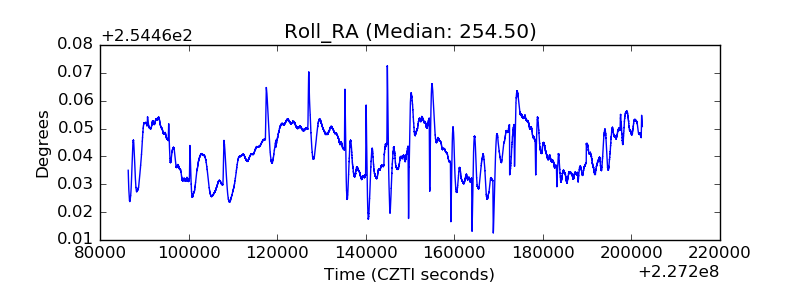 |
| Veto Counter | 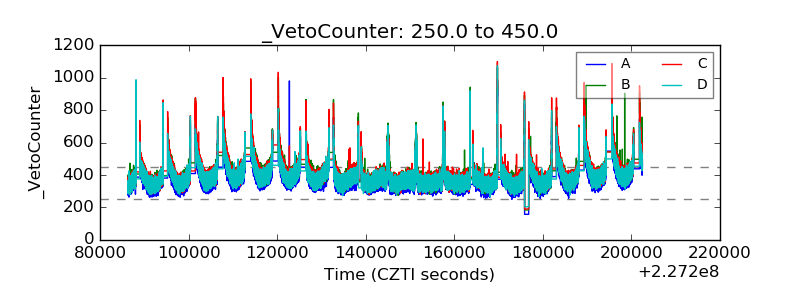 |