| Param | Original file | Final file |
|---|---|---|
| Filename | modeM0/AS1A02_027T01_9000001084_07911cztM0_level2.evt | modeM0/AS1A02_027T01_9000001084_07911cztM0_level2_quad_clean.evt |
| Size (bytes) | 282,237,120 | 35,815,680 |
| Size | 269.2 MB | 34.2 MB |
| Events in quadrant A | 1,918,872 | 209,714 |
| Events in quadrant B | 1,619,442 | 217,305 |
| Events in quadrant C | 3,013,007 | 219,337 |
| Events in quadrant D | 1,775,505 | 208,164 |
| Mode SS | |||
|---|---|---|---|
| Quadrant | BADHDUFLAG | Total packets | Discarded packets |
| A | 0 | 68 | 0 |
| B | 0 | 68 | 0 |
| C | 0 | 68 | 0 |
| D | 0 | 68 | 0 |
| Mode M0 | |||
|---|---|---|---|
| Quadrant | BADHDUFLAG | Total packets | Discarded packets |
| A | 0 | 7684 | 2 |
| B | 0 | 6825 | 1 |
| C | 0 | 11183 | 1 |
| D | 0 | 7313 | 1 |
| Mode M9 | |||
|---|---|---|---|
| Quadrant | BADHDUFLAG | Total packets | Discarded packets |
| A | 0 | 8 | 0 |
| B | 0 | 8 | 0 |
| C | 0 | 8 | 0 |
| D | 0 | 8 | 0 |
| Quadrant | Total seconds | Saturated seconds | Saturation percentage |
|---|---|---|---|
| A | 3225 | 89 | 2.759690% |
| B | 3225 | 66 | 2.046512% |
| C | 3225 | 321 | 9.953488% |
| D | 3225 | 91 | 2.821705% |
Noise dominated data is calculated using 1-second bins in cleaned event files. If a bin has >2000 counts, and if more than 50% of those come from <1% of pixels, then it is considered to be noise-dominated and hence unusable.
| Quadrant | # 1 sec bins | Bins with >0 counts | Bins with >2000 counts | High rate bins dominated by noise | Noise dominated (total time) | Noise dominated (detector-on time) | Marked lightcurve |
|---|---|---|---|---|---|---|---|
| A | 4055 | 3226 | 13 | 13 | 0.32% | 0.40% | 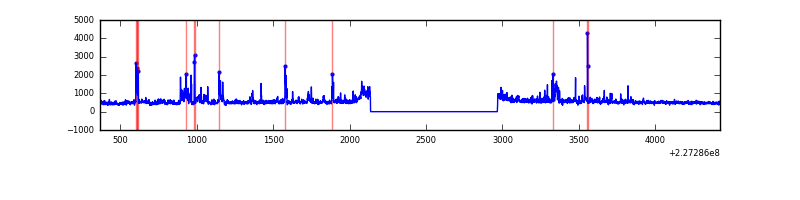 |
| B | 4055 | 3225 | 1 | 1 | 0.02% | 0.03% | 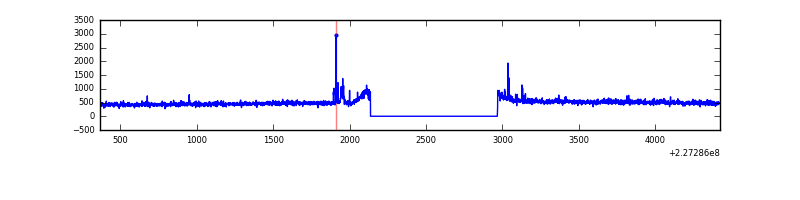 |
| C | 4055 | 3225 | 140 | 140 | 3.45% | 4.34% | 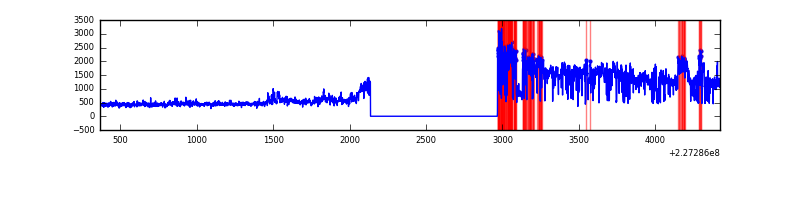 |
| D | 4055 | 3226 | 39 | 39 | 0.96% | 1.21% | 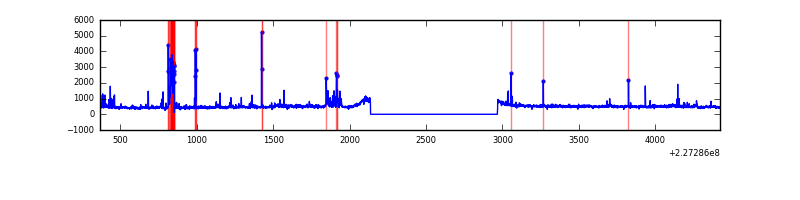 |
Top three noisy pixels from each quadrant. If the there are fewer than three noisy pixels in the level2.evt file, extra rows are filled as -1
| Pixel properties | Quadrant properties | ||||||
|---|---|---|---|---|---|---|---|
| Quadrant | DetID | PixID | Counts | Sigma | Mean | Median | Sigma |
| A | 15 | 239 | 330469 | 3930.19 | 399 | 390 | 84.0 |
| A | 15 | 234 | 44333 | 523.22 | 399 | 390 | 84.0 |
| A | 8 | 15 | 4151 | 44.78 | 399 | 390 | 84.0 |
| B | 4 | 173 | 24779 | 307.39 | 404 | 395 | 79.3 |
| B | 4 | 239 | 10852 | 131.82 | 404 | 395 | 79.3 |
| B | 0 | 214 | 8492 | 102.07 | 404 | 395 | 79.3 |
| C | 1 | 16 | 1522872 | 16886.6 | 381 | 381 | 90.2 |
| C | 13 | 61 | 3012 | 29.18 | 381 | 381 | 90.2 |
| C | 12 | 4 | 1888 | 16.71 | 381 | 381 | 90.2 |
| D | 1 | 52 | 230730 | 2374.72 | 389 | 375 | 97.0 |
| D | 4 | 95 | 32565 | 331.84 | 389 | 375 | 97.0 |
| D | 5 | 233 | 13717 | 137.54 | 389 | 375 | 97.0 |
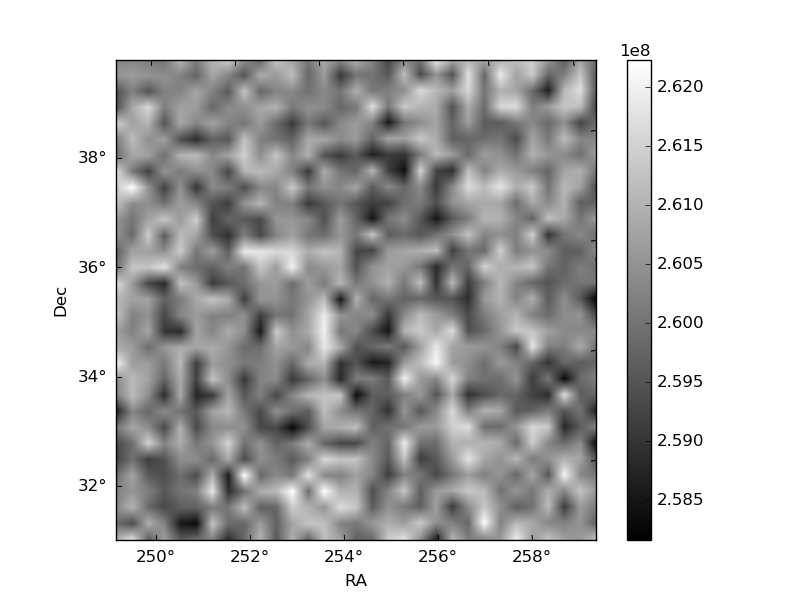
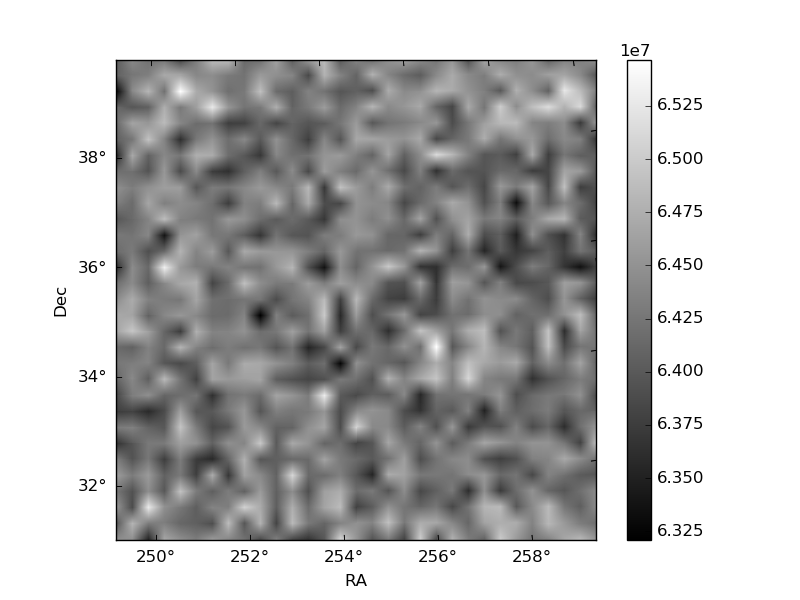
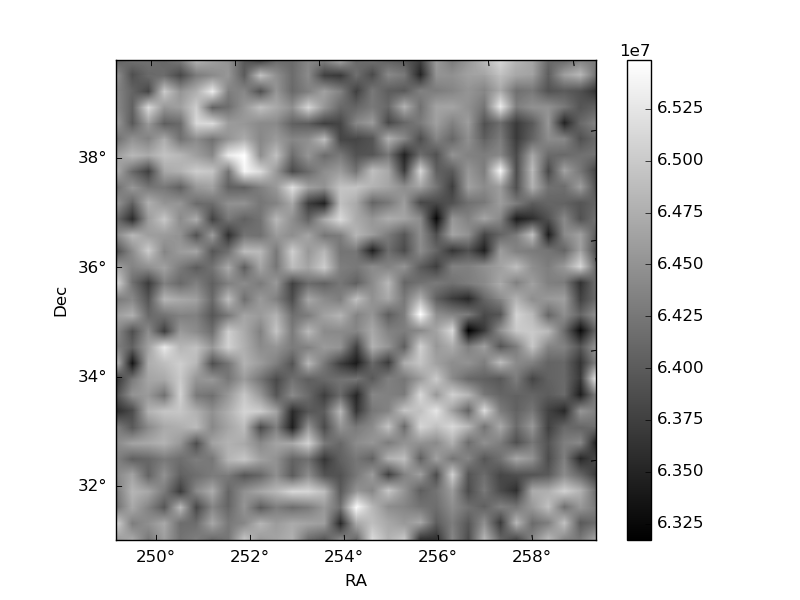
Histogram calculated using DETX and DETY for each event in the final _common_clean file
| Quadrant A | 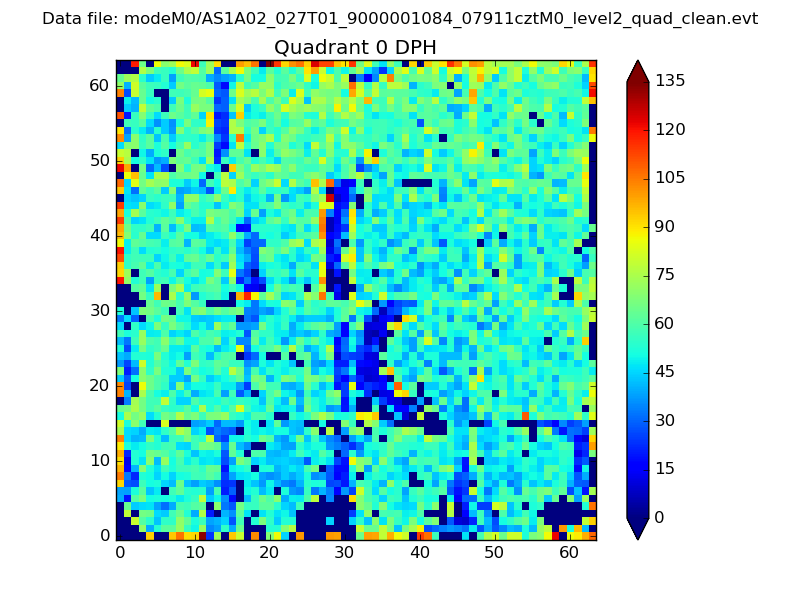 |
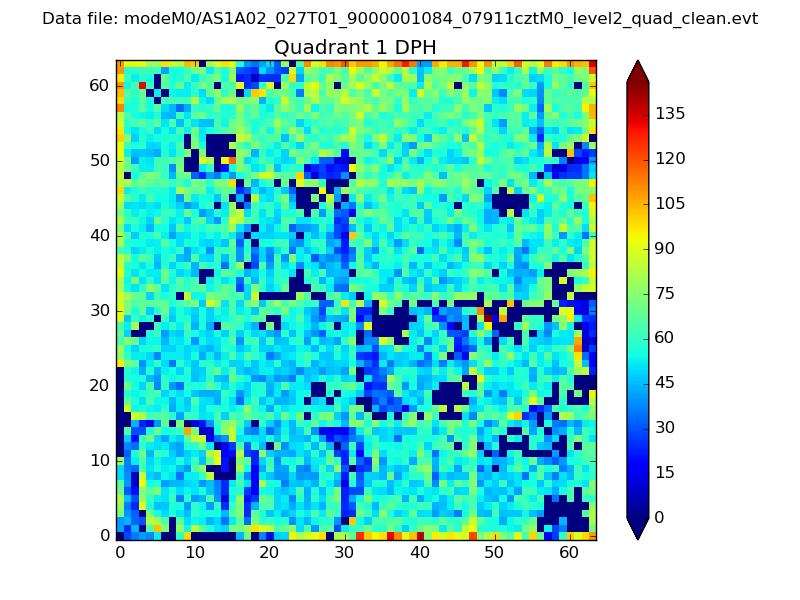 |
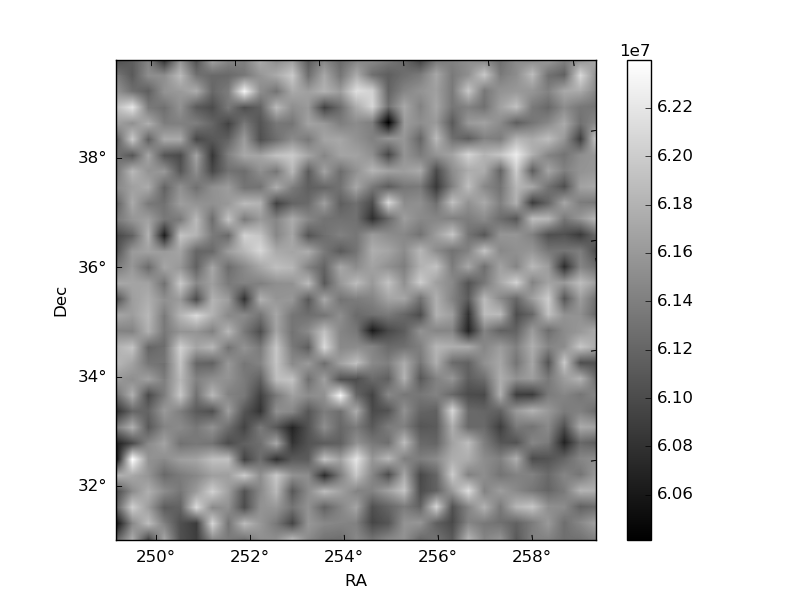
Quadrant B |
|---|---|---|---|
| Quadrant D |  |
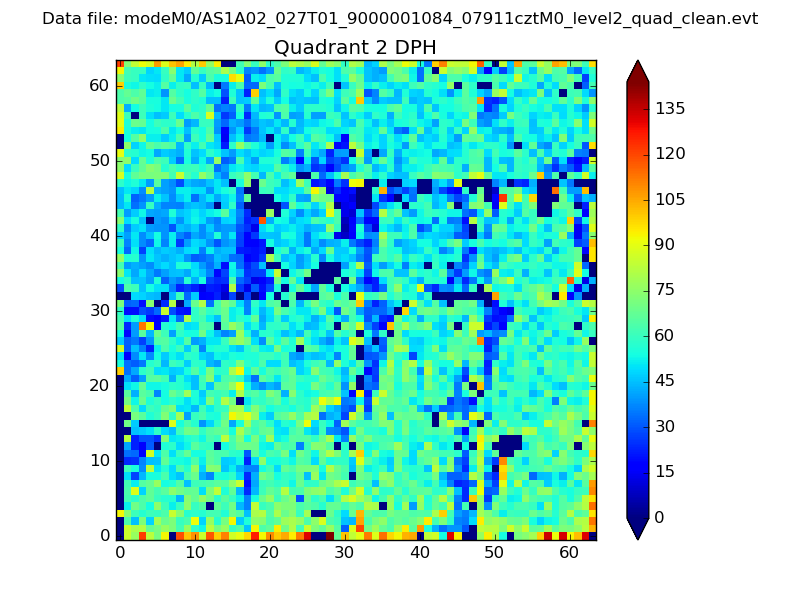 |
Quadrant C |
| Plot type | Count rate plots | Images |
|---|---|---|
| Comparison with Poisson distribution Blue bars denote a histogram of data divided into 1 sec bins. Red curve is a Poisson curve with rate = median count rate of data. |
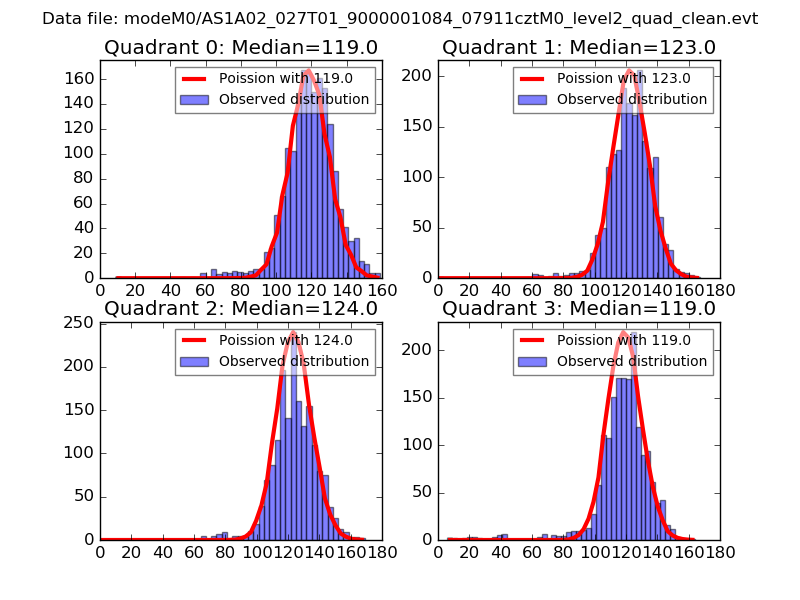 |
 |
| Quadrant-wise count rates Data is divided into 100 sec bins |
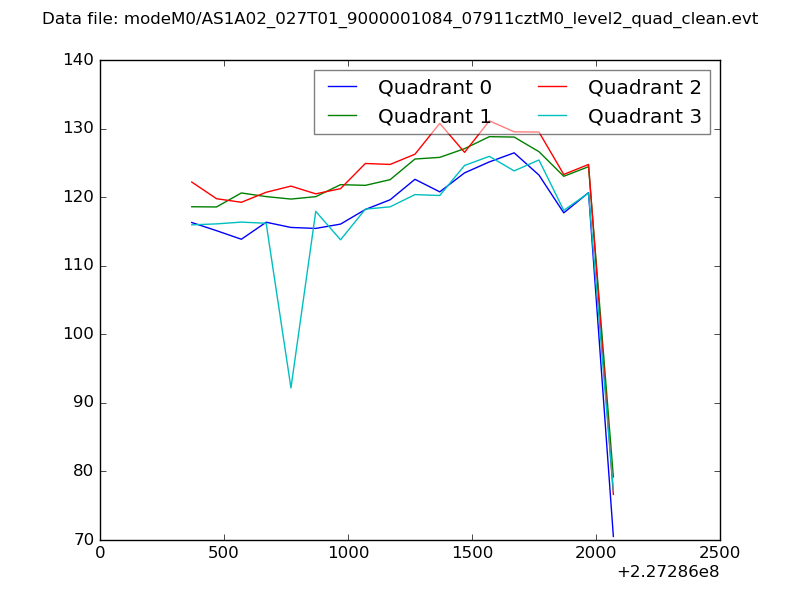 |
|
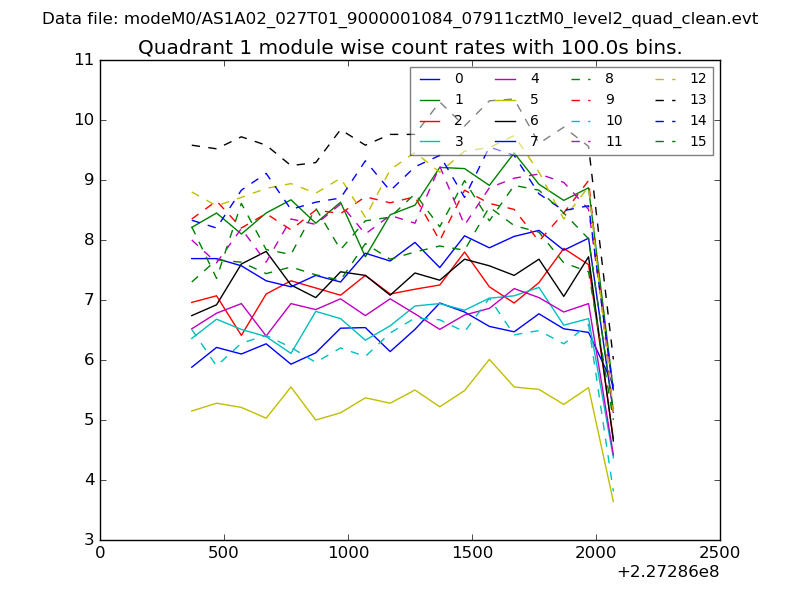
| Module-wise count rates for Quadrant A Data is divided into 100 sec bins |
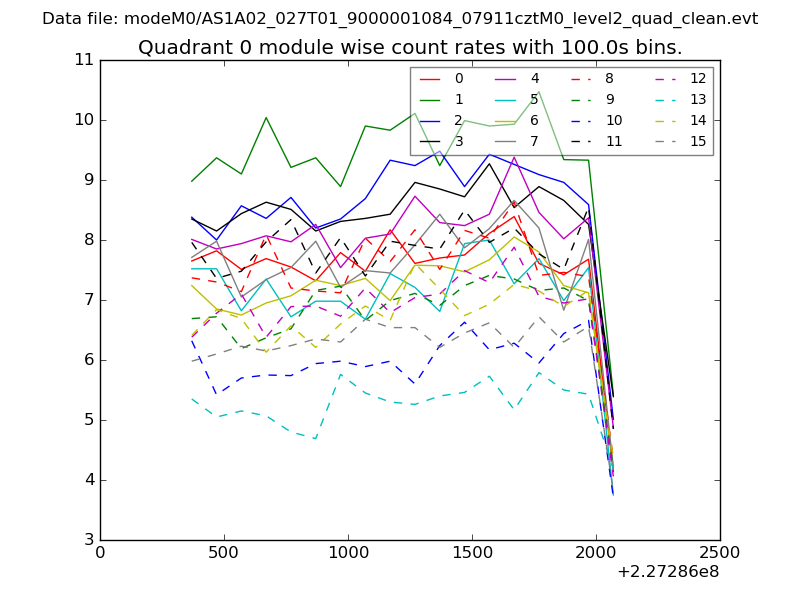 |
 |
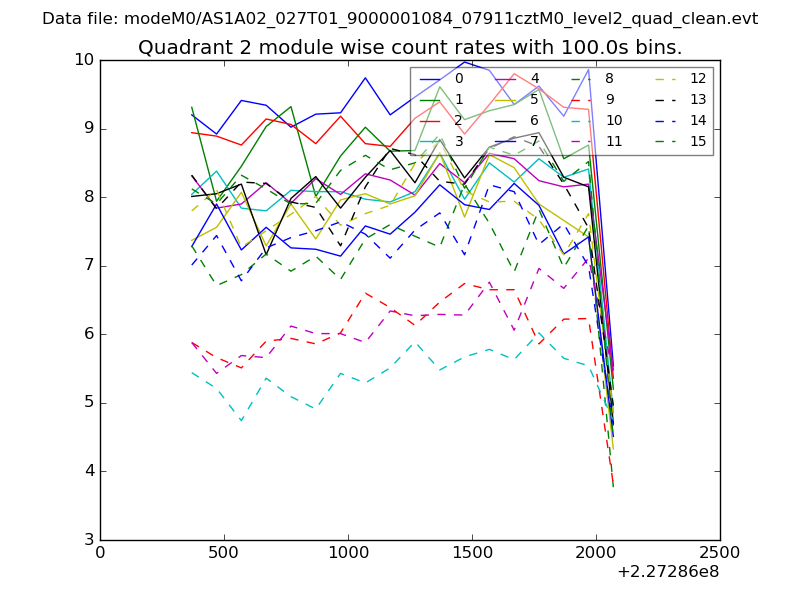
| Module-wise count rates for Quadrant B Data is divided into 100 sec bins |
 |
 |
| Module-wise count rates for Quadrant C Data is divided into 100 sec bins |
 |
 |
| Module-wise count rates for Quadrant D Data is divided into 100 sec bins |
 |
 |
| Parameter | Plot |
|---|---|
| CZT HV Monitor | 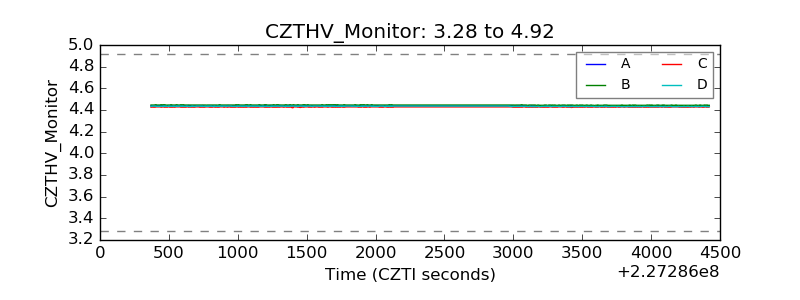 |
| D_VDD | 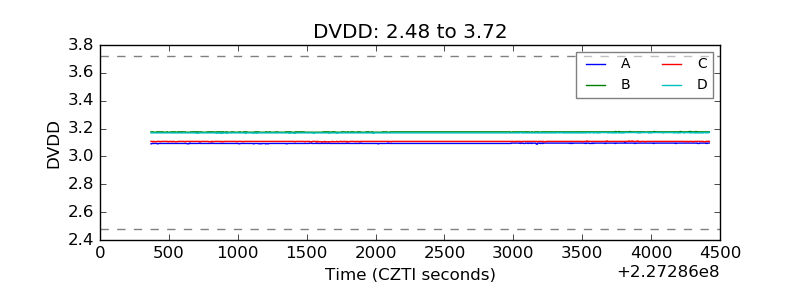 |
| Temperature 1 | 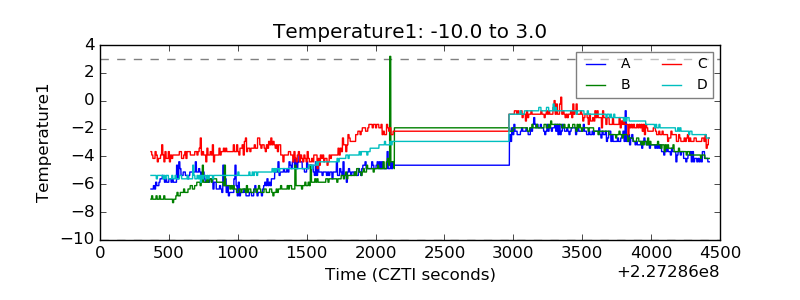 |
| Veto HV Monitor | 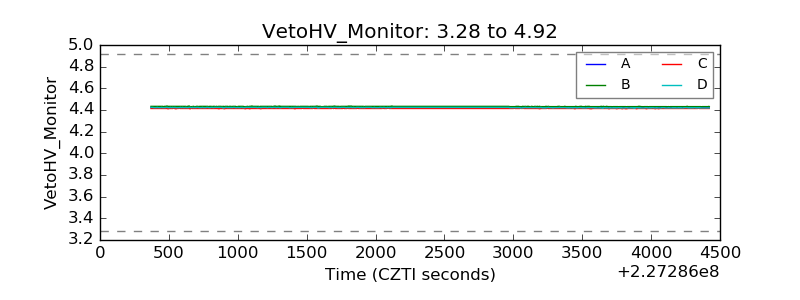 |
| Veto LLD | 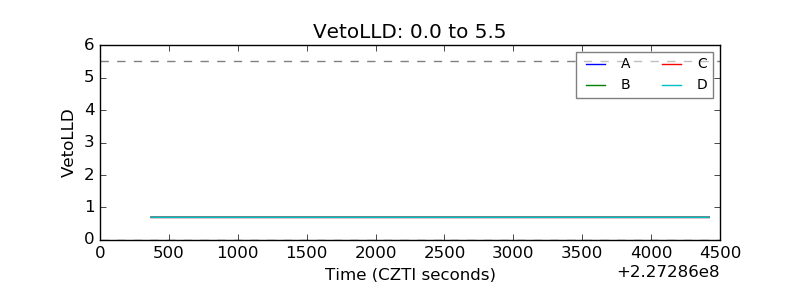 |
| Alpha Counter | 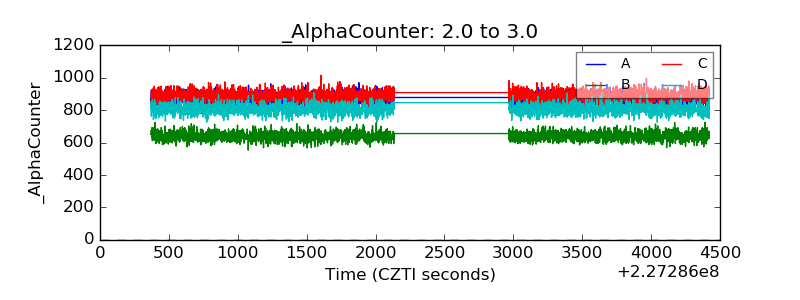 |
| _CPM_Rate | 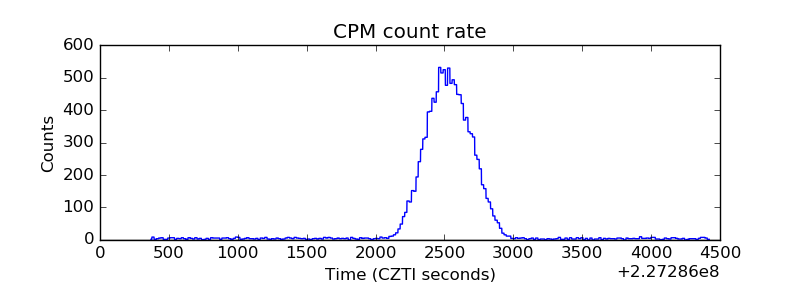 |
| CZT Counter | 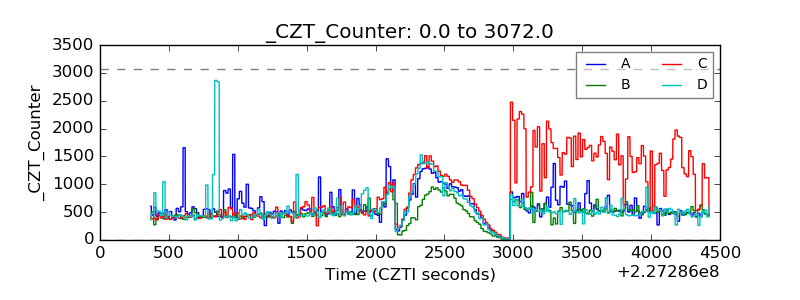 |
| +2.5 Volts monitor | 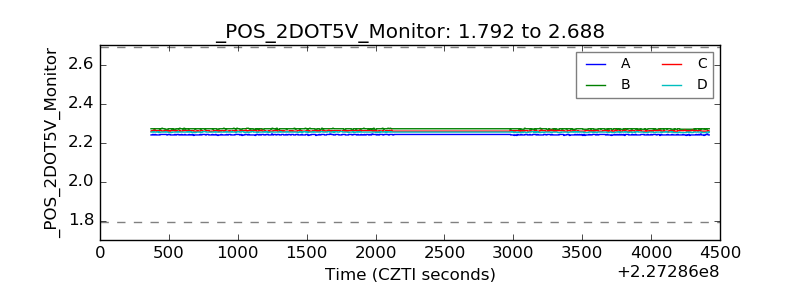 |
| +5 Volts monitor | 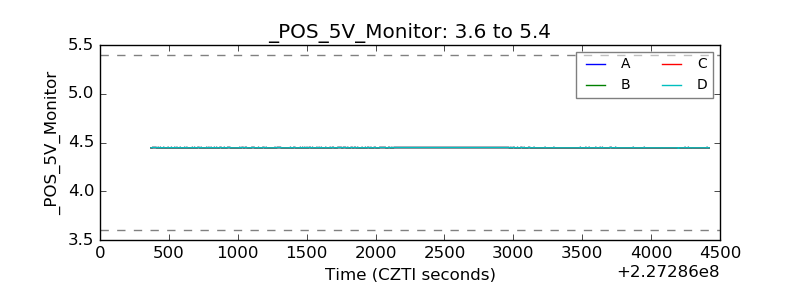 |
| _ROLL_ROT | 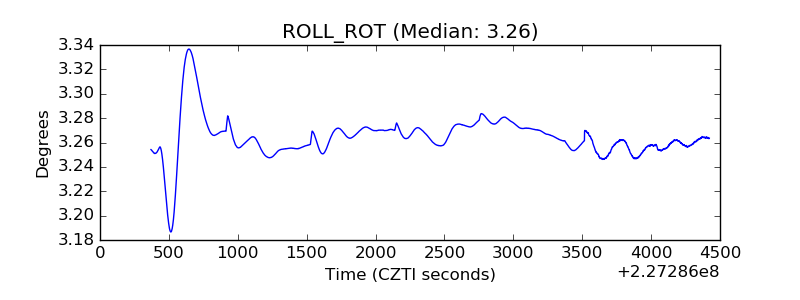 |
| _Roll_DEC | 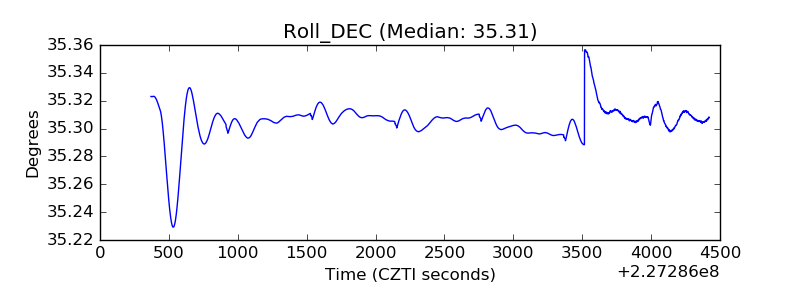 |
| _Roll_RA | 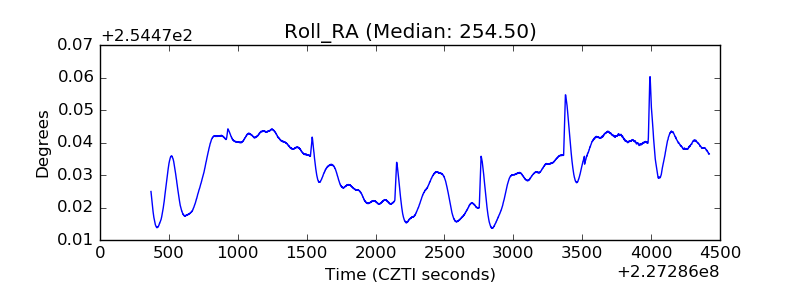 |
| Veto Counter | 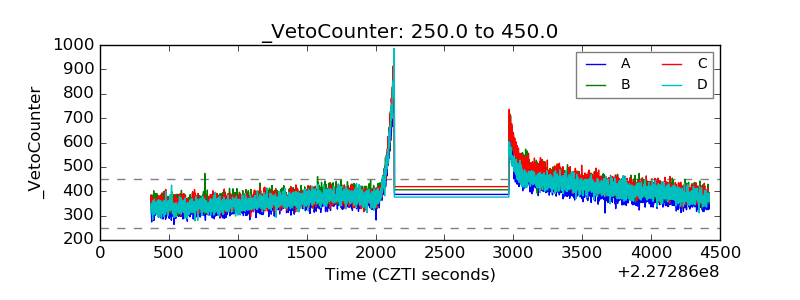 |