| Param | Original file | Final file |
|---|---|---|
| Filename | modeM0/AS1A02_027T01_9000001084_07914cztM0_level2.evt | modeM0/AS1A02_027T01_9000001084_07914cztM0_level2_quad_clean.evt |
| Size (bytes) | 946,785,600 | 153,164,160 |
| Size | 902.9 MB | 146.1 MB |
| Events in quadrant A | 5,714,518 | 942,526 |
| Events in quadrant B | 5,879,626 | 966,527 |
| Events in quadrant C | 10,224,520 | 967,858 |
| Events in quadrant D | 6,048,773 | 936,939 |
| Mode SS | |||
|---|---|---|---|
| Quadrant | BADHDUFLAG | Total packets | Discarded packets |
| A | 0 | 244 | 0 |
| B | 0 | 244 | 0 |
| C | 0 | 244 | 0 |
| D | 0 | 244 | 0 |
| Mode M0 | |||
|---|---|---|---|
| Quadrant | BADHDUFLAG | Total packets | Discarded packets |
| A | 0 | 25174 | 4 |
| B | 0 | 25443 | 3 |
| C | 0 | 38809 | 3 |
| D | 0 | 26189 | 3 |
| Mode M9 | |||
|---|---|---|---|
| Quadrant | BADHDUFLAG | Total packets | Discarded packets |
| A | 0 | 26 | 0 |
| B | 0 | 26 | 0 |
| C | 0 | 26 | 0 |
| D | 0 | 27 | 0 |
| Quadrant | Total seconds | Saturated seconds | Saturation percentage |
|---|---|---|---|
| A | 11925 | 91 | 0.763103% |
| B | 11925 | 120 | 1.006289% |
| C | 11925 | 714 | 5.987421% |
| D | 11925 | 154 | 1.291405% |
Noise dominated data is calculated using 1-second bins in cleaned event files. If a bin has >2000 counts, and if more than 50% of those come from <1% of pixels, then it is considered to be noise-dominated and hence unusable.
| Quadrant | # 1 sec bins | Bins with >0 counts | Bins with >2000 counts | High rate bins dominated by noise | Noise dominated (total time) | Noise dominated (detector-on time) | Marked lightcurve |
|---|---|---|---|---|---|---|---|
| A | 14075 | 11927 | 4 | 4 | 0.03% | 0.03% | 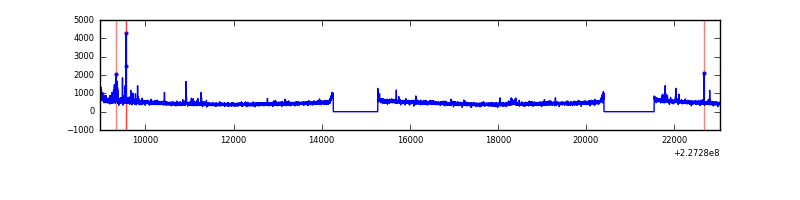 |
| B | 14075 | 11927 | 10 | 10 | 0.07% | 0.08% | 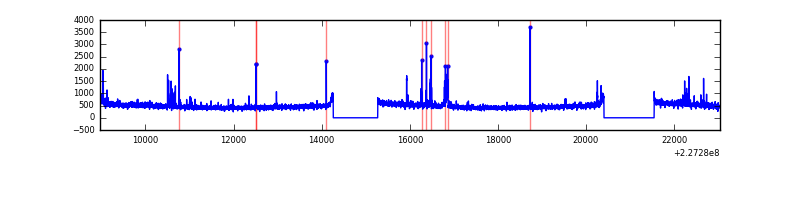 |
| C | 14075 | 11927 | 356 | 356 | 2.53% | 2.98% | 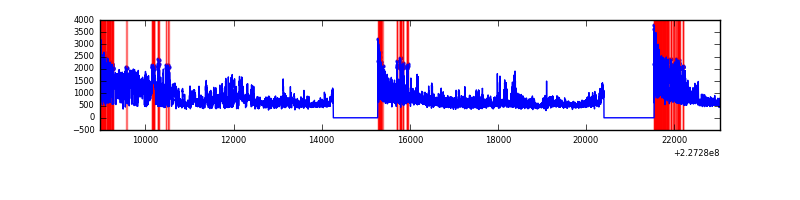 |
| D | 14075 | 11927 | 70 | 70 | 0.50% | 0.59% | 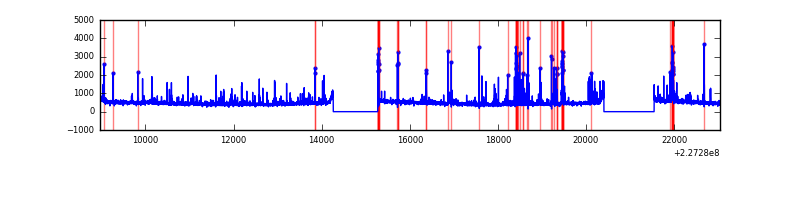 |
Top three noisy pixels from each quadrant. If the there are fewer than three noisy pixels in the level2.evt file, extra rows are filled as -1
| Pixel properties | Quadrant properties | ||||||
|---|---|---|---|---|---|---|---|
| Quadrant | DetID | PixID | Counts | Sigma | Mean | Median | Sigma |
| A | 15 | 234 | 120841 | 415.01 | 1426 | 1394 | 287.8 |
| A | 15 | 239 | 76892 | 262.31 | 1426 | 1394 | 287.8 |
| A | 0 | 226 | 13544 | 42.21 | 1426 | 1394 | 287.8 |
| B | 4 | 239 | 117550 | 426.73 | 1444 | 1412 | 272.2 |
| B | 5 | 255 | 82678 | 298.6 | 1444 | 1412 | 272.2 |
| B | 4 | 81 | 29481 | 103.14 | 1444 | 1412 | 272.2 |
| C | 1 | 16 | 4812839 | 15086.06 | 1386 | 1390 | 318.9 |
| C | 13 | 61 | 10630 | 28.97 | 1386 | 1390 | 318.9 |
| C | 14 | 67 | 4656 | 10.24 | 1386 | 1390 | 318.9 |
| D | 1 | 52 | 424298 | 1239.63 | 1400 | 1356 | 341.2 |
| D | 5 | 233 | 112261 | 325.06 | 1400 | 1356 | 341.2 |
| D | 2 | 14 | 110064 | 318.62 | 1400 | 1356 | 341.2 |
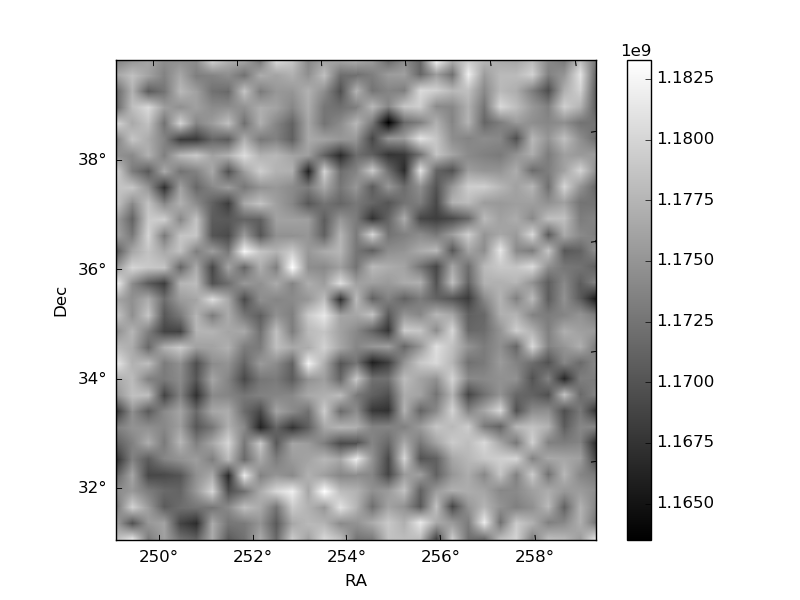
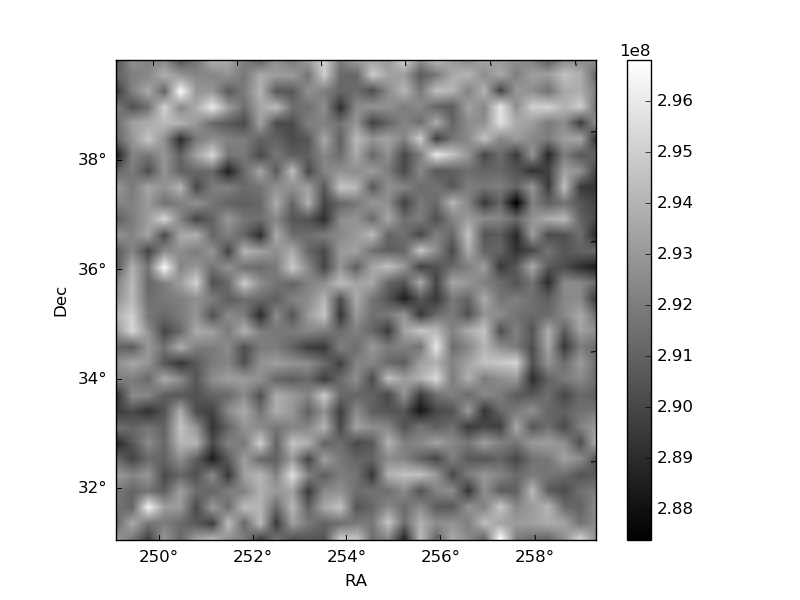
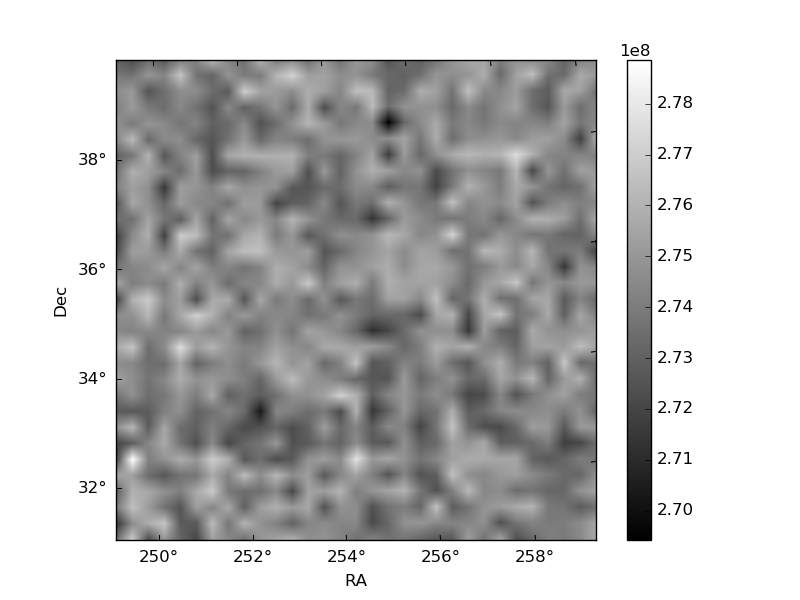
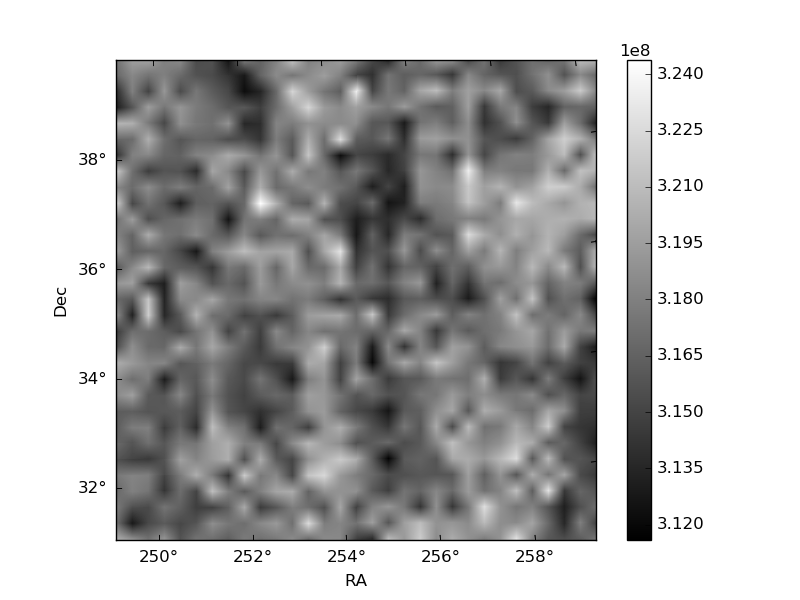
Histogram calculated using DETX and DETY for each event in the final _common_clean file
| Quadrant A | 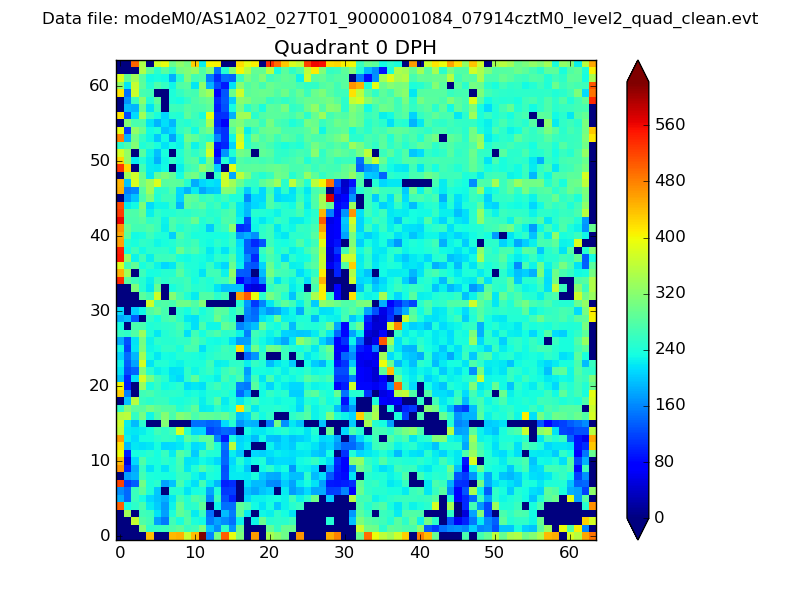 |
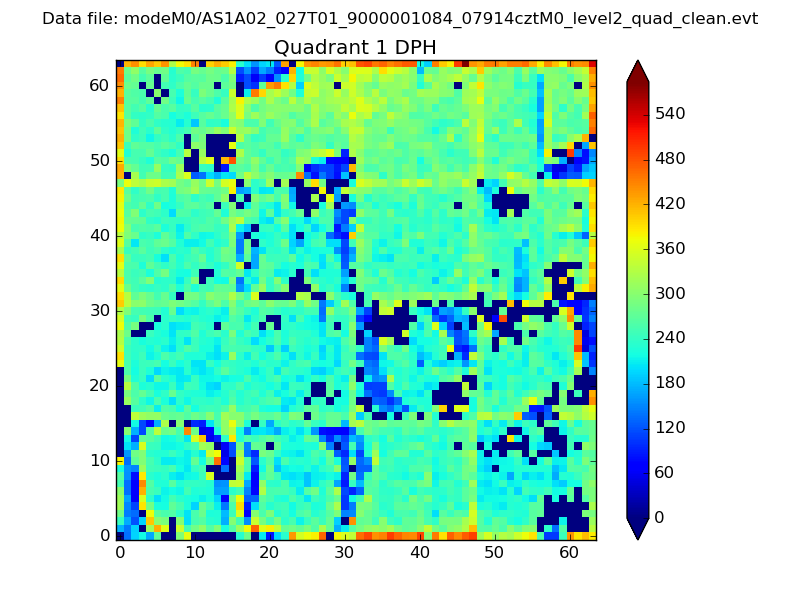 |
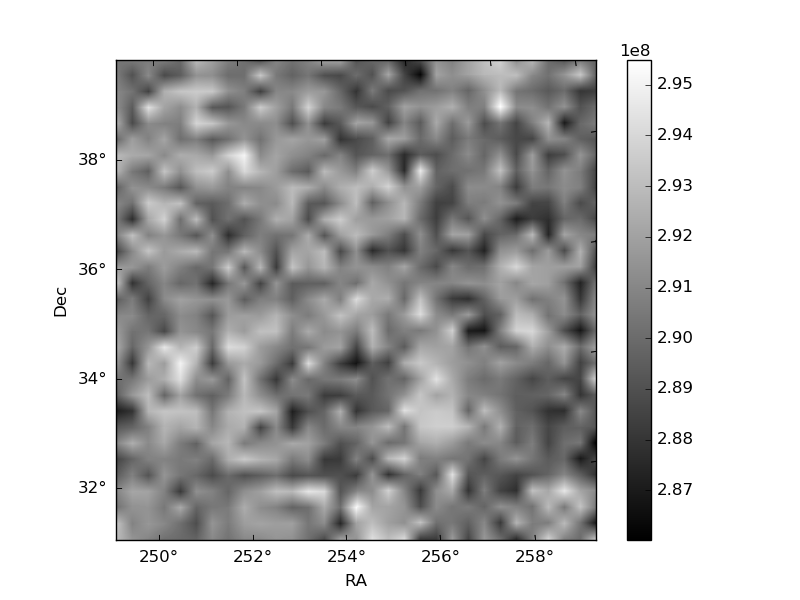
Quadrant B |
|---|---|---|---|
| Quadrant D | 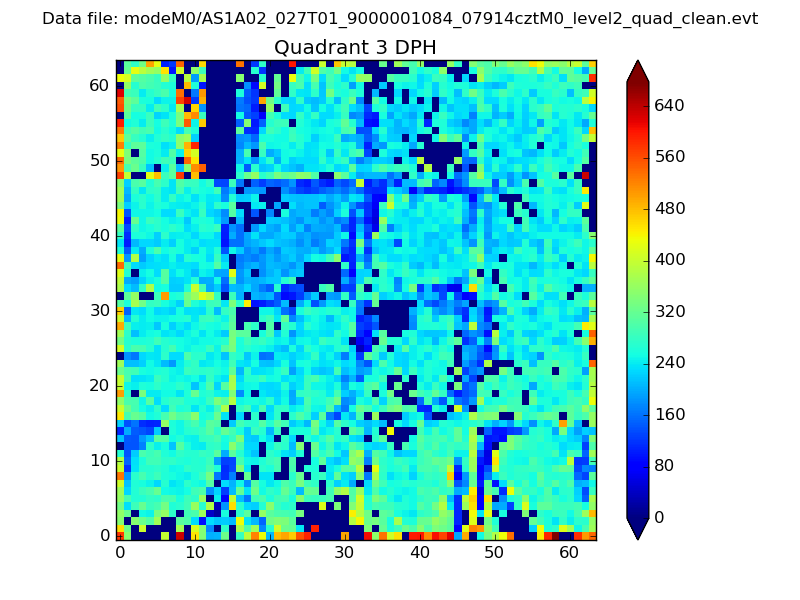 |
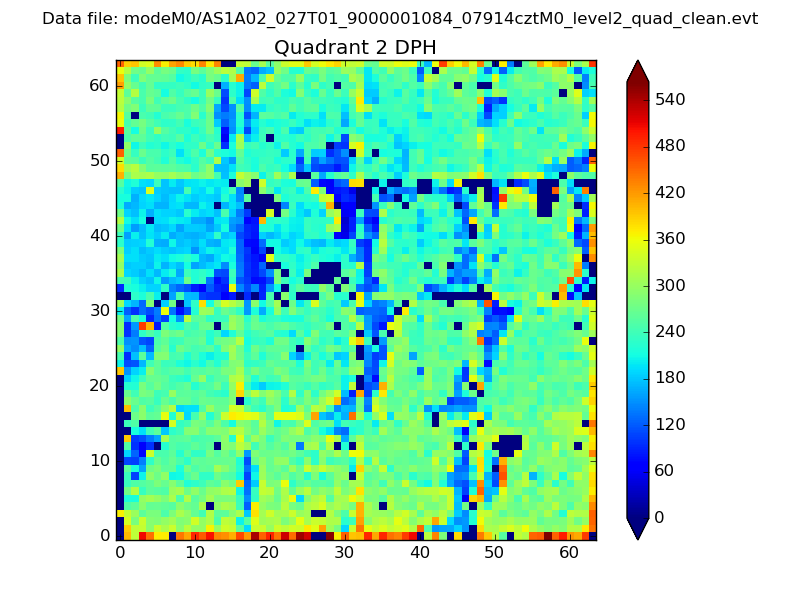 |
Quadrant C |
| Plot type | Count rate plots | Images |
|---|---|---|
| Comparison with Poisson distribution Blue bars denote a histogram of data divided into 1 sec bins. Red curve is a Poisson curve with rate = median count rate of data. |
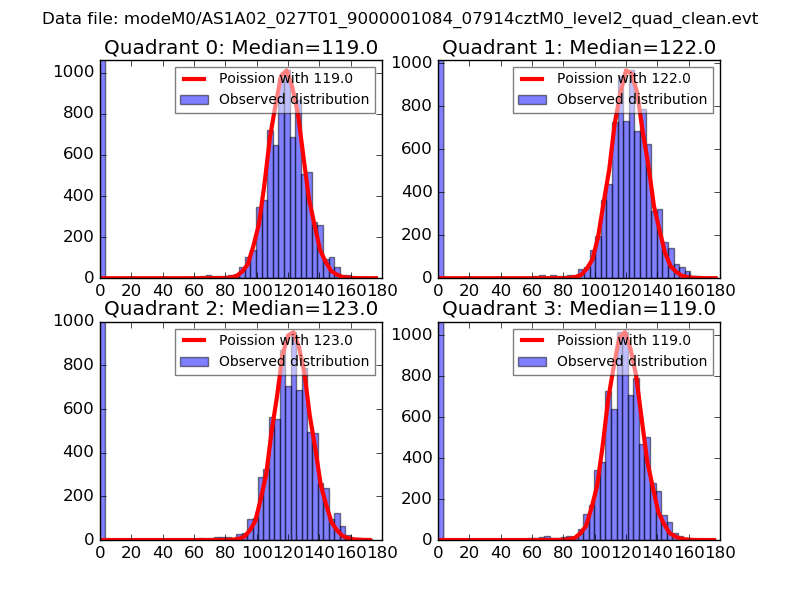 |
 |
| Quadrant-wise count rates Data is divided into 100 sec bins |
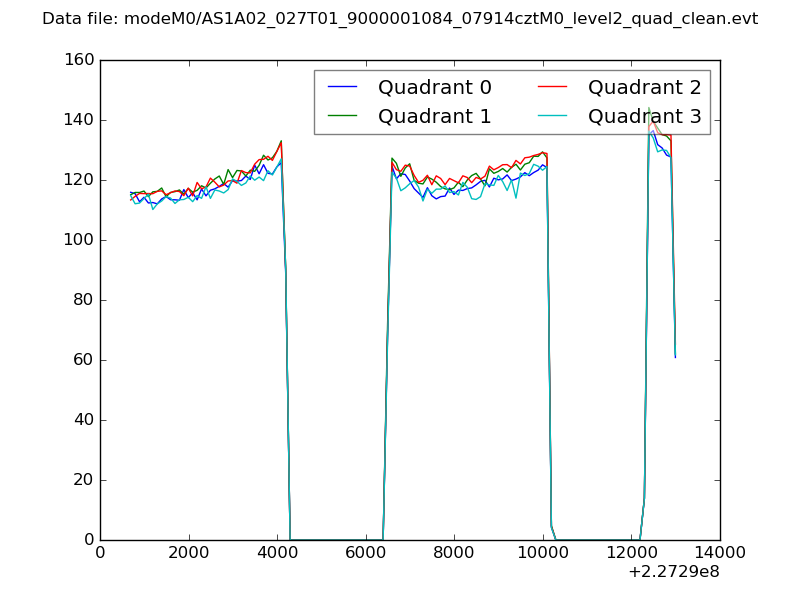 |
|
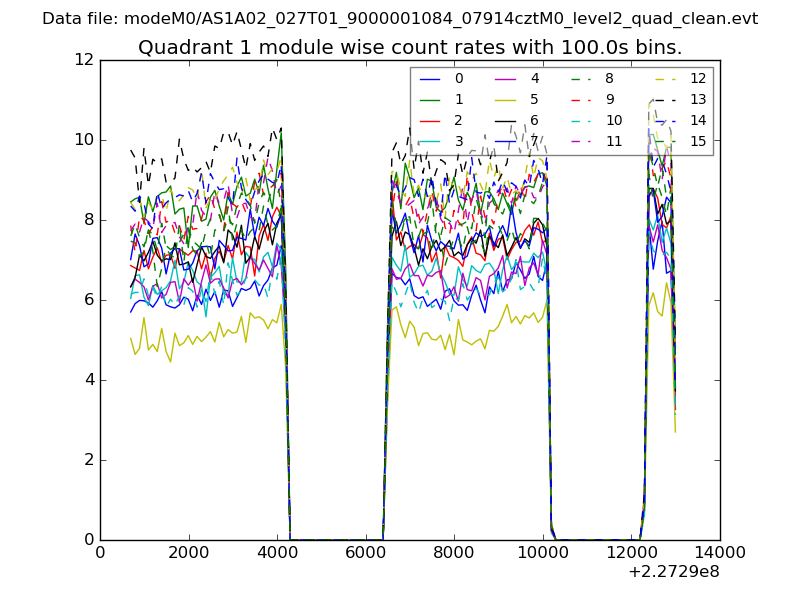
| Module-wise count rates for Quadrant A Data is divided into 100 sec bins |
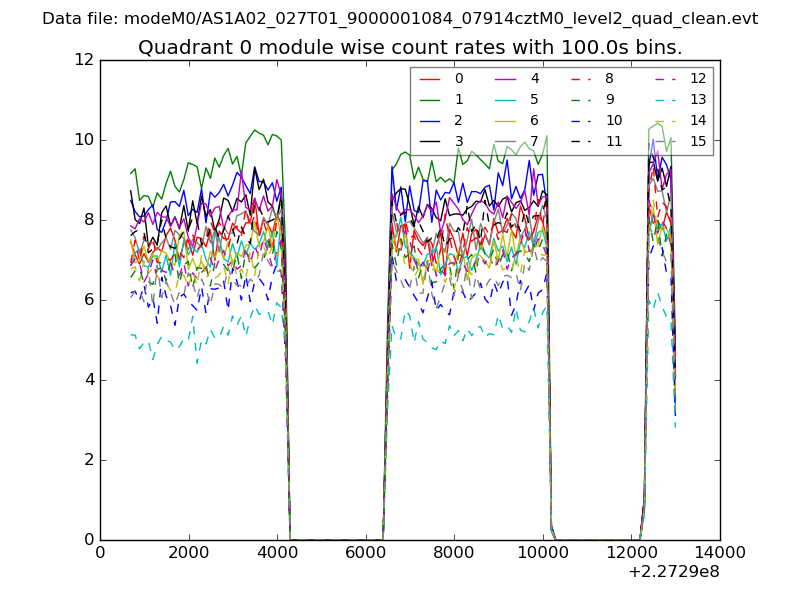 |
 |
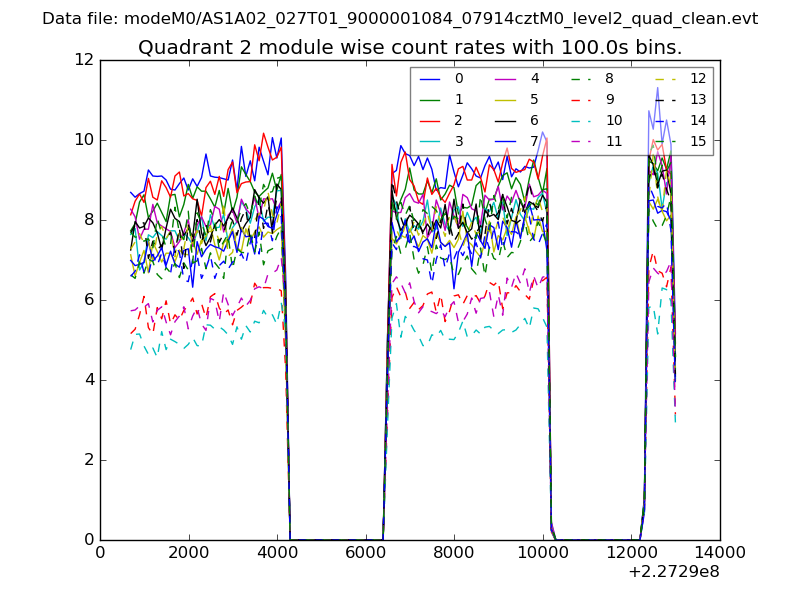
| Module-wise count rates for Quadrant B Data is divided into 100 sec bins |
 |
 |
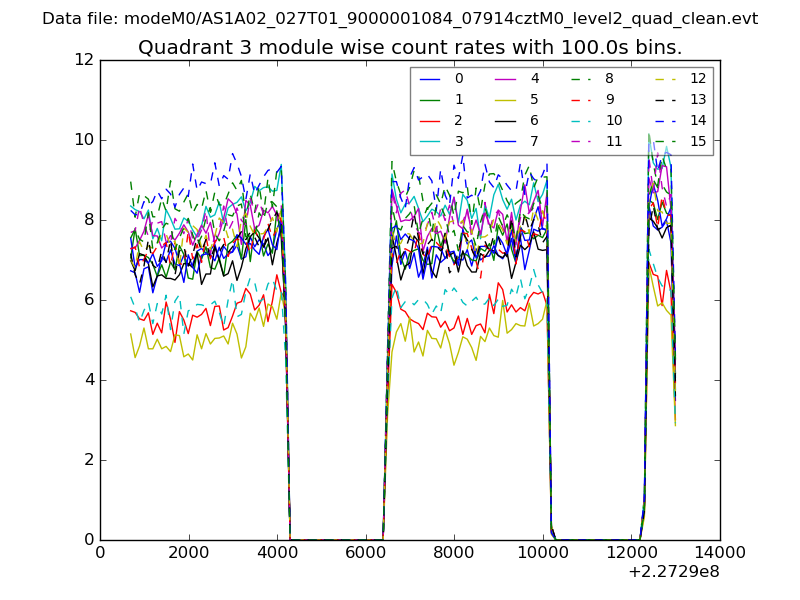
| Module-wise count rates for Quadrant C Data is divided into 100 sec bins |
 |
 |
| Module-wise count rates for Quadrant D Data is divided into 100 sec bins |
 |
 |
| Parameter | Plot |
|---|---|
| CZT HV Monitor | 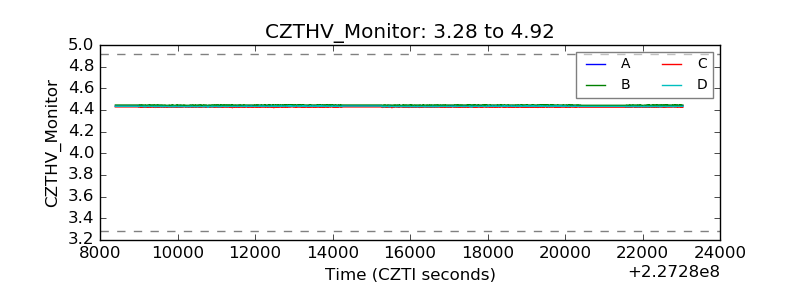 |
| D_VDD | 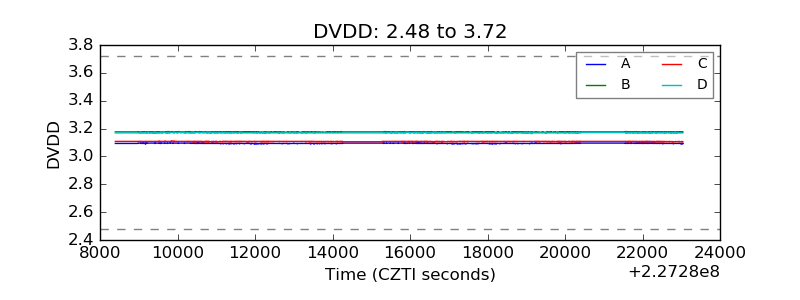 |
| Temperature 1 | 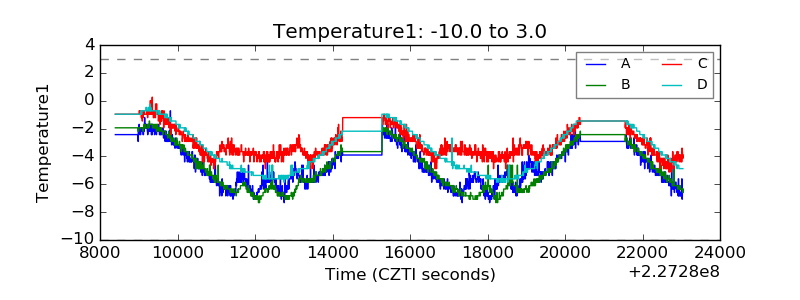 |
| Veto HV Monitor | 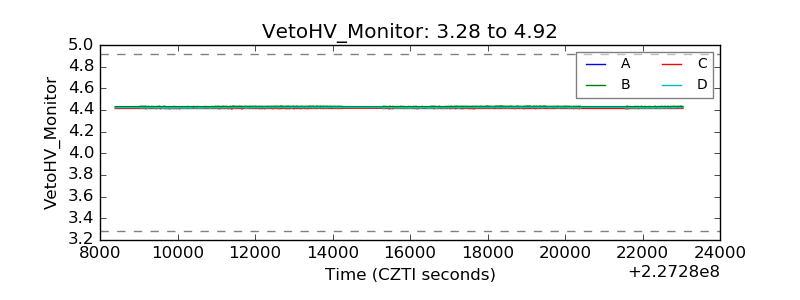 |
| Veto LLD |  |
| Alpha Counter | 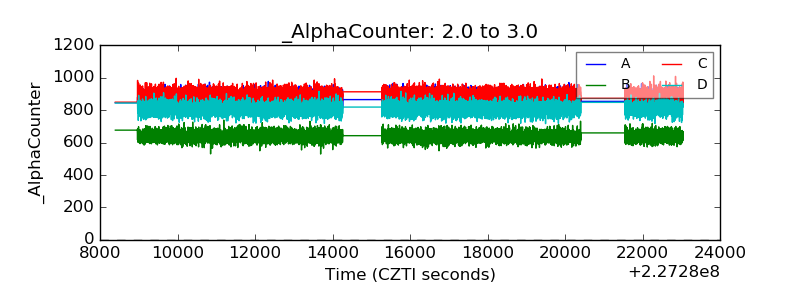 |
| _CPM_Rate | 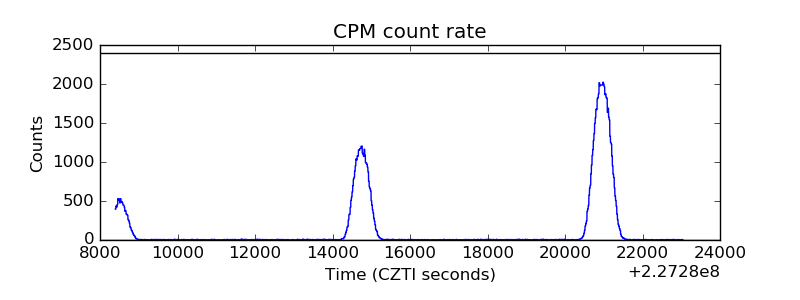 |
| CZT Counter | 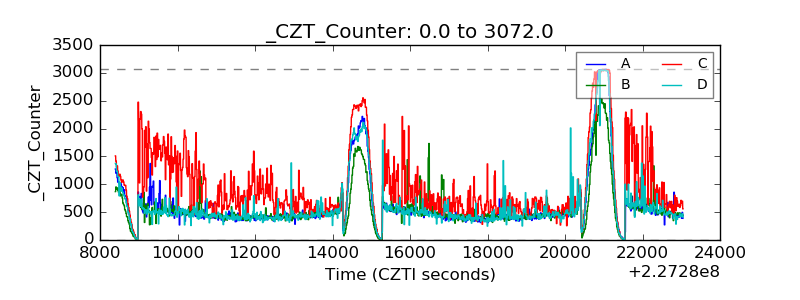 |
| +2.5 Volts monitor |  |
| +5 Volts monitor | 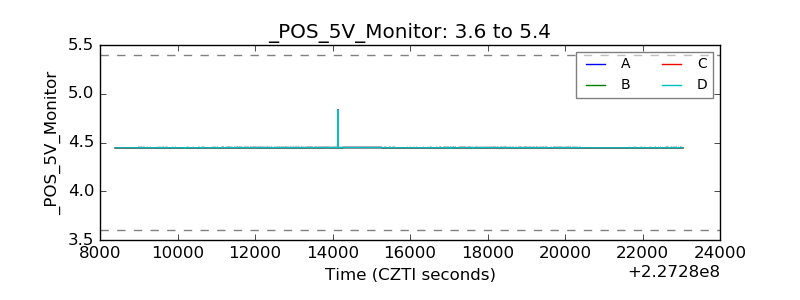 |
| _ROLL_ROT | 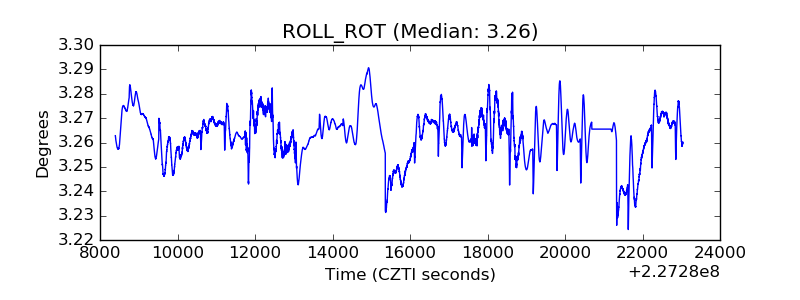 |
| _Roll_DEC | 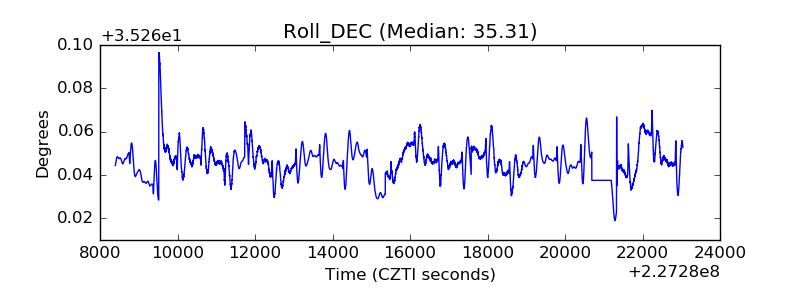 |
| _Roll_RA | 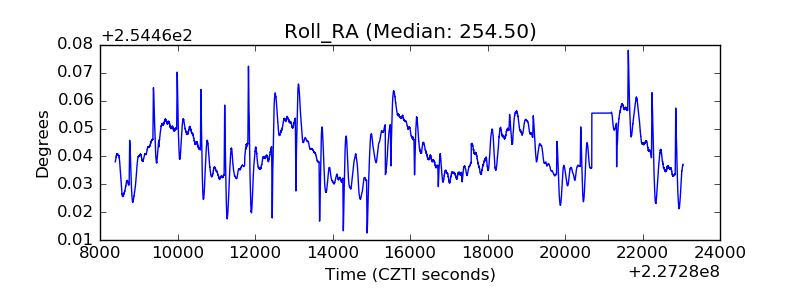 |
| Veto Counter | 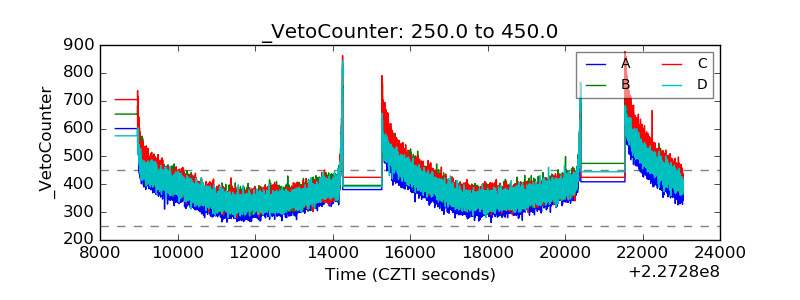 |