| Param | Original file | Final file |
|---|---|---|
| Filename | modeM0/AS1A02_027T01_9000001084_07915cztM0_level2.evt | modeM0/AS1A02_027T01_9000001084_07915cztM0_level2_quad_clean.evt |
| Size (bytes) | 510,085,440 | 93,173,760 |
| Size | 486.5 MB | 88.9 MB |
| Events in quadrant A | 3,119,269 | 583,650 |
| Events in quadrant B | 3,294,643 | 605,285 |
| Events in quadrant C | 5,053,067 | 607,260 |
| Events in quadrant D | 3,547,274 | 579,317 |
| Mode SS | |||
|---|---|---|---|
| Quadrant | BADHDUFLAG | Total packets | Discarded packets |
| A | 0 | 128 | 0 |
| B | 0 | 128 | 0 |
| C | 0 | 128 | 0 |
| D | 0 | 128 | 0 |
| Mode M0 | |||
|---|---|---|---|
| Quadrant | BADHDUFLAG | Total packets | Discarded packets |
| A | 0 | 13606 | 3 |
| B | 0 | 14103 | 2 |
| C | 0 | 19319 | 2 |
| D | 0 | 14821 | 2 |
| Mode M9 | |||
|---|---|---|---|
| Quadrant | BADHDUFLAG | Total packets | Discarded packets |
| A | 0 | 14 | 0 |
| B | 0 | 14 | 0 |
| C | 0 | 14 | 0 |
| D | 0 | 15 | 0 |
| Quadrant | Total seconds | Saturated seconds | Saturation percentage |
|---|---|---|---|
| A | 6400 | 62 | 0.968750% |
| B | 6400 | 71 | 1.109375% |
| C | 6400 | 416 | 6.500000% |
| D | 6400 | 114 | 1.781250% |
Noise dominated data is calculated using 1-second bins in cleaned event files. If a bin has >2000 counts, and if more than 50% of those come from <1% of pixels, then it is considered to be noise-dominated and hence unusable.
| Quadrant | # 1 sec bins | Bins with >0 counts | Bins with >2000 counts | High rate bins dominated by noise | Noise dominated (total time) | Noise dominated (detector-on time) | Marked lightcurve |
|---|---|---|---|---|---|---|---|
| A | 7620 | 6401 | 1 | 1 | 0.01% | 0.02% | 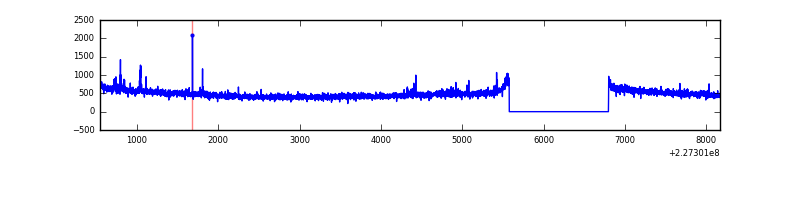 |
| B | 7620 | 6401 | 3 | 3 | 0.04% | 0.05% | 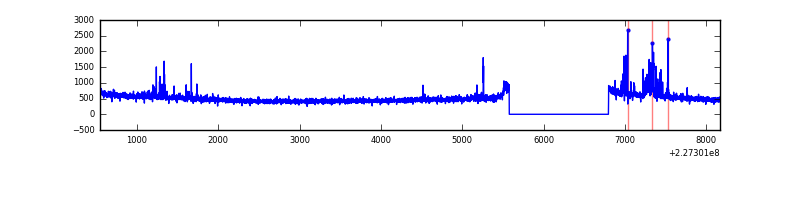 |
| C | 7620 | 6401 | 208 | 208 | 2.73% | 3.25% | 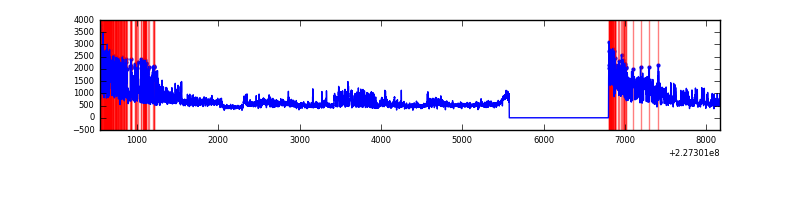 |
| D | 7620 | 6401 | 54 | 54 | 0.71% | 0.84% |  |
Top three noisy pixels from each quadrant. If the there are fewer than three noisy pixels in the level2.evt file, extra rows are filled as -1
| Pixel properties | Quadrant properties | ||||||
|---|---|---|---|---|---|---|---|
| Quadrant | DetID | PixID | Counts | Sigma | Mean | Median | Sigma |
| A | 15 | 234 | 44457 | 270.86 | 792 | 776 | 161.3 |
| A | 3 | 1 | 10039 | 57.44 | 792 | 776 | 161.3 |
| A | 0 | 226 | 7432 | 41.27 | 792 | 776 | 161.3 |
| B | 4 | 239 | 69308 | 451.29 | 805 | 787 | 151.8 |
| B | 4 | 81 | 66720 | 434.24 | 805 | 787 | 151.8 |
| B | 12 | 111 | 15624 | 97.72 | 805 | 787 | 151.8 |
| C | 1 | 16 | 2025251 | 11320.76 | 775 | 778 | 178.8 |
| C | 12 | 4 | 6464 | 31.8 | 775 | 778 | 178.8 |
| C | 13 | 61 | 5776 | 27.95 | 775 | 778 | 178.8 |
| D | 1 | 52 | 271066 | 1426.14 | 779 | 755 | 189.5 |
| D | 5 | 233 | 98275 | 514.51 | 779 | 755 | 189.5 |
| D | 6 | 18 | 62108 | 323.69 | 779 | 755 | 189.5 |
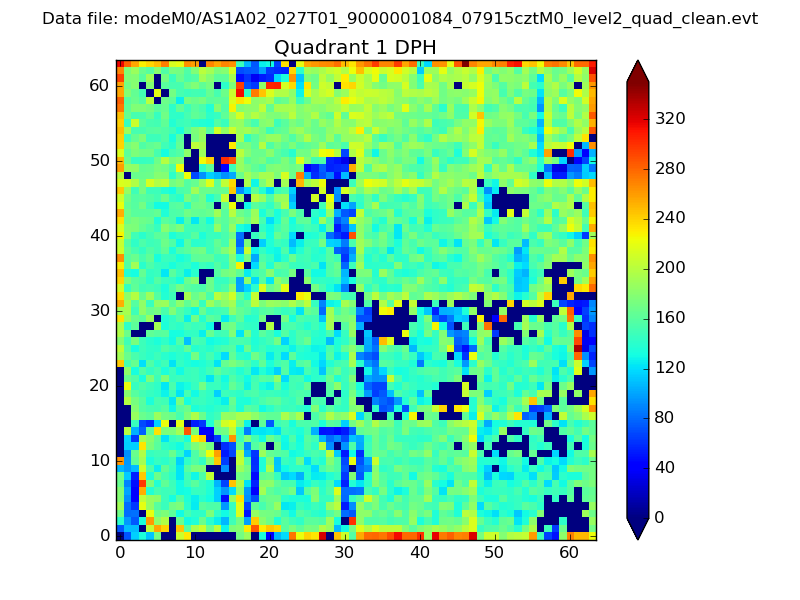
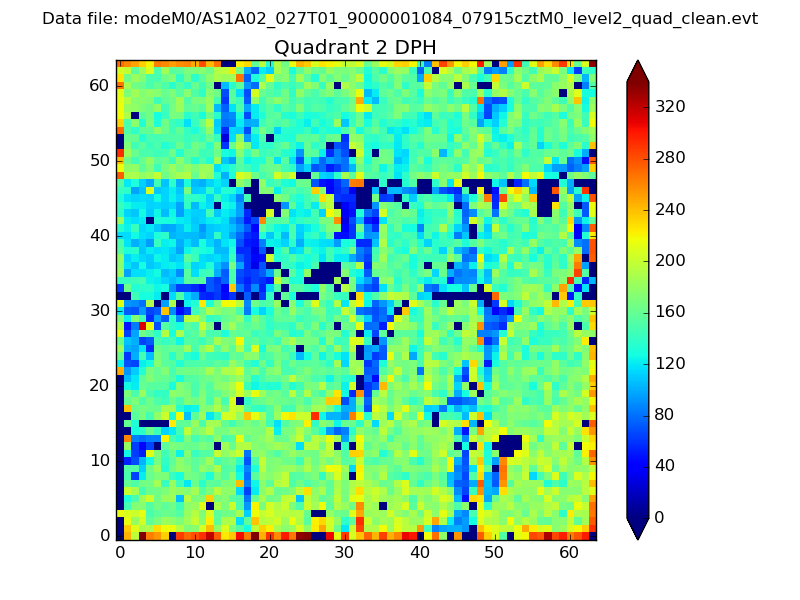
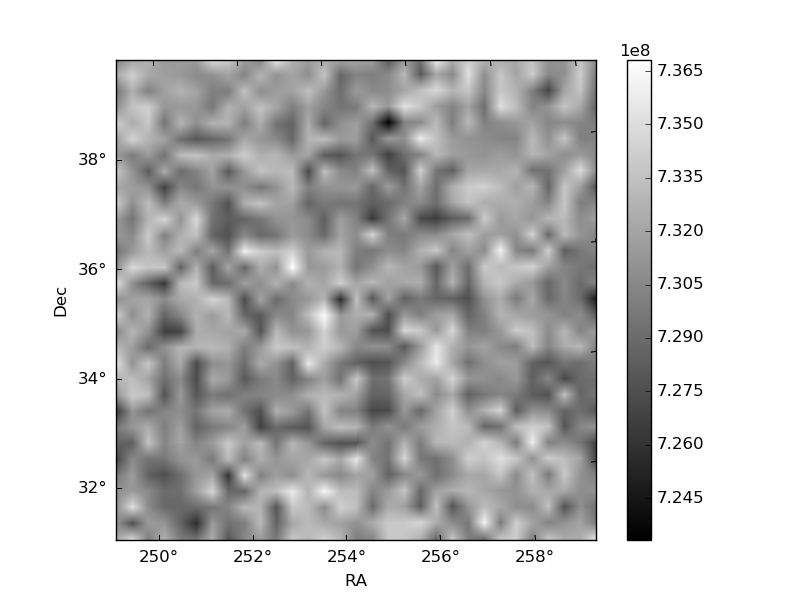
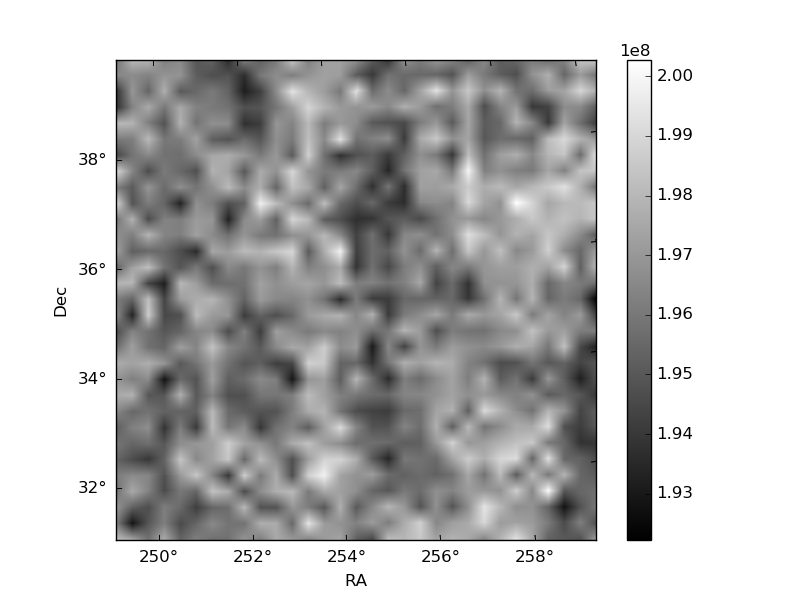
Histogram calculated using DETX and DETY for each event in the final _common_clean file
| Quadrant A | 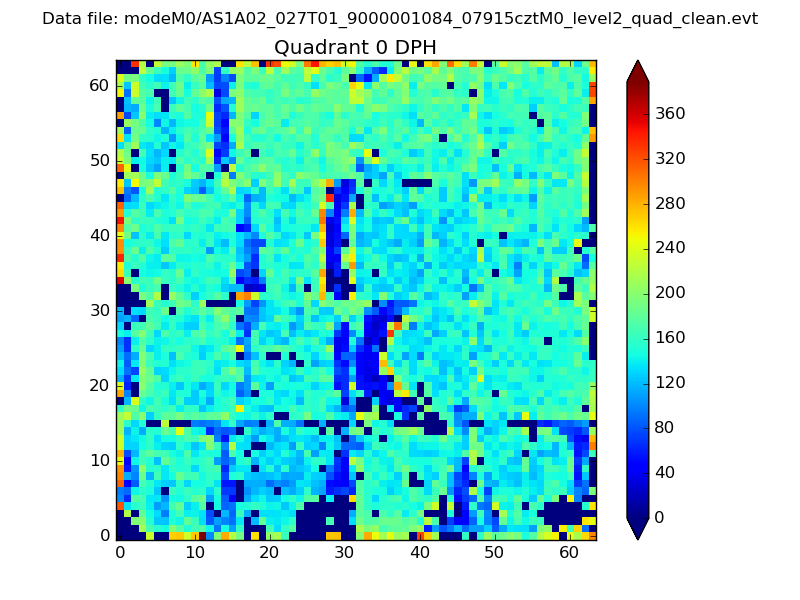 |
 |
Quadrant B |
|---|---|---|---|
| Quadrant D | 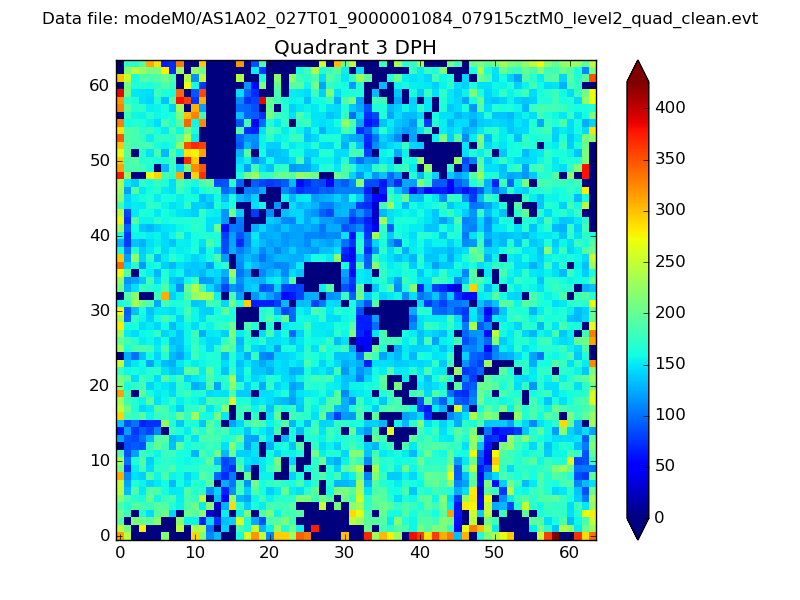 |
 |
Quadrant C |
| Plot type | Count rate plots | Images |
|---|---|---|
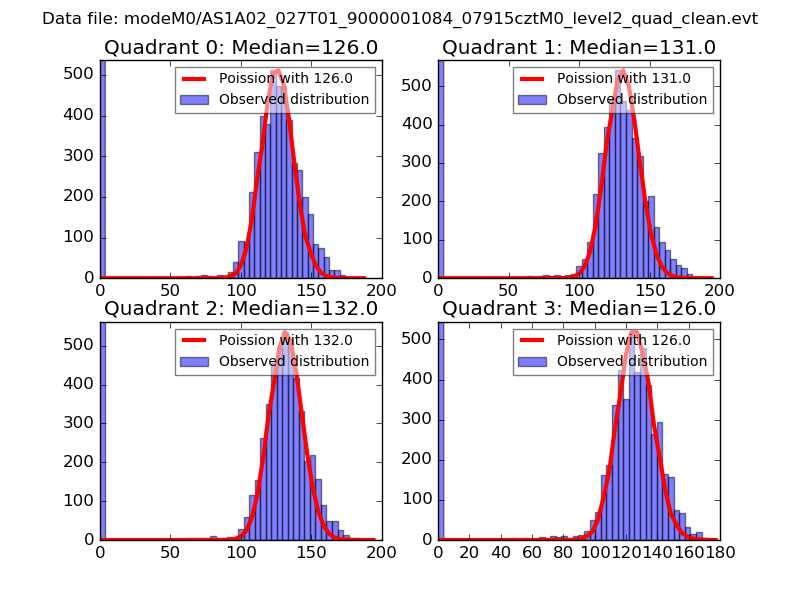
| Comparison with Poisson distribution Blue bars denote a histogram of data divided into 1 sec bins. Red curve is a Poisson curve with rate = median count rate of data. |
 |
 |
| Quadrant-wise count rates Data is divided into 100 sec bins |
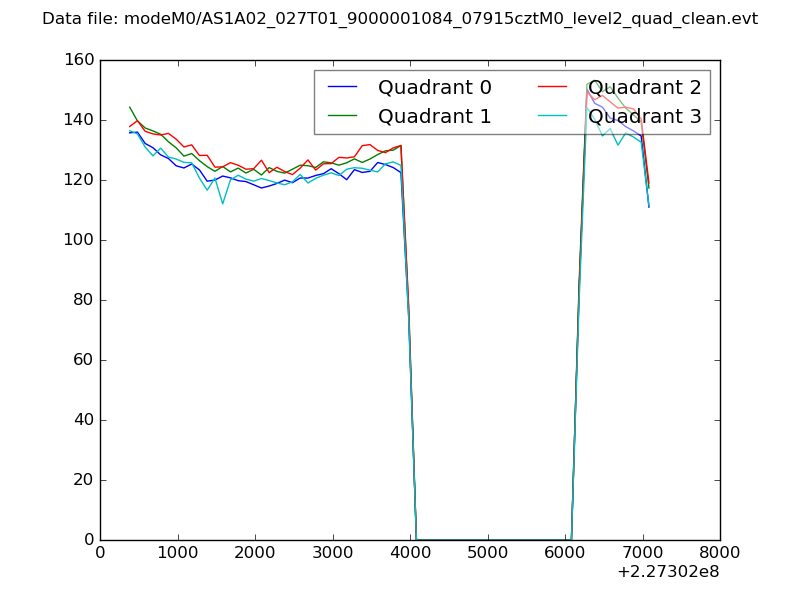 |
|
| Module-wise count rates for Quadrant A Data is divided into 100 sec bins |
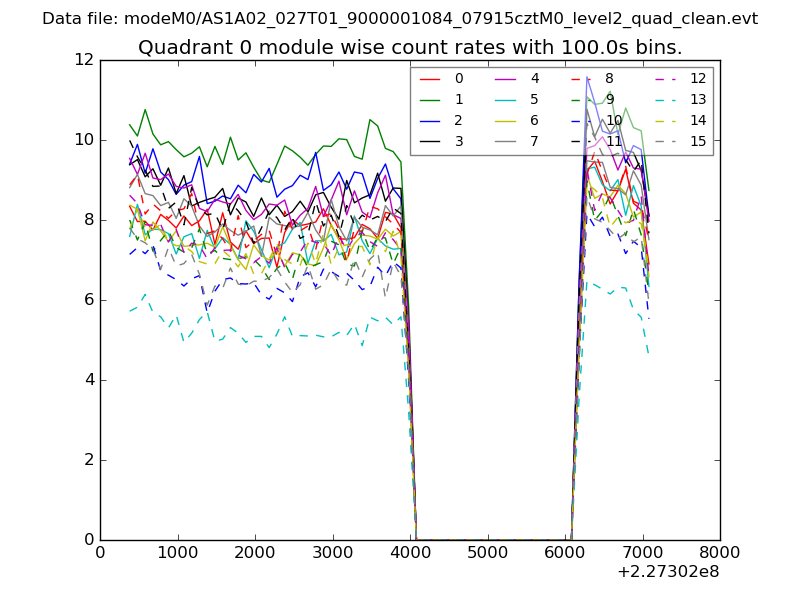 |
 |
| Module-wise count rates for Quadrant B Data is divided into 100 sec bins |
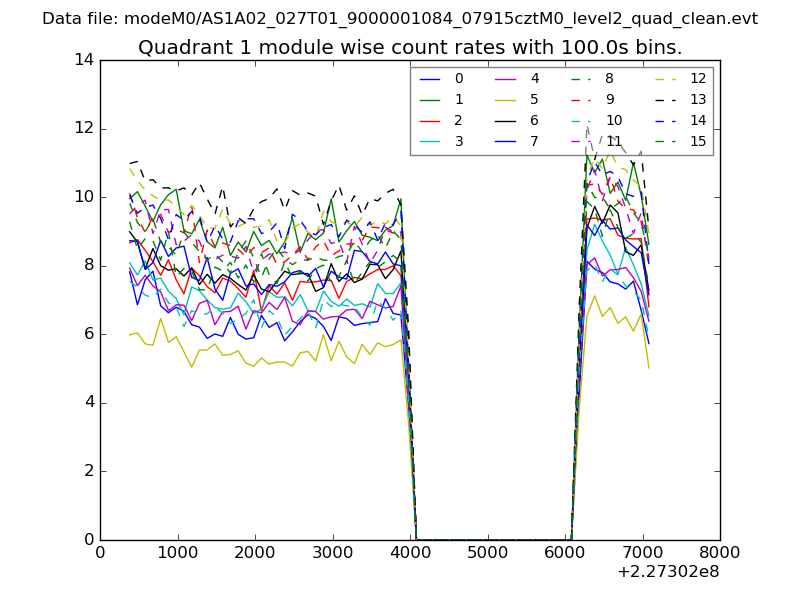 |
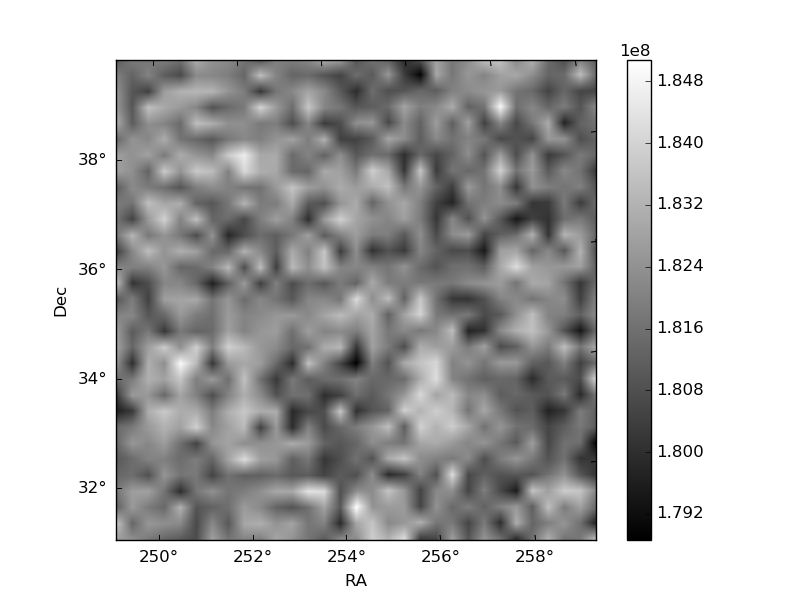 |
| Module-wise count rates for Quadrant C Data is divided into 100 sec bins |
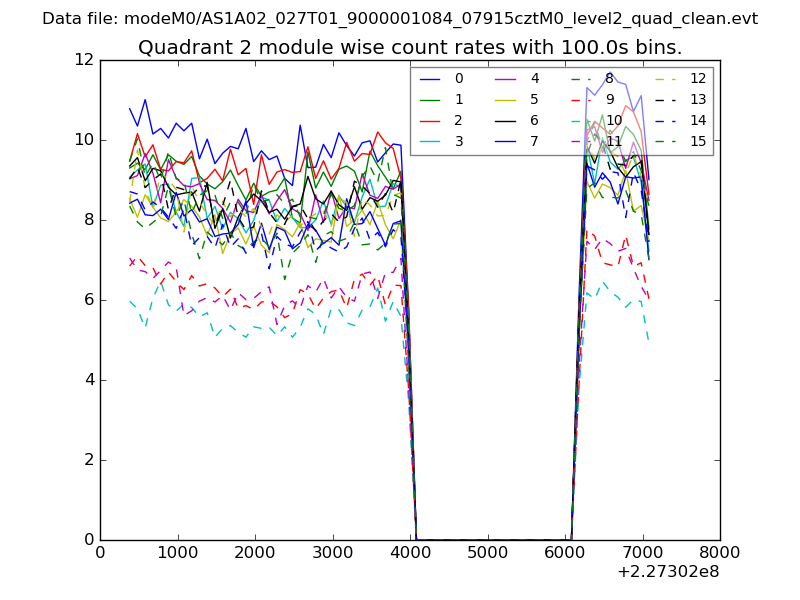 |
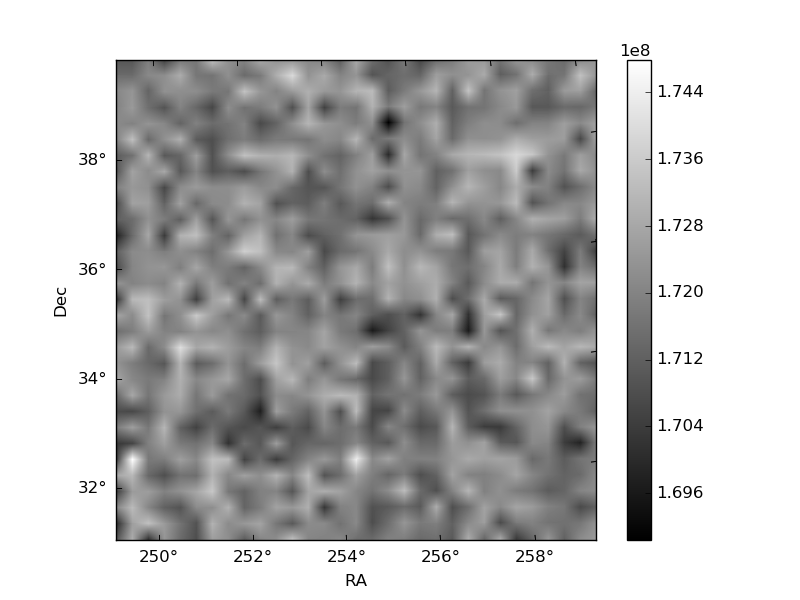 |
| Module-wise count rates for Quadrant D Data is divided into 100 sec bins |
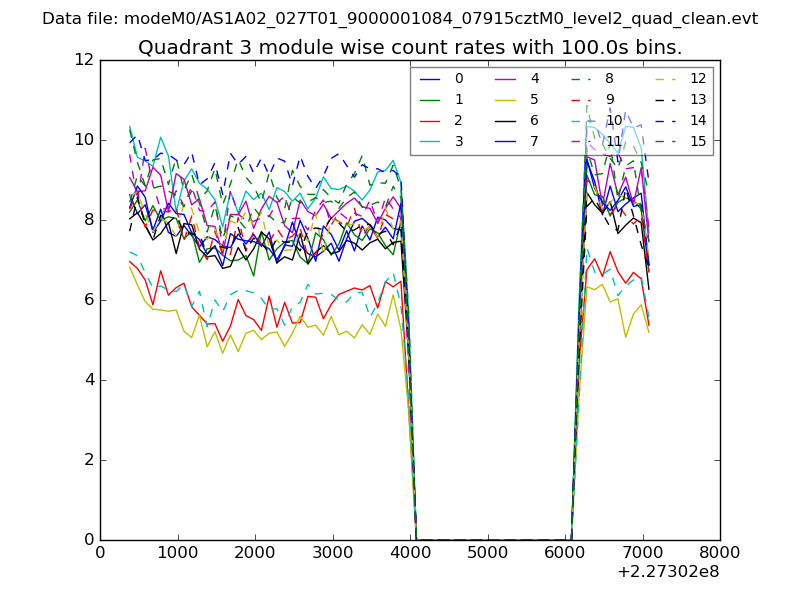 |
 |
| Parameter | Plot |
|---|---|
| CZT HV Monitor |  |
| D_VDD |  |
| Temperature 1 | 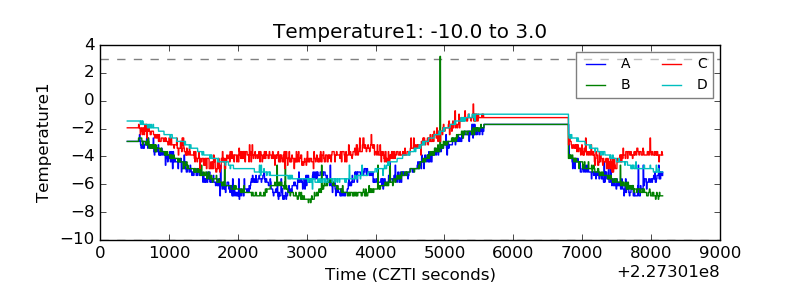 |
| Veto HV Monitor | 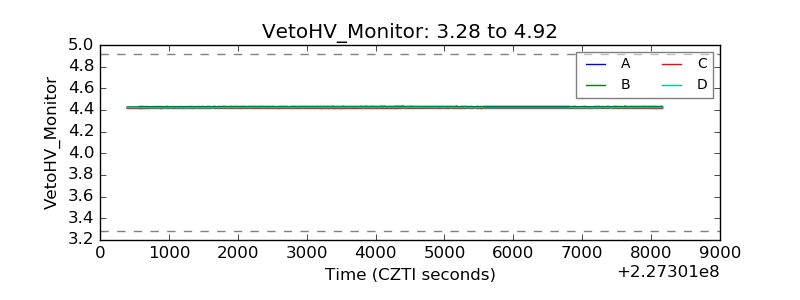 |
| Veto LLD | 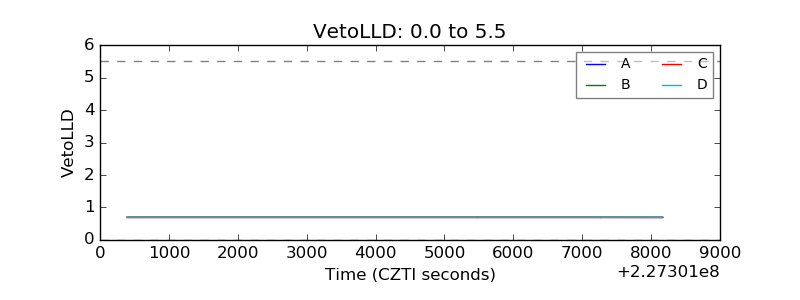 |
| Alpha Counter | 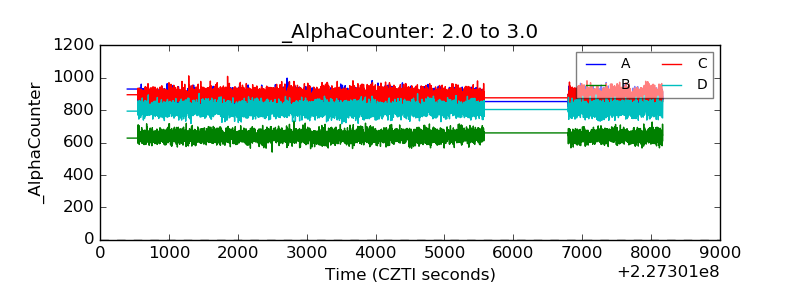 |
| _CPM_Rate | 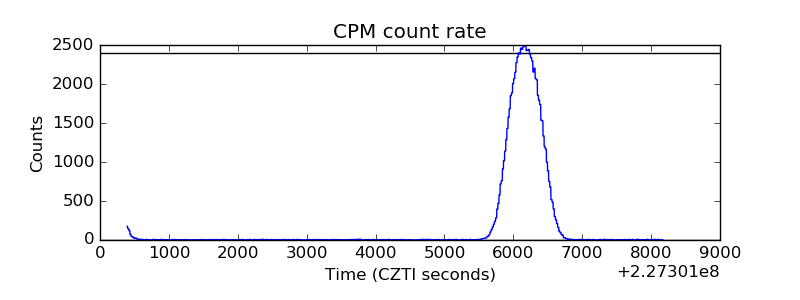 |
| CZT Counter | 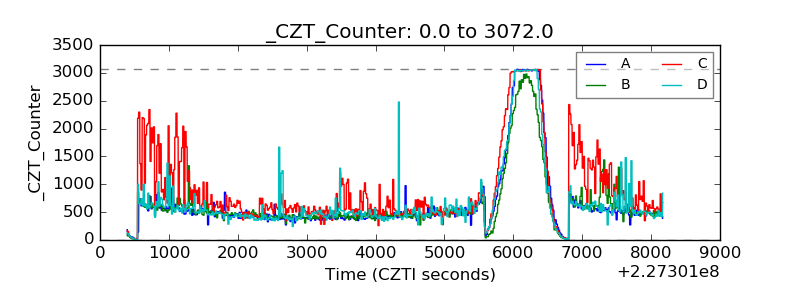 |
| +2.5 Volts monitor |  |
| +5 Volts monitor |  |
| _ROLL_ROT | 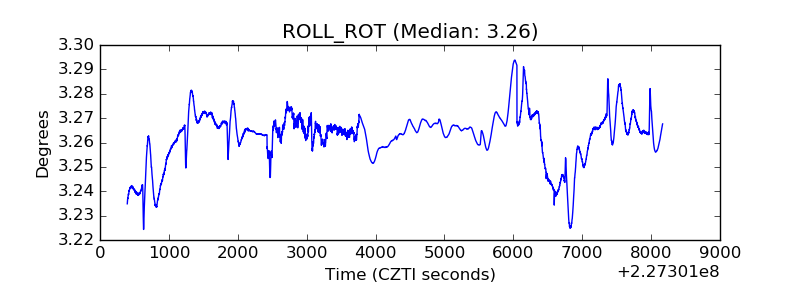 |
| _Roll_DEC | 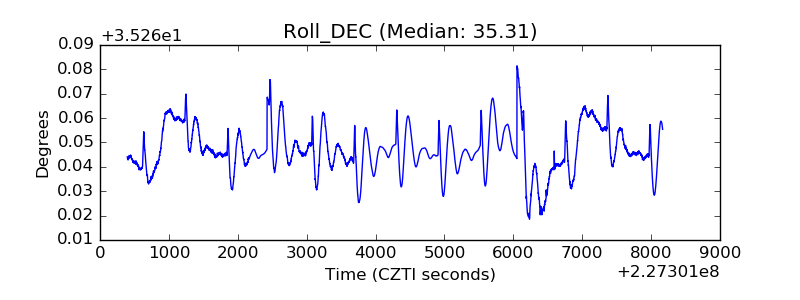 |
| _Roll_RA | 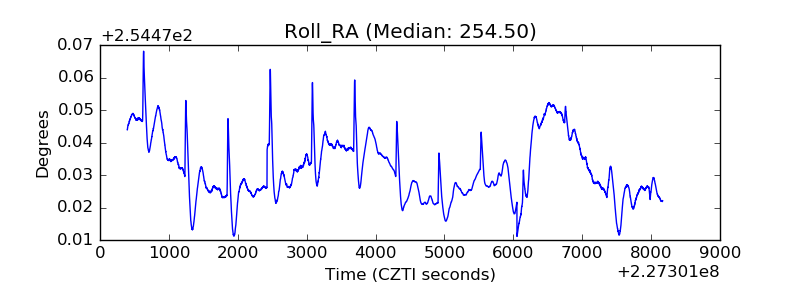 |
| Veto Counter | 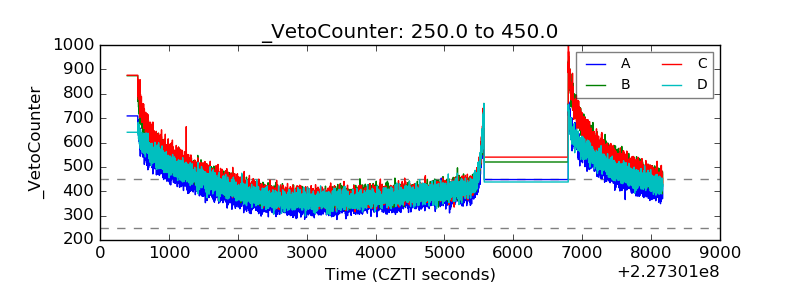 |