| Param | Original file | Final file |
|---|---|---|
| Filename | modeM0/AS1A02_027T01_9000001084_07916cztM0_level2.evt | modeM0/AS1A02_027T01_9000001084_07916cztM0_level2_quad_clean.evt |
| Size (bytes) | 479,223,360 | 101,736,000 |
| Size | 457.0 MB | 97.0 MB |
| Events in quadrant A | 2,986,447 | 651,787 |
| Events in quadrant B | 3,244,554 | 680,286 |
| Events in quadrant C | 4,308,302 | 675,408 |
| Events in quadrant D | 3,552,173 | 639,659 |
| Mode SS | |||
|---|---|---|---|
| Quadrant | BADHDUFLAG | Total packets | Discarded packets |
| A | 0 | 126 | 0 |
| B | 0 | 126 | 0 |
| C | 0 | 126 | 0 |
| D | 0 | 126 | 0 |
| Mode M0 | |||
|---|---|---|---|
| Quadrant | BADHDUFLAG | Total packets | Discarded packets |
| A | 0 | 13030 | 3 |
| B | 0 | 13727 | 2 |
| C | 0 | 16872 | 2 |
| D | 0 | 14656 | 2 |
| Mode M9 | |||
|---|---|---|---|
| Quadrant | BADHDUFLAG | Total packets | Discarded packets |
| A | 0 | 16 | 0 |
| B | 0 | 16 | 0 |
| C | 0 | 16 | 0 |
| D | 0 | 17 | 0 |
| Quadrant | Total seconds | Saturated seconds | Saturation percentage |
|---|---|---|---|
| A | 6220 | 31 | 0.498392% |
| B | 6220 | 43 | 0.691318% |
| C | 6220 | 214 | 3.440514% |
| D | 6220 | 67 | 1.077170% |
Noise dominated data is calculated using 1-second bins in cleaned event files. If a bin has >2000 counts, and if more than 50% of those come from <1% of pixels, then it is considered to be noise-dominated and hence unusable.
| Quadrant | # 1 sec bins | Bins with >0 counts | Bins with >2000 counts | High rate bins dominated by noise | Noise dominated (total time) | Noise dominated (detector-on time) | Marked lightcurve |
|---|---|---|---|---|---|---|---|
| A | 7515 | 6221 | 0 | 0 | 0.00% | 0.00% | 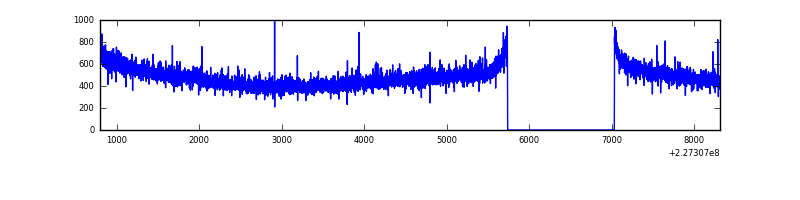 |
| B | 7515 | 6221 | 4 | 4 | 0.05% | 0.06% | 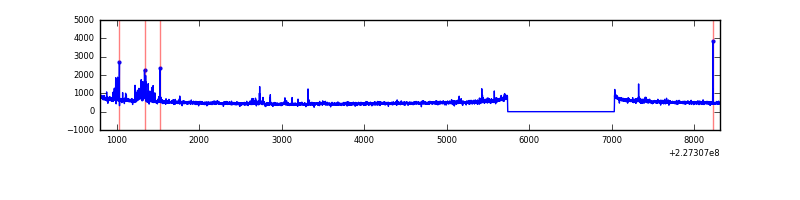 |
| C | 7515 | 6221 | 80 | 80 | 1.06% | 1.29% | 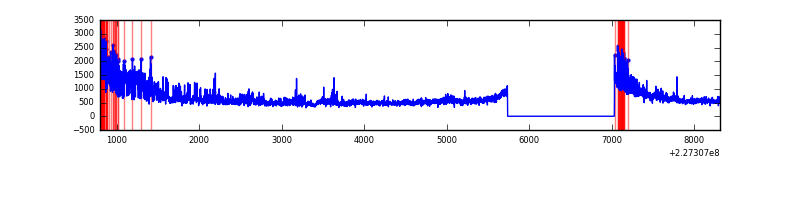 |
| D | 7515 | 6221 | 37 | 37 | 0.49% | 0.59% | 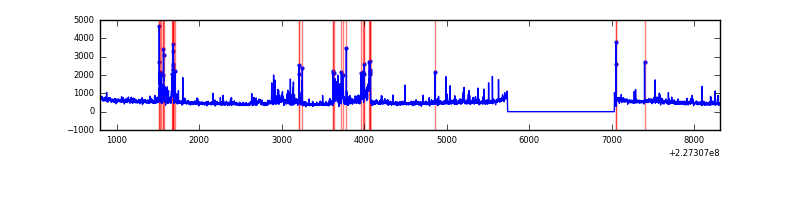 |
Top three noisy pixels from each quadrant. If the there are fewer than three noisy pixels in the level2.evt file, extra rows are filled as -1
| Pixel properties | Quadrant properties | ||||||
|---|---|---|---|---|---|---|---|
| Quadrant | DetID | PixID | Counts | Sigma | Mean | Median | Sigma |
| A | 0 | 226 | 7279 | 41.6 | 772 | 755 | 156.8 |
| A | 12 | 194 | 6923 | 39.33 | 772 | 755 | 156.8 |
| A | 15 | 234 | 5410 | 29.68 | 772 | 755 | 156.8 |
| B | 4 | 81 | 78371 | 521.87 | 789 | 772 | 148.7 |
| B | 4 | 239 | 46200 | 305.51 | 789 | 772 | 148.7 |
| B | 0 | 168 | 17900 | 115.19 | 789 | 772 | 148.7 |
| C | 1 | 16 | 1323994 | 7576.72 | 763 | 769 | 174.6 |
| C | 12 | 4 | 9061 | 47.48 | 763 | 769 | 174.6 |
| C | 13 | 61 | 5841 | 29.04 | 763 | 769 | 174.6 |
| D | 1 | 52 | 522666 | 2817.92 | 759 | 737 | 185.2 |
| D | 2 | 14 | 40645 | 215.47 | 759 | 737 | 185.2 |
| D | 1 | 31 | 37855 | 200.4 | 759 | 737 | 185.2 |
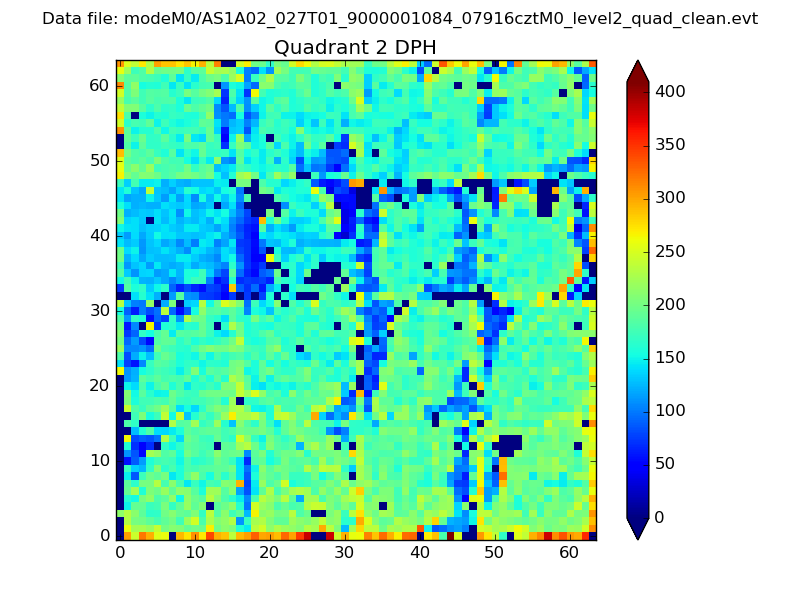
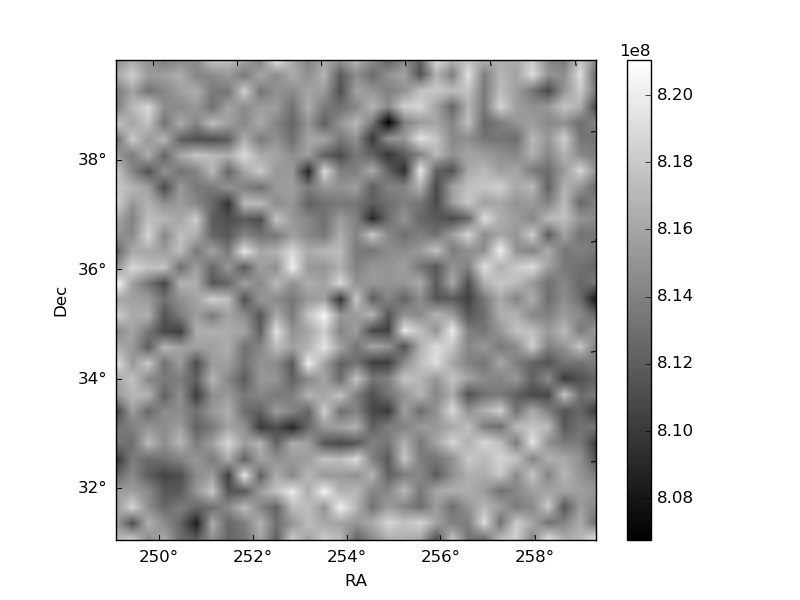
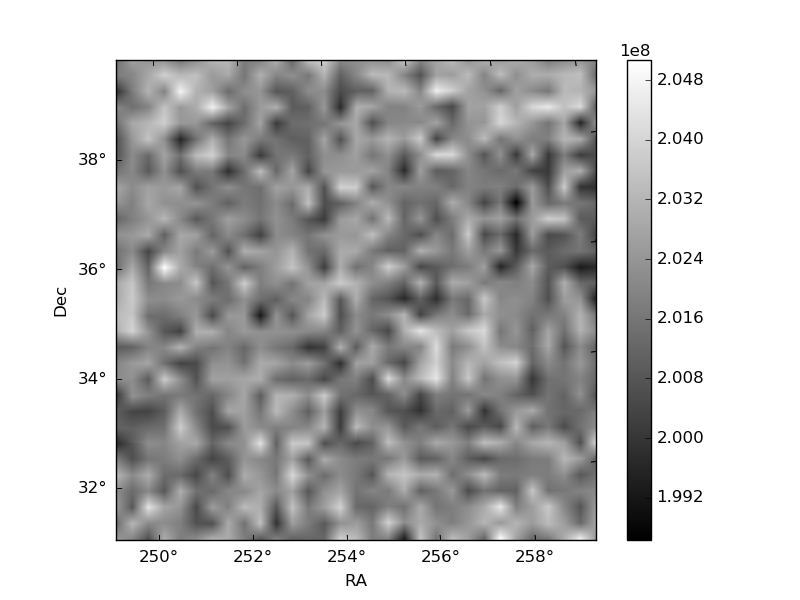
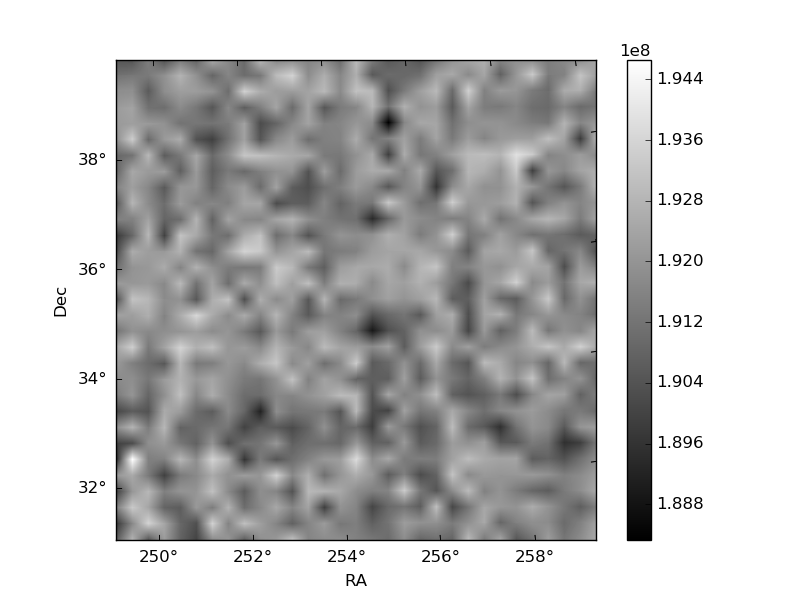
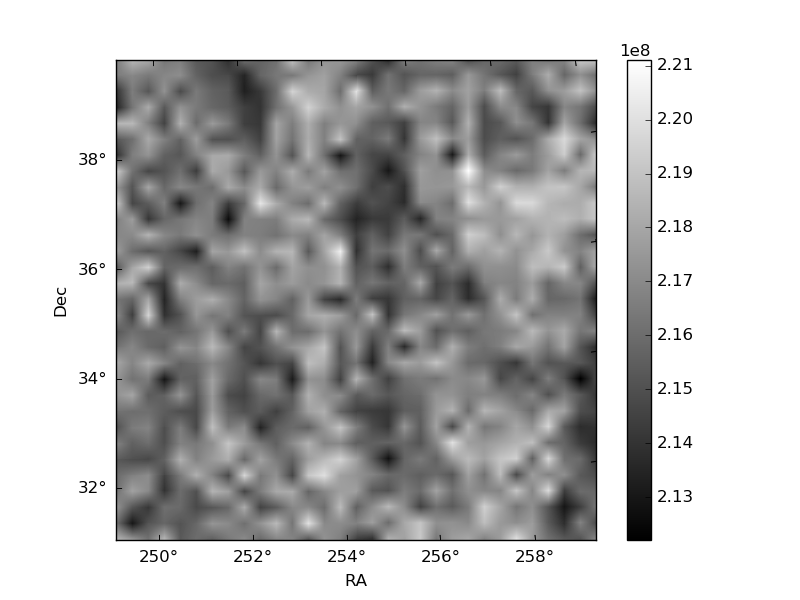
Histogram calculated using DETX and DETY for each event in the final _common_clean file
| Quadrant A | 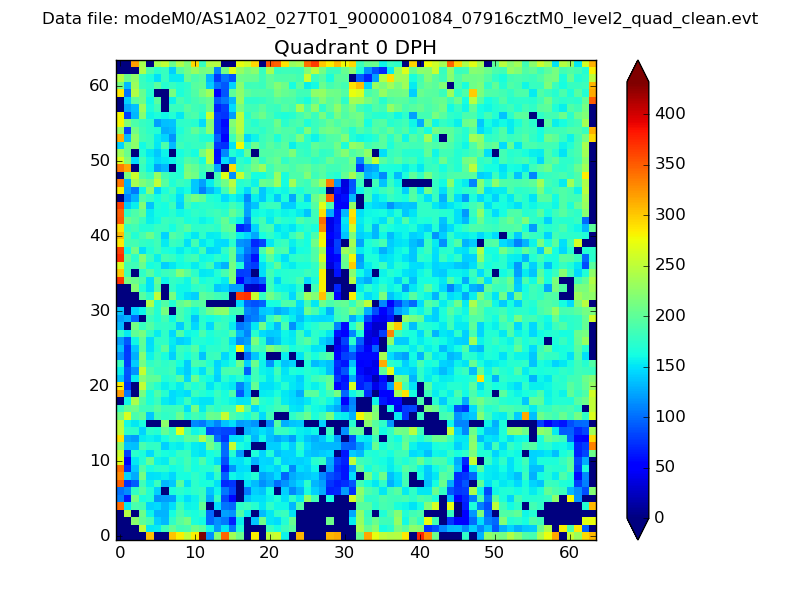 |
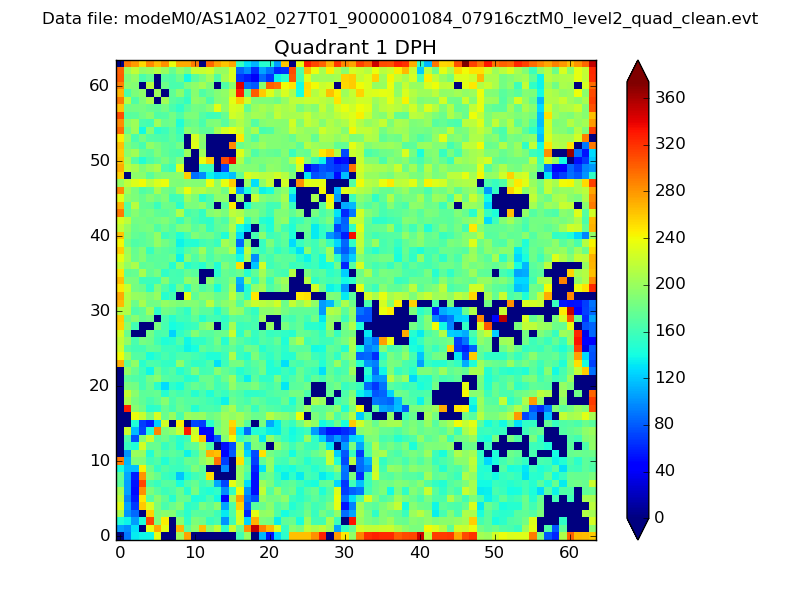 |
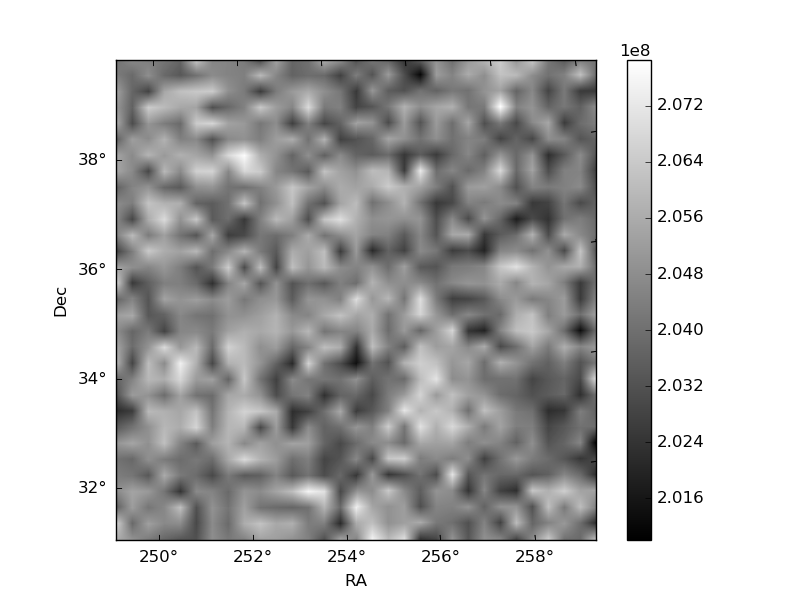
Quadrant B |
|---|---|---|---|
| Quadrant D | 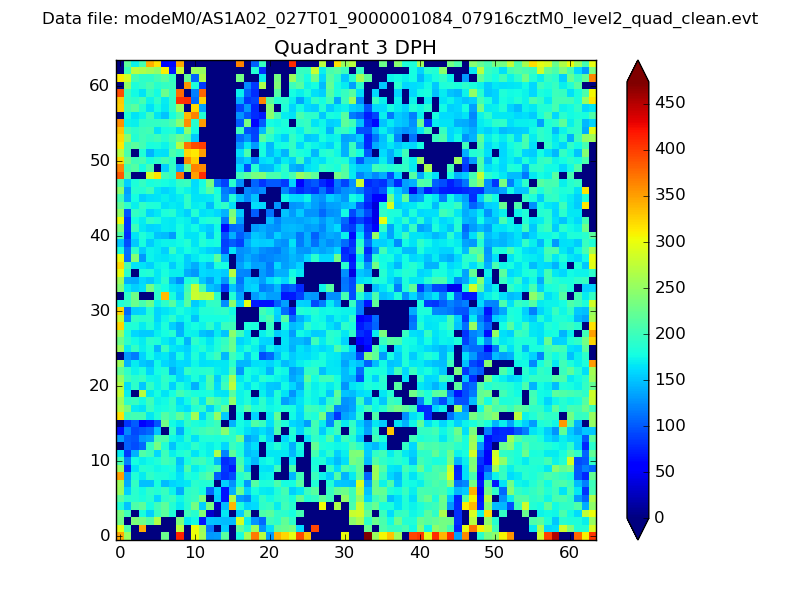 |
 |
Quadrant C |
| Plot type | Count rate plots | Images |
|---|---|---|
| Comparison with Poisson distribution Blue bars denote a histogram of data divided into 1 sec bins. Red curve is a Poisson curve with rate = median count rate of data. |
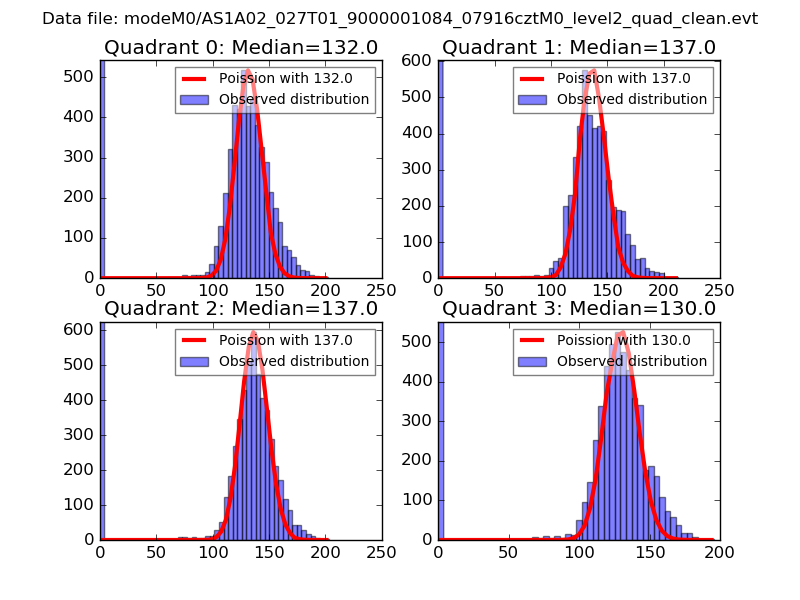 |
 |
| Quadrant-wise count rates Data is divided into 100 sec bins |
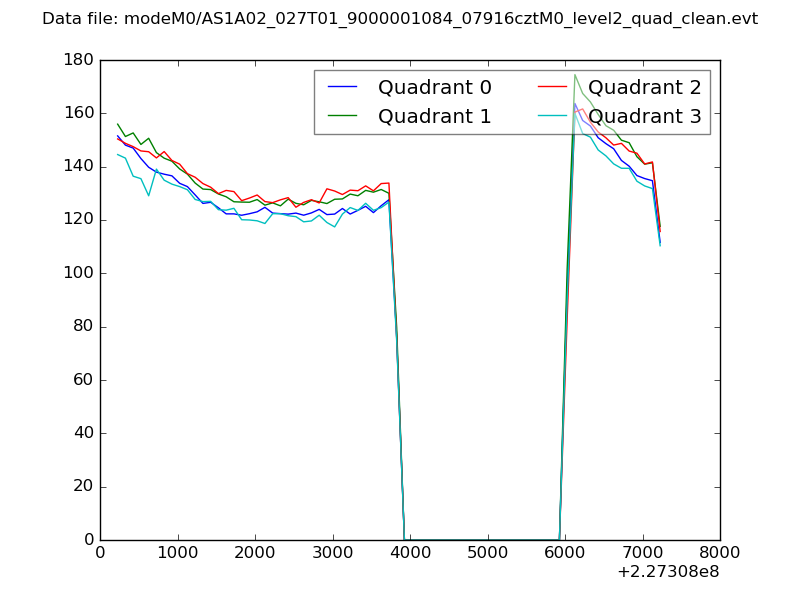 |
|
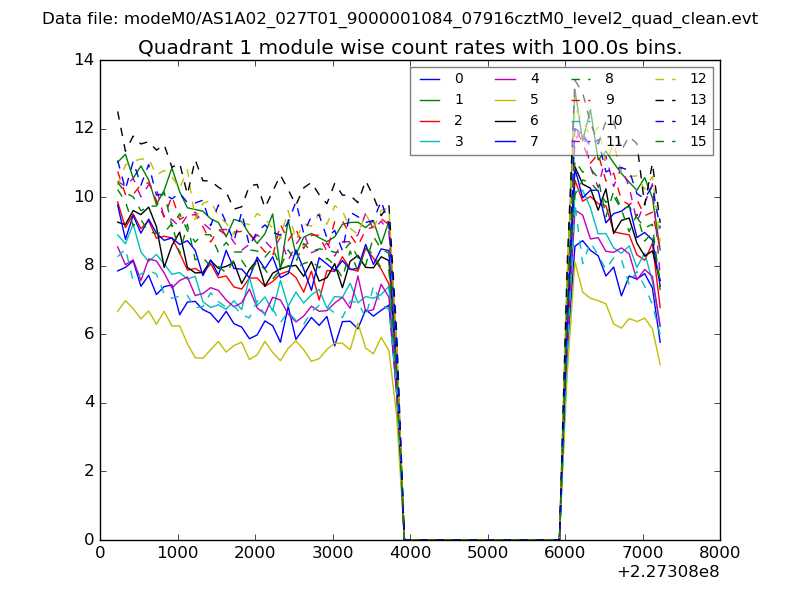
| Module-wise count rates for Quadrant A Data is divided into 100 sec bins |
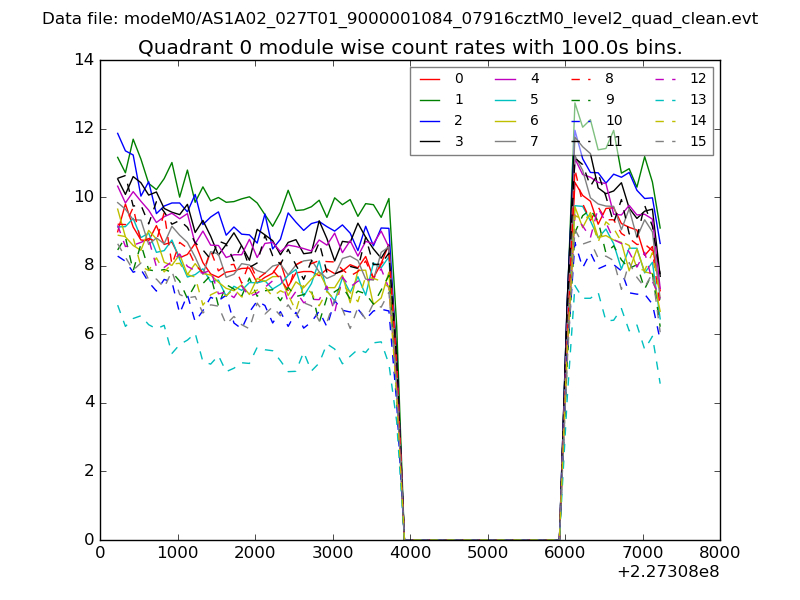 |
 |
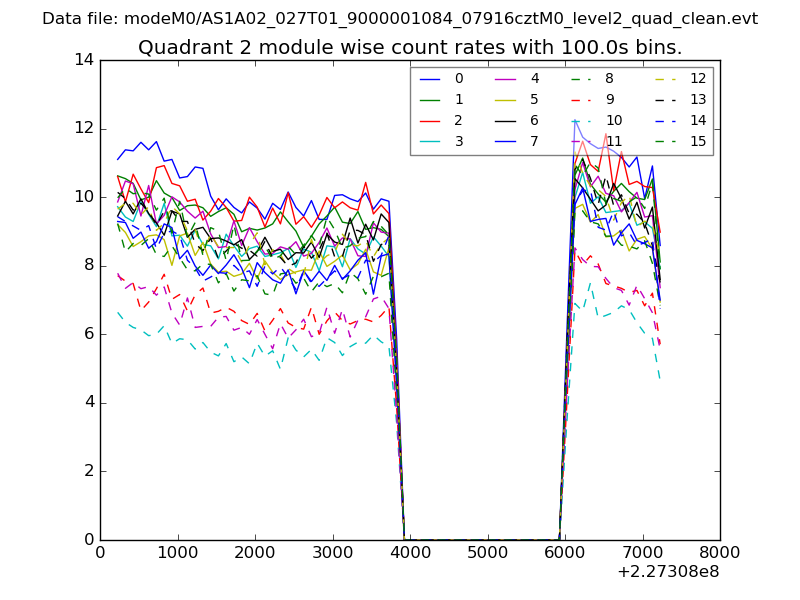
| Module-wise count rates for Quadrant B Data is divided into 100 sec bins |
 |
 |
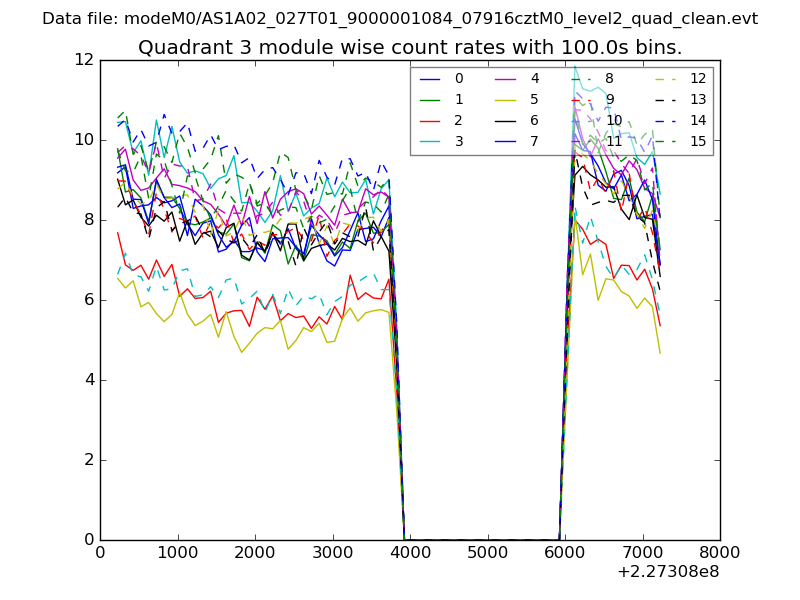
| Module-wise count rates for Quadrant C Data is divided into 100 sec bins |
 |
 |
| Module-wise count rates for Quadrant D Data is divided into 100 sec bins |
 |
 |
| Parameter | Plot |
|---|---|
| CZT HV Monitor | 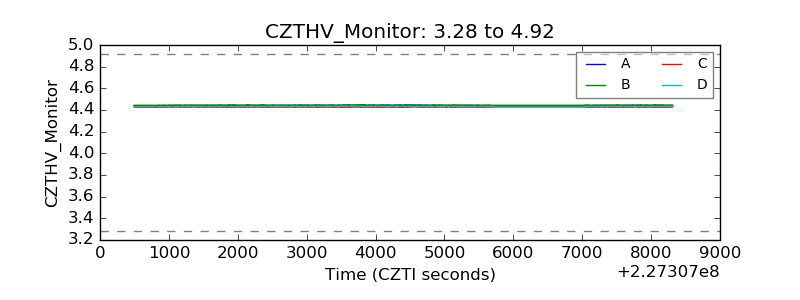 |
| D_VDD | 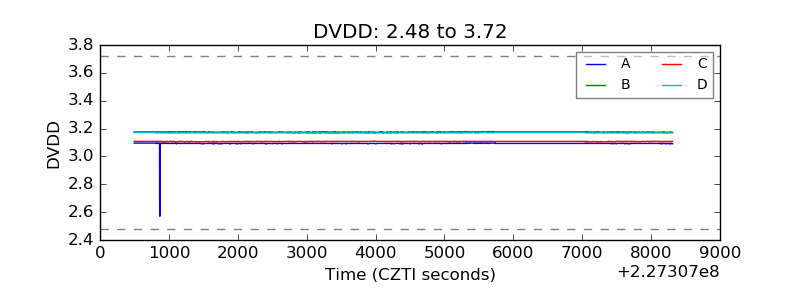 |
| Temperature 1 | 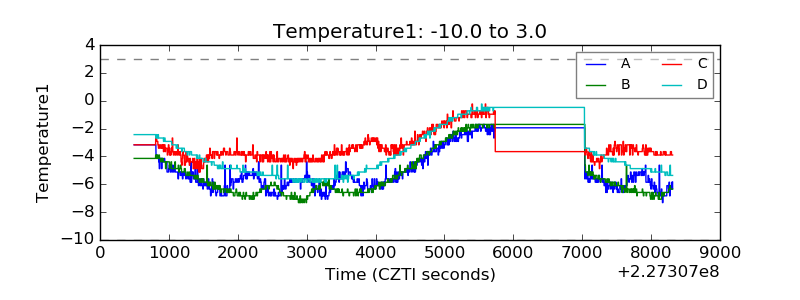 |
| Veto HV Monitor | 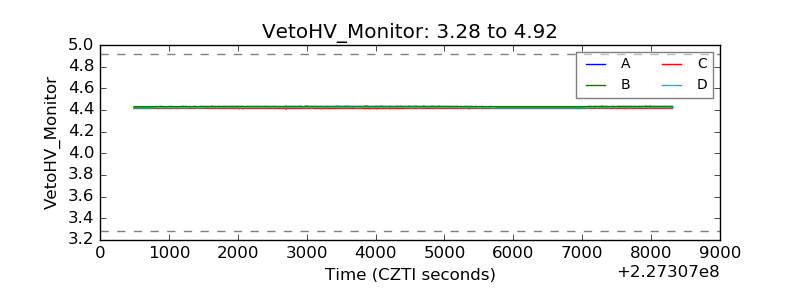 |
| Veto LLD | 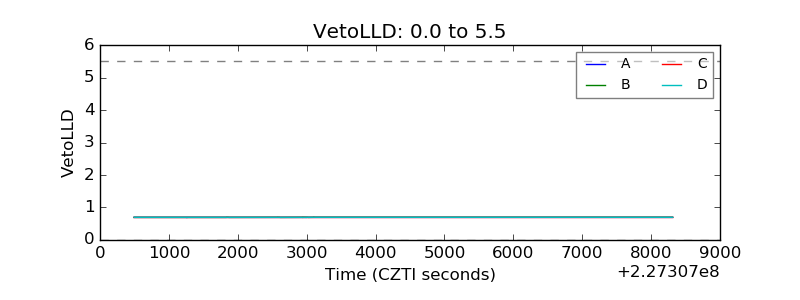 |
| Alpha Counter | 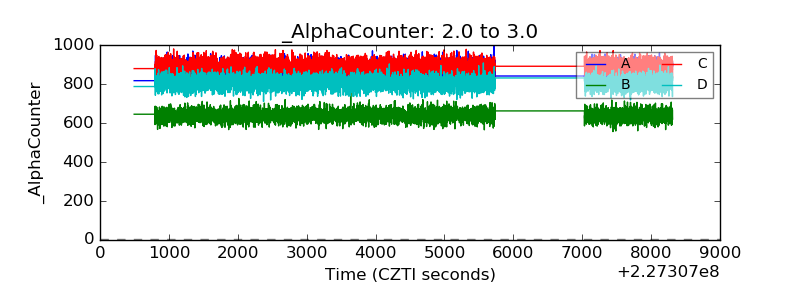 |
| _CPM_Rate | 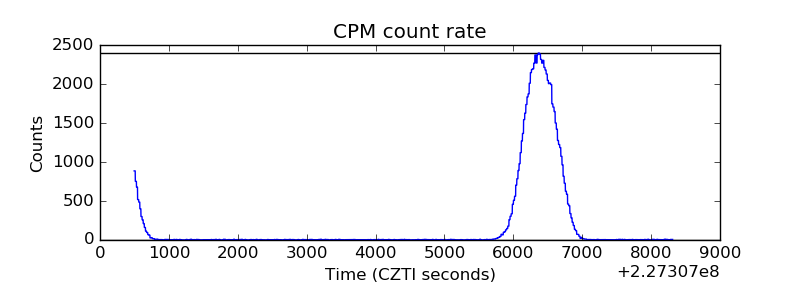 |
| CZT Counter | 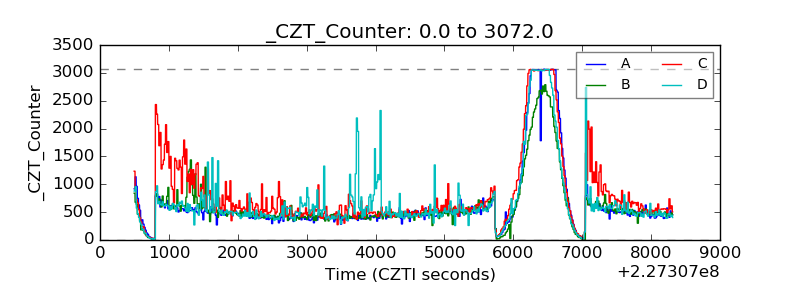 |
| +2.5 Volts monitor | 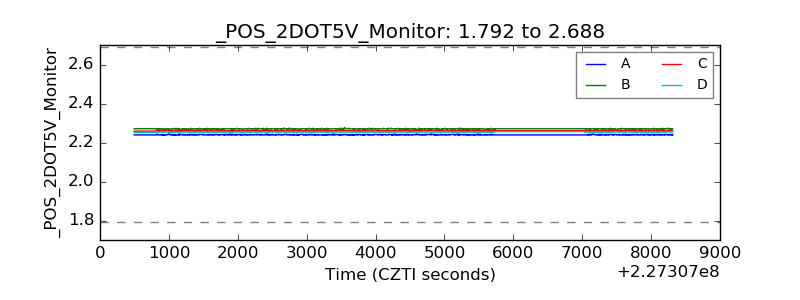 |
| +5 Volts monitor | 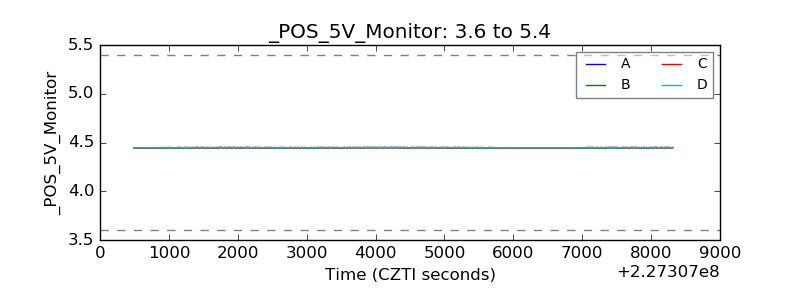 |
| _ROLL_ROT | 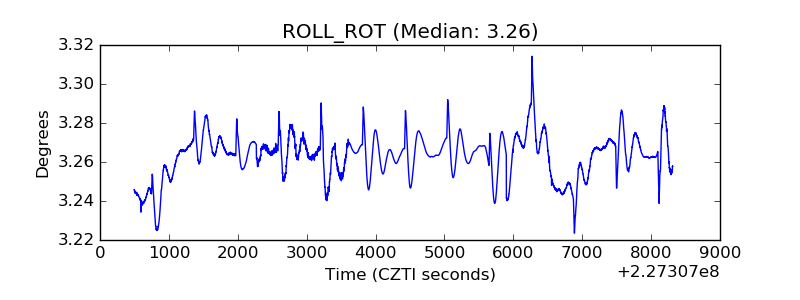 |
| _Roll_DEC | 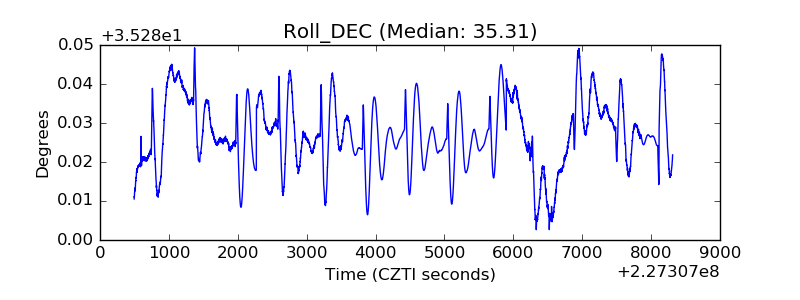 |
| _Roll_RA | 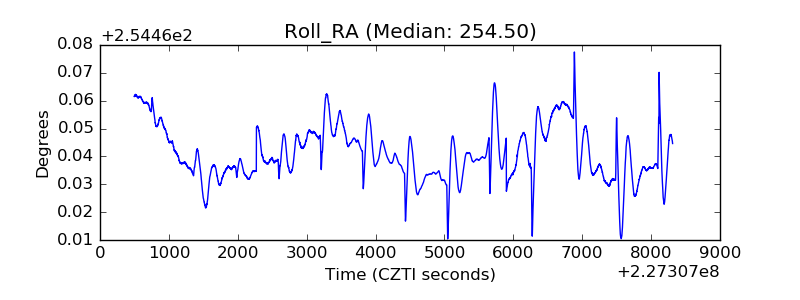 |
| Veto Counter | 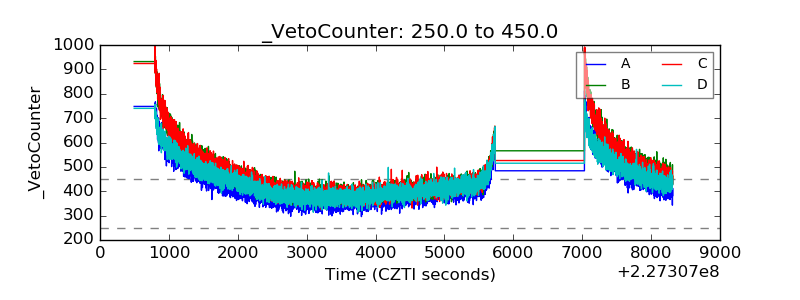 |