| Param | Original file | Final file |
|---|---|---|
| Filename | modeM0/AS1A02_027T01_9000001084_07918cztM0_level2.evt | modeM0/AS1A02_027T01_9000001084_07918cztM0_level2_quad_clean.evt |
| Size (bytes) | 718,787,520 | 143,942,400 |
| Size | 685.5 MB | 137.3 MB |
| Events in quadrant A | 4,743,105 | 905,918 |
| Events in quadrant B | 4,963,123 | 953,250 |
| Events in quadrant C | 5,814,751 | 940,519 |
| Events in quadrant D | 5,586,857 | 883,788 |
| Mode SS | |||
|---|---|---|---|
| Quadrant | BADHDUFLAG | Total packets | Discarded packets |
| A | 0 | 198 | 0 |
| B | 0 | 198 | 0 |
| C | 0 | 198 | 0 |
| D | 0 | 198 | 0 |
| Mode M0 | |||
|---|---|---|---|
| Quadrant | BADHDUFLAG | Total packets | Discarded packets |
| A | 0 | 20639 | 3 |
| B | 0 | 21282 | 2 |
| C | 0 | 23517 | 2 |
| D | 0 | 23110 | 2 |
| Mode M9 | |||
|---|---|---|---|
| Quadrant | BADHDUFLAG | Total packets | Discarded packets |
| A | 0 | 17 | 0 |
| B | 0 | 17 | 0 |
| C | 0 | 17 | 0 |
| D | 0 | 18 | 0 |
| Quadrant | Total seconds | Saturated seconds | Saturation percentage |
|---|---|---|---|
| A | 9751 | 32 | 0.328171% |
| B | 9751 | 102 | 1.046047% |
| C | 9751 | 132 | 1.353707% |
| D | 9751 | 222 | 2.276690% |
Noise dominated data is calculated using 1-second bins in cleaned event files. If a bin has >2000 counts, and if more than 50% of those come from <1% of pixels, then it is considered to be noise-dominated and hence unusable.
| Quadrant | # 1 sec bins | Bins with >0 counts | Bins with >2000 counts | High rate bins dominated by noise | Noise dominated (total time) | Noise dominated (detector-on time) | Marked lightcurve |
|---|---|---|---|---|---|---|---|
| A | 11066 | 9752 | 4 | 4 | 0.04% | 0.04% | 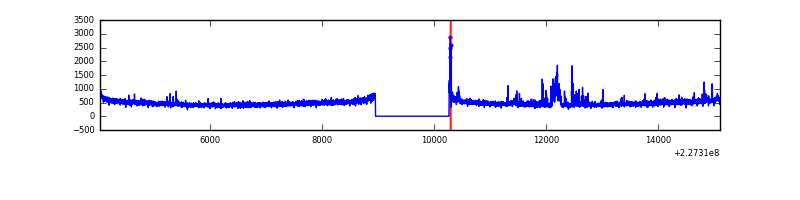 |
| B | 11066 | 9752 | 38 | 38 | 0.34% | 0.39% | 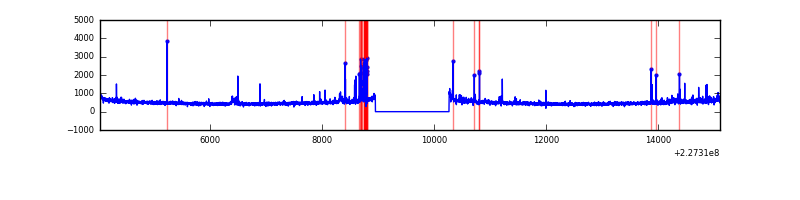 |
| C | 11066 | 9752 | 42 | 42 | 0.38% | 0.43% | 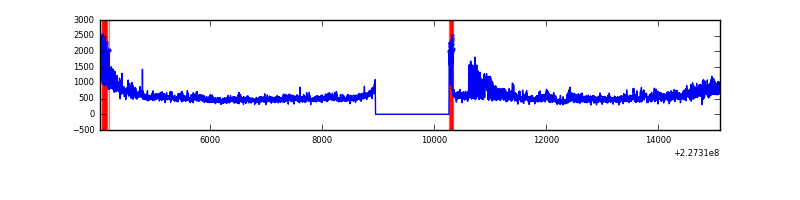 |
| D | 11066 | 9752 | 173 | 173 | 1.56% | 1.77% | 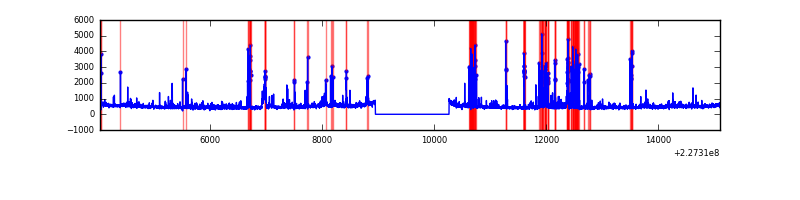 |
Top three noisy pixels from each quadrant. If the there are fewer than three noisy pixels in the level2.evt file, extra rows are filled as -1
| Pixel properties | Quadrant properties | ||||||
|---|---|---|---|---|---|---|---|
| Quadrant | DetID | PixID | Counts | Sigma | Mean | Median | Sigma |
| A | 15 | 239 | 115132 | 477.5 | 1175 | 1151 | 238.7 |
| A | 15 | 234 | 97059 | 401.79 | 1175 | 1151 | 238.7 |
| A | 0 | 226 | 10915 | 40.9 | 1175 | 1151 | 238.7 |
| B | 4 | 239 | 161779 | 726.92 | 1194 | 1167 | 220.9 |
| B | 0 | 214 | 36424 | 159.57 | 1194 | 1167 | 220.9 |
| B | 10 | 16 | 34652 | 151.55 | 1194 | 1167 | 220.9 |
| C | 1 | 16 | 1301060 | 4913.96 | 1155 | 1166 | 264.5 |
| C | 12 | 4 | 9532 | 31.63 | 1155 | 1166 | 264.5 |
| C | 13 | 61 | 8931 | 29.35 | 1155 | 1166 | 264.5 |
| D | 1 | 52 | 602094 | 2165.88 | 1139 | 1107 | 277.5 |
| D | 14 | 34 | 396401 | 1424.59 | 1139 | 1107 | 277.5 |
| D | 5 | 233 | 142525 | 509.65 | 1139 | 1107 | 277.5 |
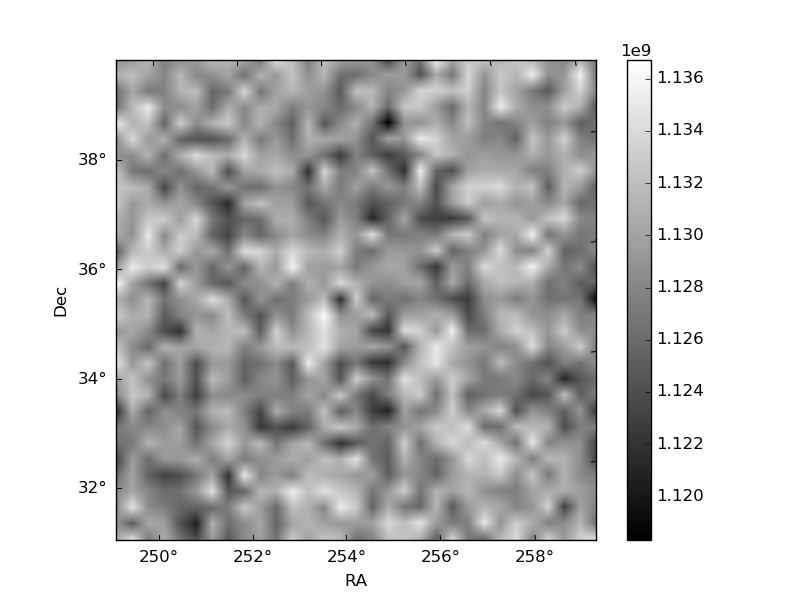
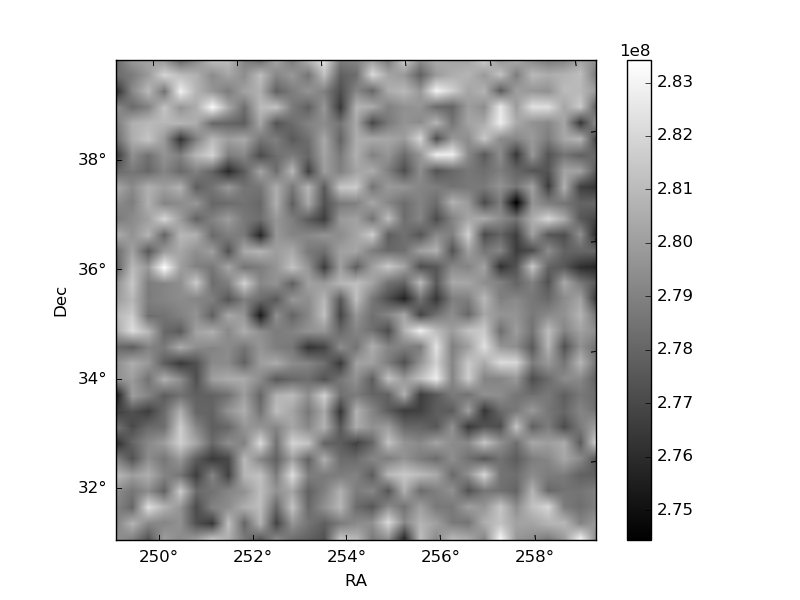
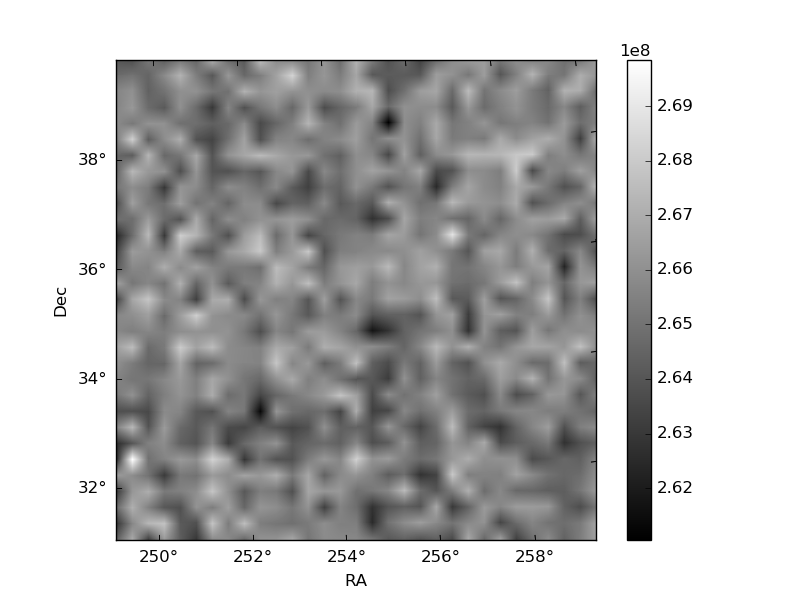
Histogram calculated using DETX and DETY for each event in the final _common_clean file
| Quadrant A | 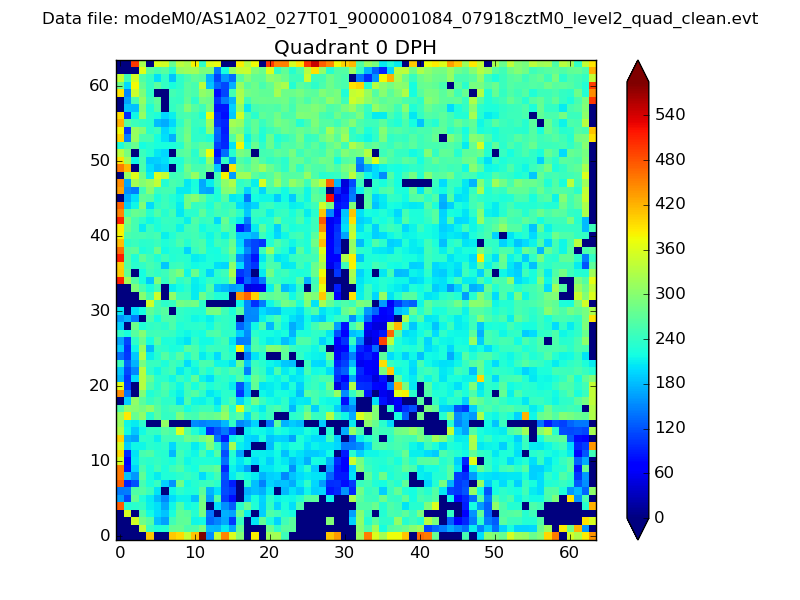 |
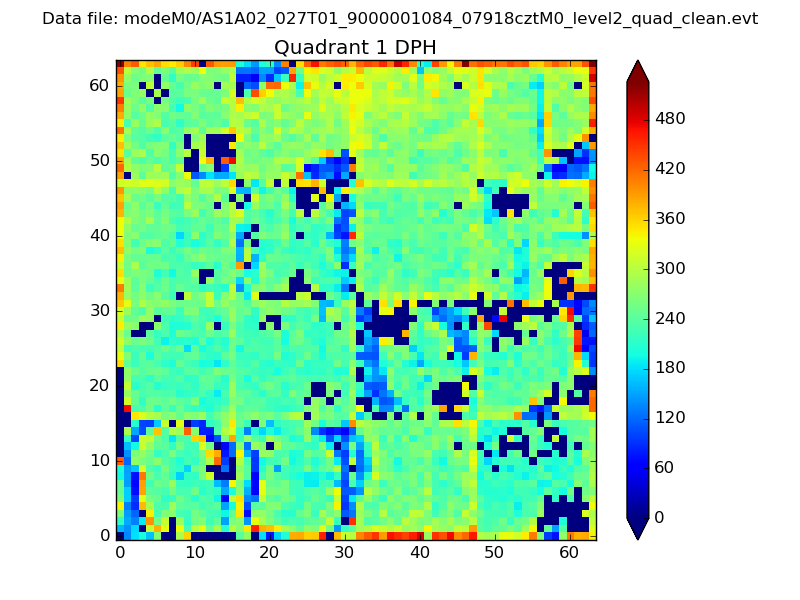 |
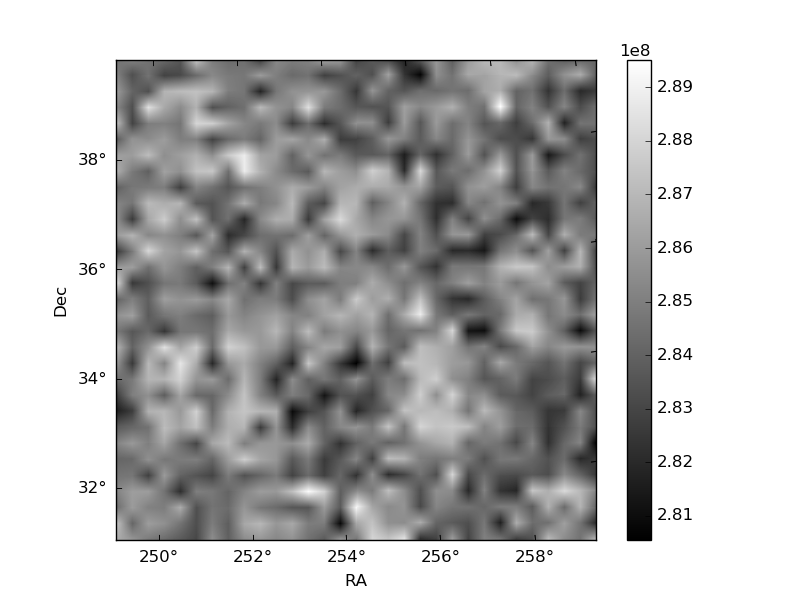
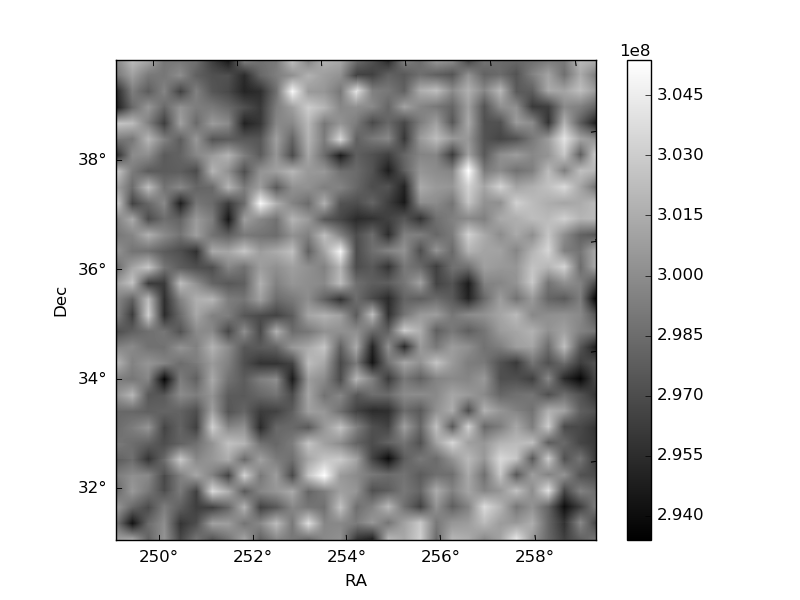
Quadrant B |
|---|---|---|---|
| Quadrant D | 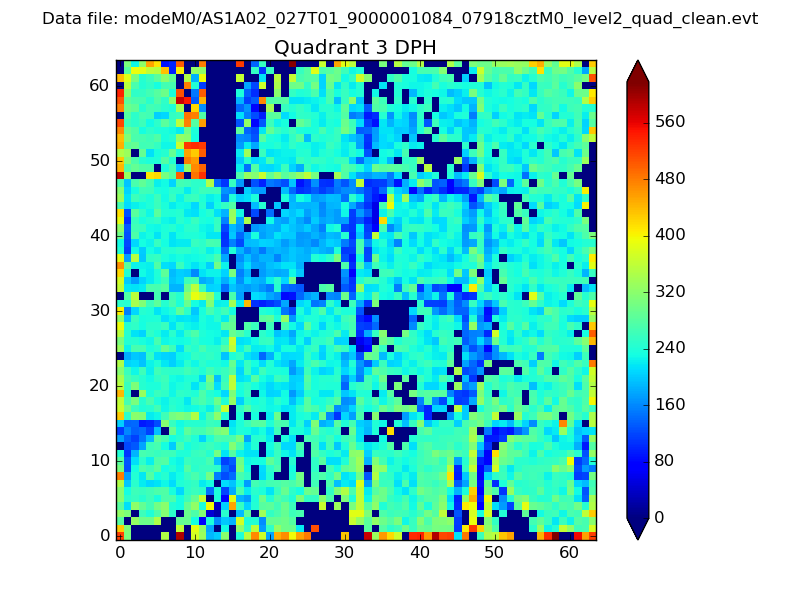 |
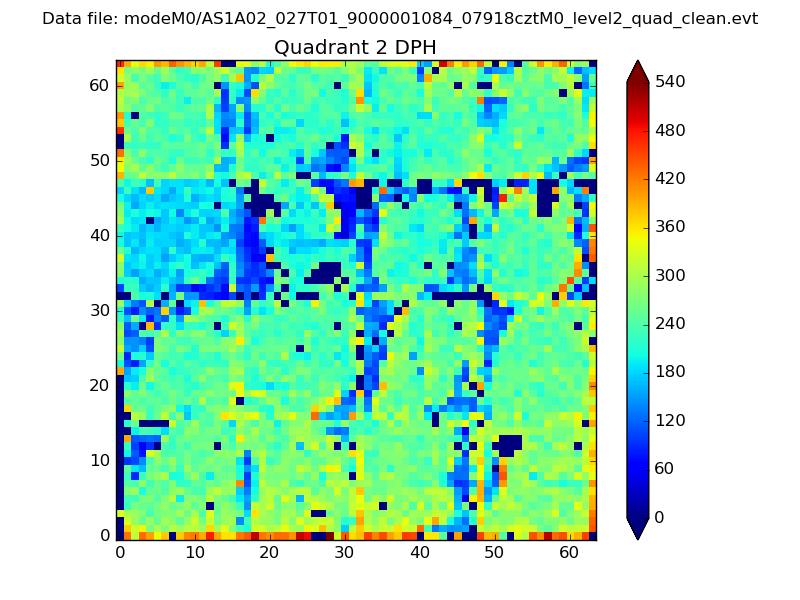 |
Quadrant C |
| Plot type | Count rate plots | Images |
|---|---|---|
| Comparison with Poisson distribution Blue bars denote a histogram of data divided into 1 sec bins. Red curve is a Poisson curve with rate = median count rate of data. |
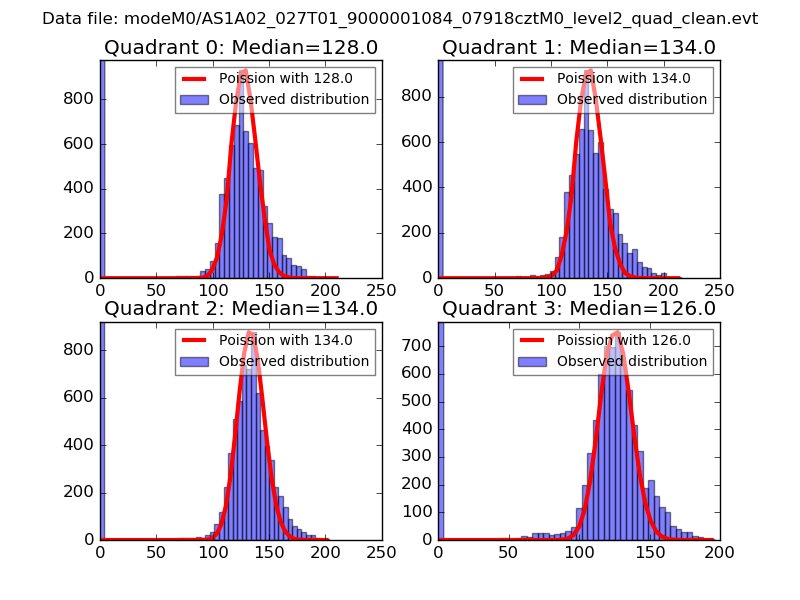 |
 |
| Quadrant-wise count rates Data is divided into 100 sec bins |
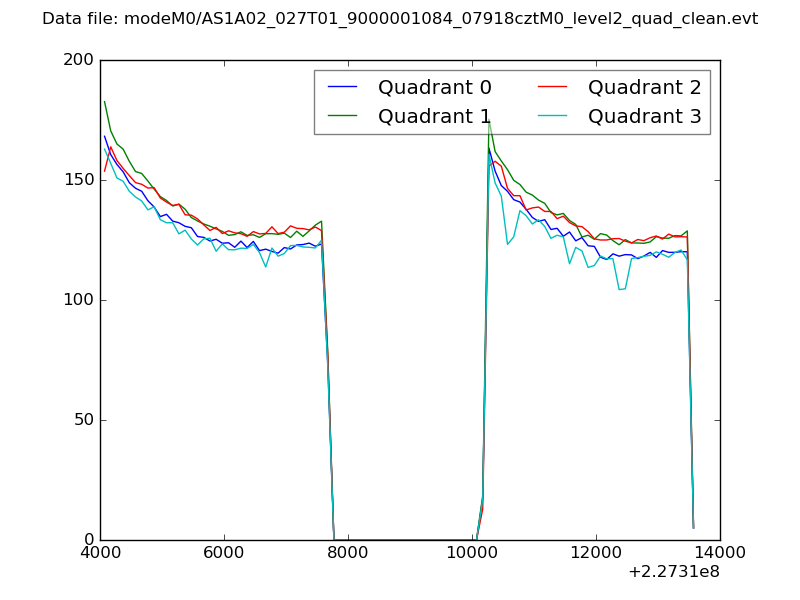 |
|
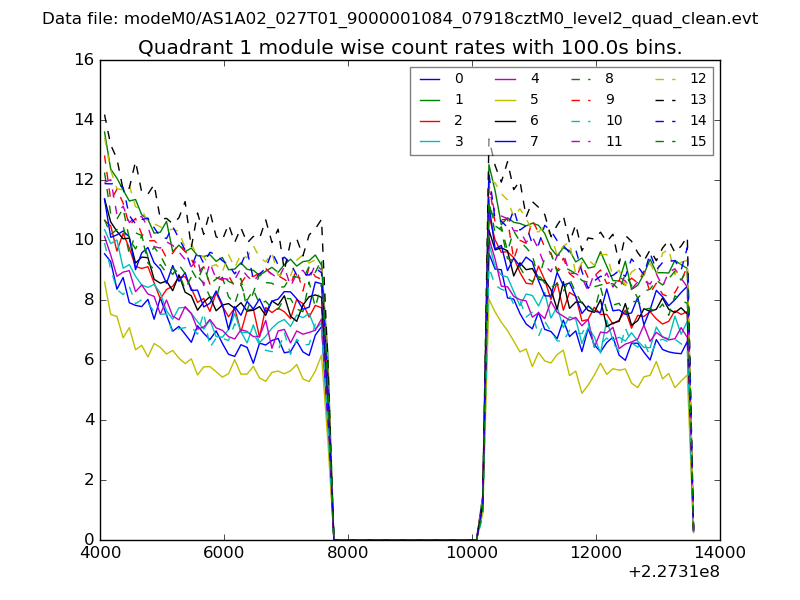
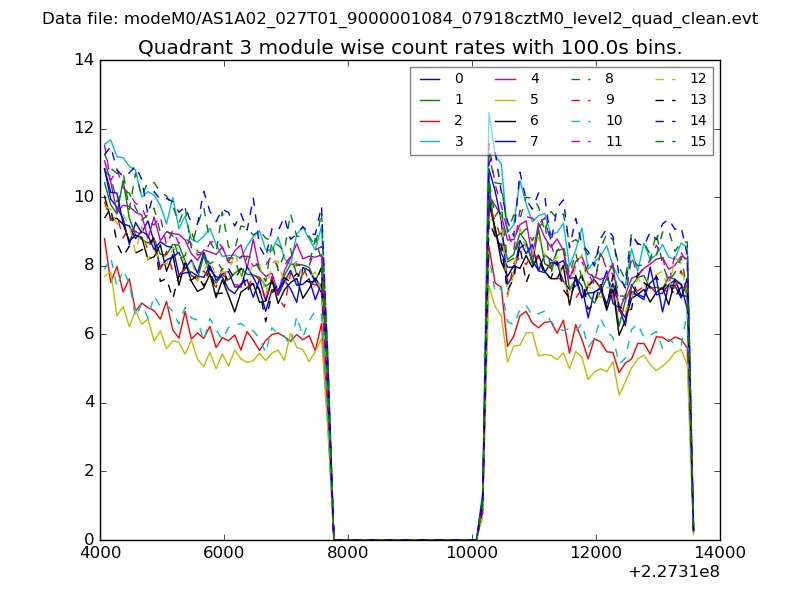
| Module-wise count rates for Quadrant A Data is divided into 100 sec bins |
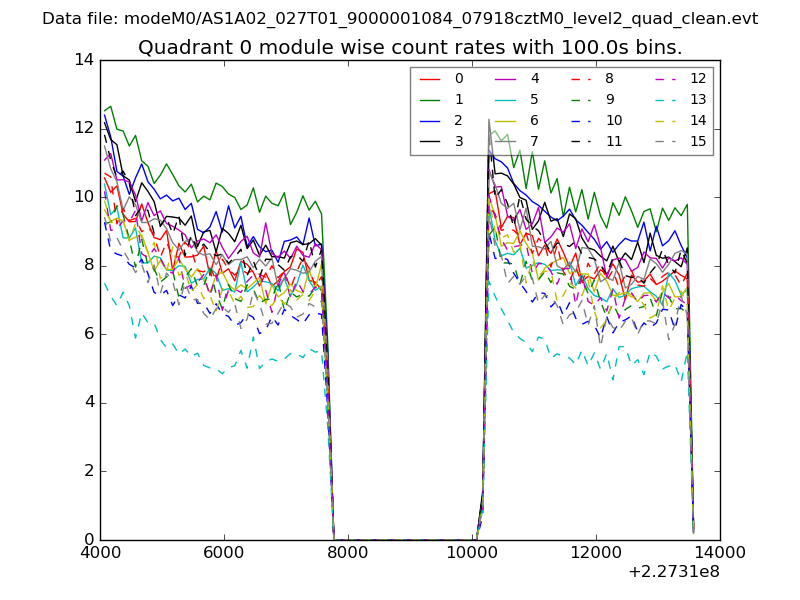 |
 |
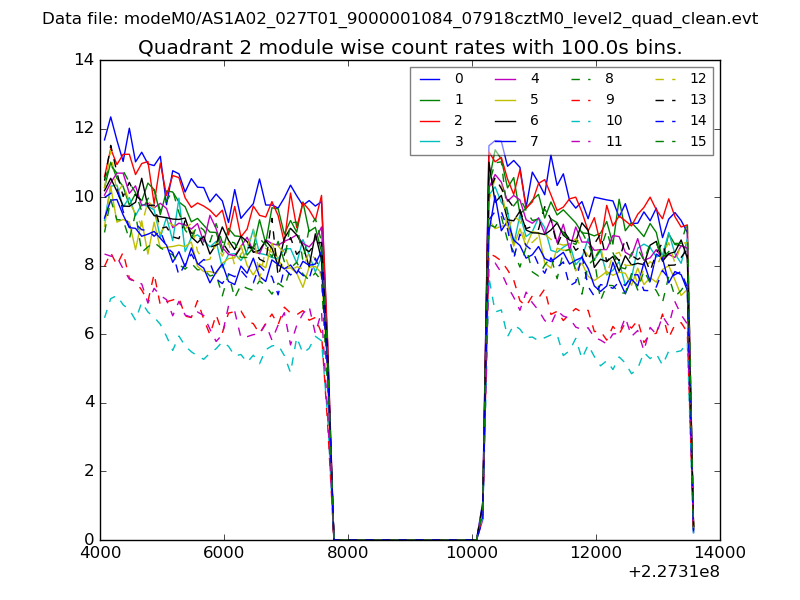
| Module-wise count rates for Quadrant B Data is divided into 100 sec bins |
 |
 |
| Module-wise count rates for Quadrant C Data is divided into 100 sec bins |
 |
 |
| Module-wise count rates for Quadrant D Data is divided into 100 sec bins |
 |
 |
| Parameter | Plot |
|---|---|
| CZT HV Monitor | 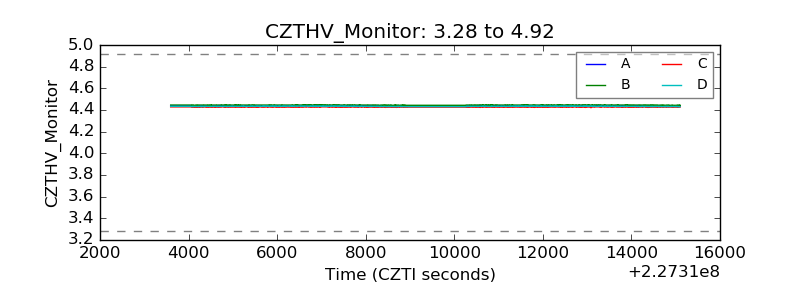 |
| D_VDD | 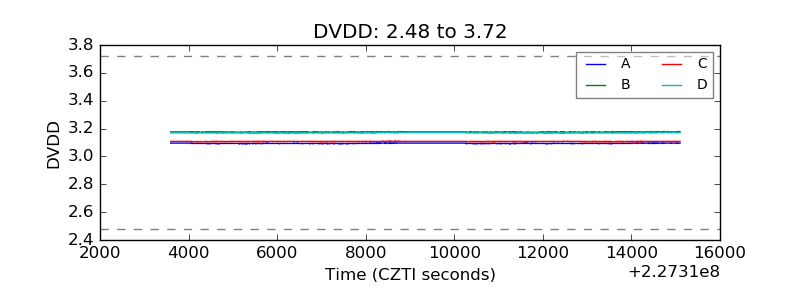 |
| Temperature 1 | 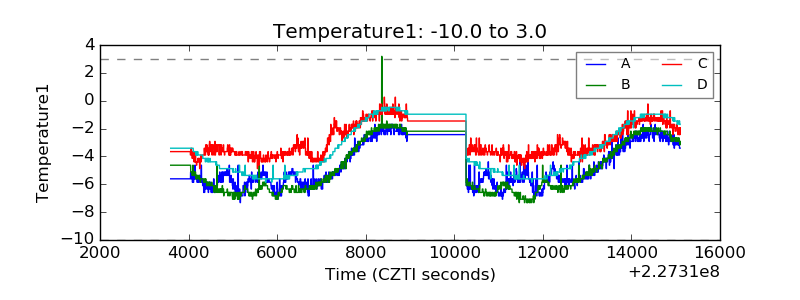 |
| Veto HV Monitor | 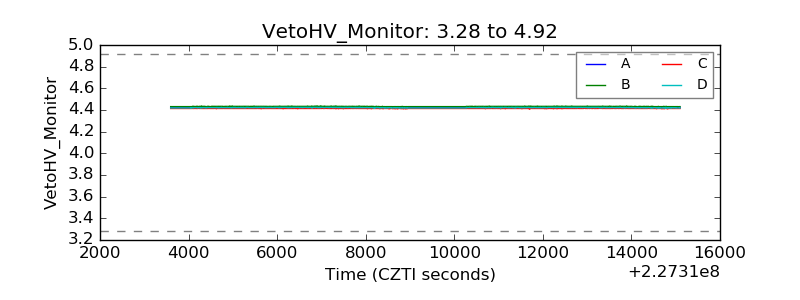 |
| Veto LLD | 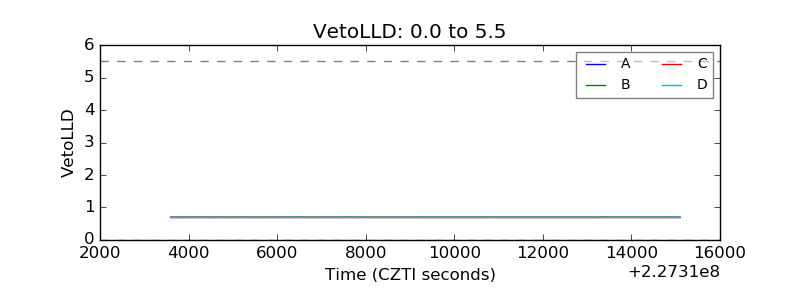 |
| Alpha Counter | 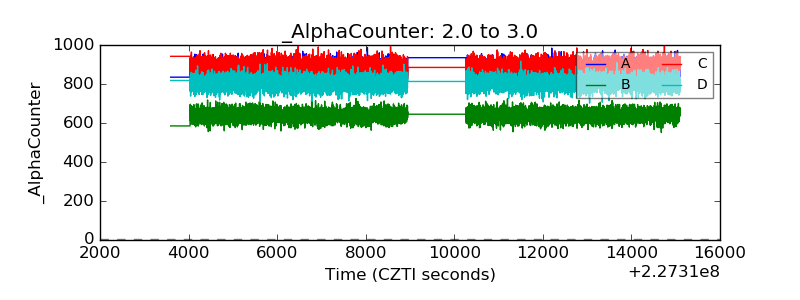 |
| _CPM_Rate | 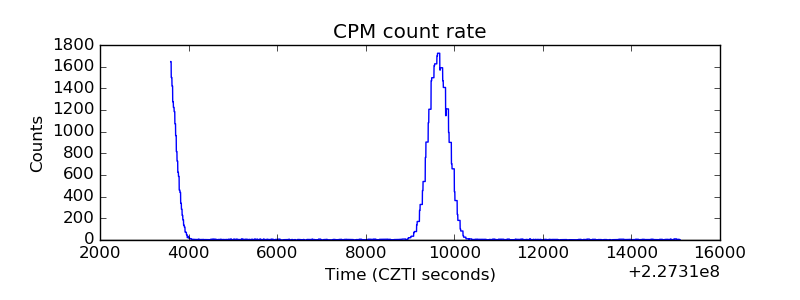 |
| CZT Counter | 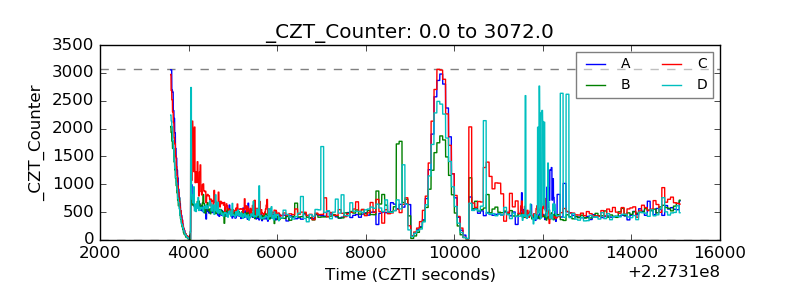 |
| +2.5 Volts monitor |  |
| +5 Volts monitor |  |
| _ROLL_ROT | 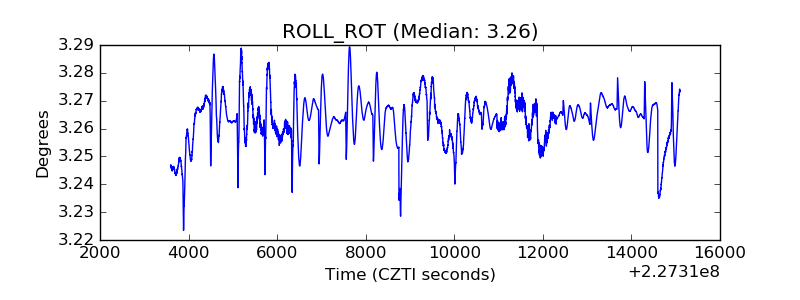 |
| _Roll_DEC | 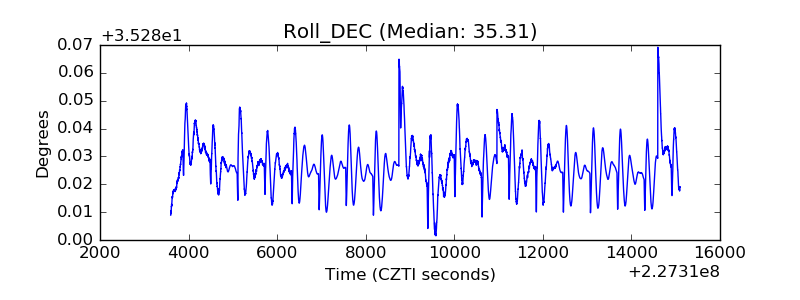 |
| _Roll_RA | 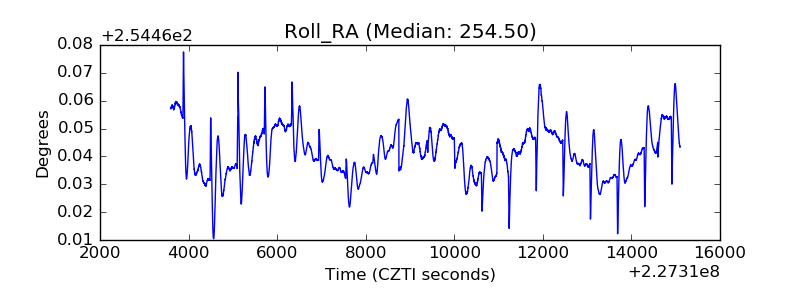 |
| Veto Counter | 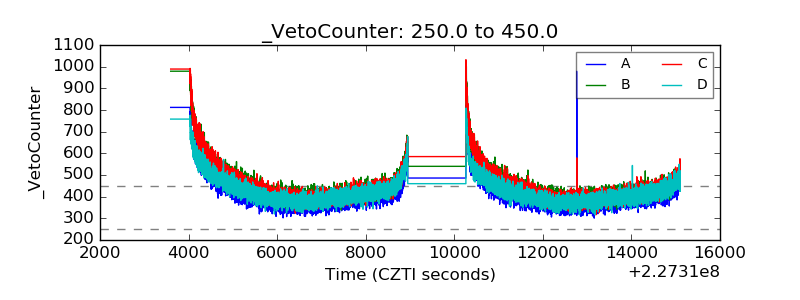 |