| Param | Original file | Final file |
|---|---|---|
| Filename | modeM0/AS1A02_027T01_9000001084_07919cztM0_level2.evt | modeM0/AS1A02_027T01_9000001084_07919cztM0_level2_quad_clean.evt |
| Size (bytes) | 597,047,040 | 96,791,040 |
| Size | 569.4 MB | 92.3 MB |
| Events in quadrant A | 4,406,753 | 582,147 |
| Events in quadrant B | 4,002,380 | 611,960 |
| Events in quadrant C | 5,227,660 | 608,550 |
| Events in quadrant D | 3,913,065 | 582,981 |
| Mode SS | |||
|---|---|---|---|
| Quadrant | BADHDUFLAG | Total packets | Discarded packets |
| A | 0 | 158 | 0 |
| B | 0 | 158 | 0 |
| C | 0 | 158 | 0 |
| D | 0 | 158 | 0 |
| Mode M0 | |||
|---|---|---|---|
| Quadrant | BADHDUFLAG | Total packets | Discarded packets |
| A | 0 | 18347 | 3 |
| B | 0 | 17218 | 2 |
| C | 0 | 20964 | 2 |
| D | 0 | 17246 | 2 |
| Mode M9 | |||
|---|---|---|---|
| Quadrant | BADHDUFLAG | Total packets | Discarded packets |
| A | 0 | 23 | 0 |
| B | 0 | 23 | 0 |
| C | 0 | 23 | 0 |
| D | 0 | 23 | 0 |
| Quadrant | Total seconds | Saturated seconds | Saturation percentage |
|---|---|---|---|
| A | 7855 | 204 | 2.597072% |
| B | 7855 | 132 | 1.680458% |
| C | 7855 | 151 | 1.922342% |
| D | 7855 | 43 | 0.547422% |
Noise dominated data is calculated using 1-second bins in cleaned event files. If a bin has >2000 counts, and if more than 50% of those come from <1% of pixels, then it is considered to be noise-dominated and hence unusable.
| Quadrant | # 1 sec bins | Bins with >0 counts | Bins with >2000 counts | High rate bins dominated by noise | Noise dominated (total time) | Noise dominated (detector-on time) | Marked lightcurve |
|---|---|---|---|---|---|---|---|
| A | 10090 | 7857 | 112 | 112 | 1.11% | 1.43% | 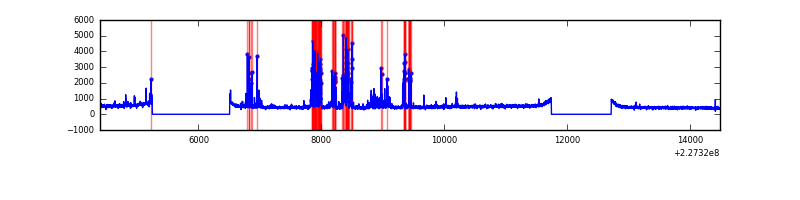 |
| B | 10090 | 7857 | 31 | 31 | 0.31% | 0.39% | 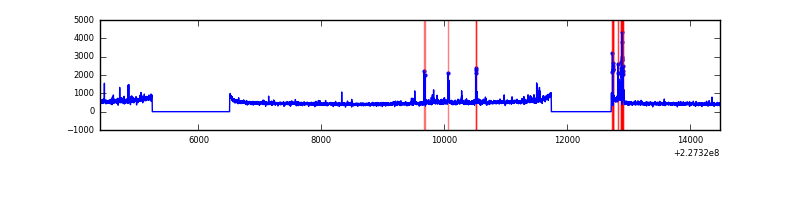 |
| C | 10090 | 7857 | 19 | 19 | 0.19% | 0.24% | 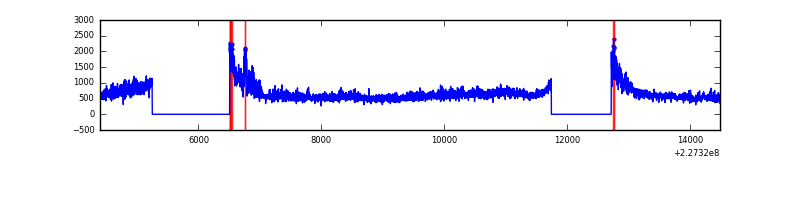 |
| D | 10090 | 7857 | 14 | 14 | 0.14% | 0.18% | 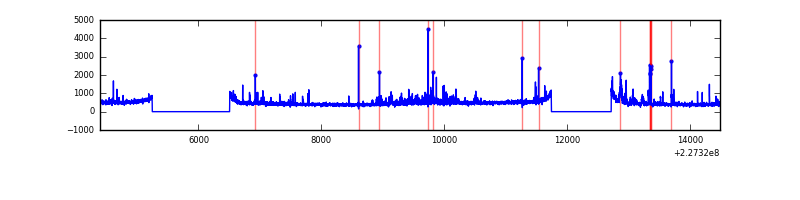 |
Top three noisy pixels from each quadrant. If the there are fewer than three noisy pixels in the level2.evt file, extra rows are filled as -1
| Pixel properties | Quadrant properties | ||||||
|---|---|---|---|---|---|---|---|
| Quadrant | DetID | PixID | Counts | Sigma | Mean | Median | Sigma |
| A | 15 | 239 | 755486 | 3922.23 | 942 | 921 | 192.4 |
| A | 8 | 15 | 10383 | 49.18 | 942 | 921 | 192.4 |
| A | 0 | 226 | 8872 | 41.33 | 942 | 921 | 192.4 |
| B | 10 | 16 | 108424 | 588.72 | 960 | 938 | 182.6 |
| B | 4 | 239 | 74651 | 403.74 | 960 | 938 | 182.6 |
| B | 0 | 214 | 35005 | 186.59 | 960 | 938 | 182.6 |
| C | 1 | 16 | 1618611 | 7592.4 | 925 | 929 | 213.1 |
| C | 13 | 61 | 6931 | 28.17 | 925 | 929 | 213.1 |
| C | 8 | 222 | 3005 | 9.74 | 925 | 929 | 213.1 |
| D | 1 | 52 | 180646 | 789.32 | 922 | 893 | 227.7 |
| D | 5 | 233 | 174323 | 761.56 | 922 | 893 | 227.7 |
| D | 7 | 71 | 38407 | 164.73 | 922 | 893 | 227.7 |
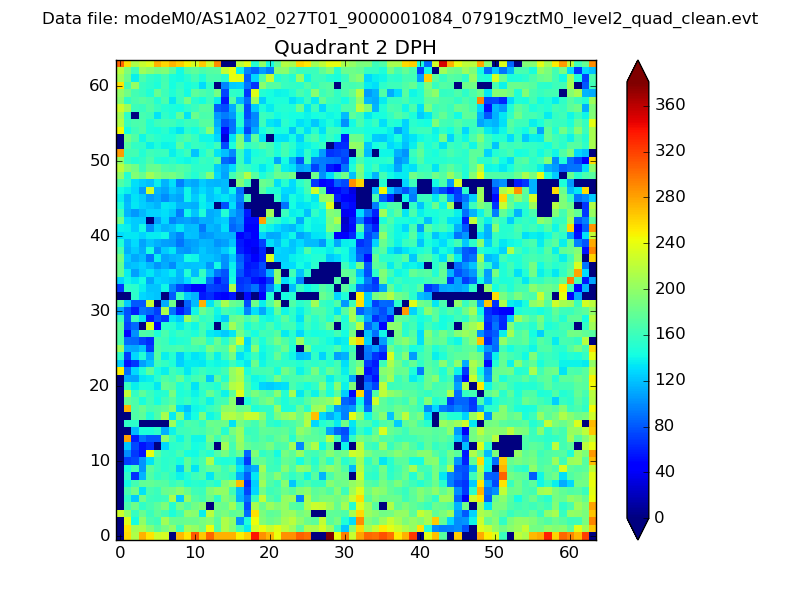
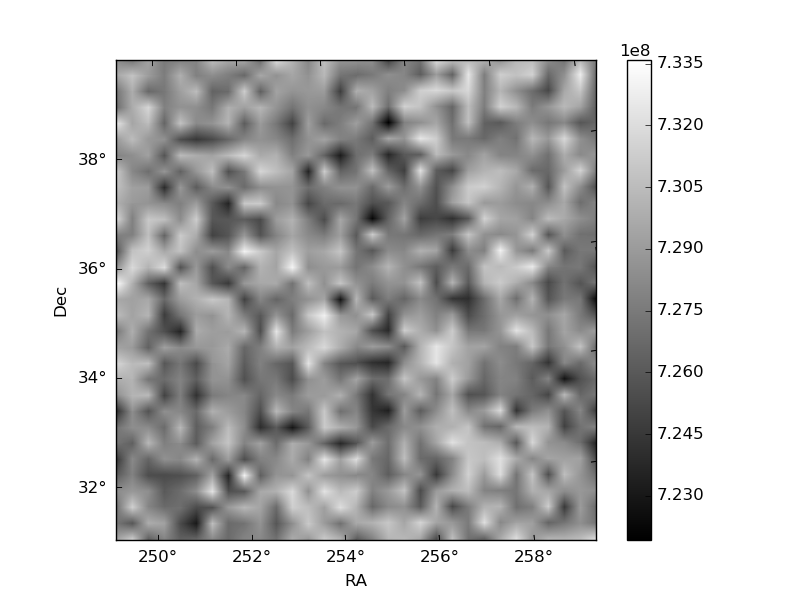
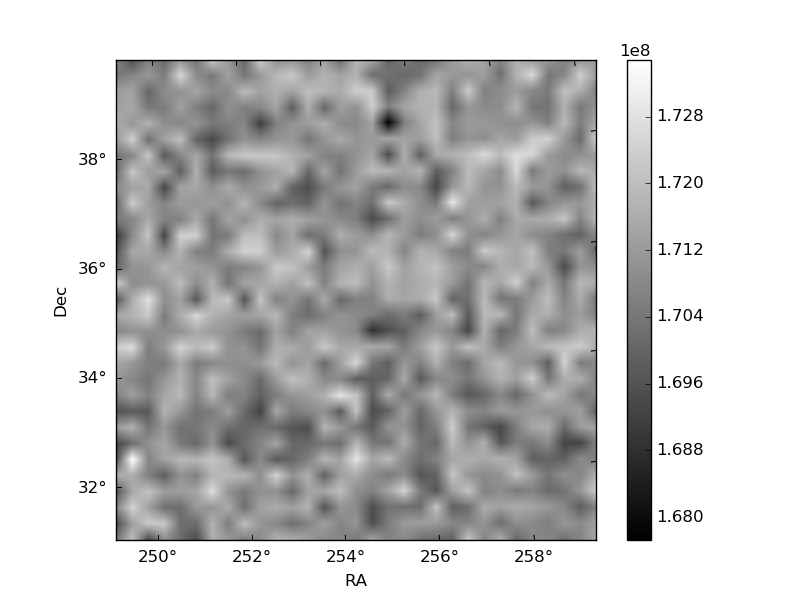
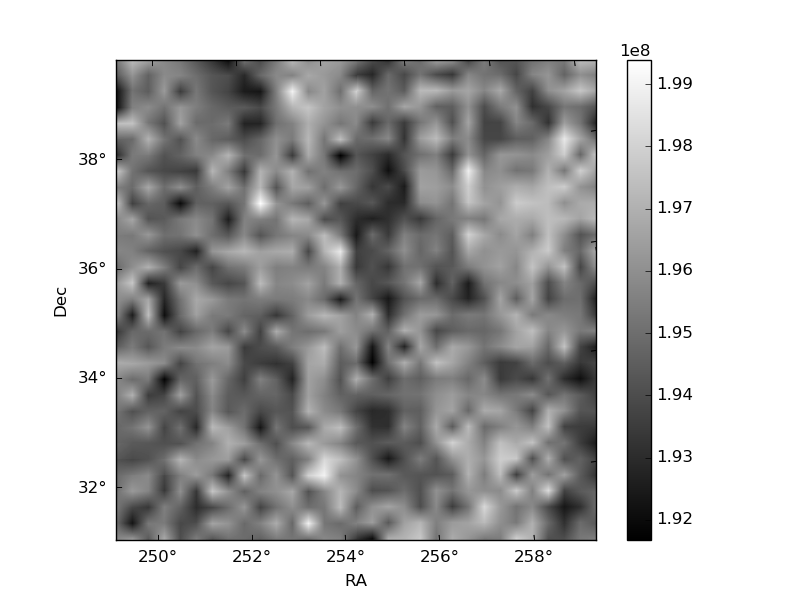
Histogram calculated using DETX and DETY for each event in the final _common_clean file
| Quadrant A | 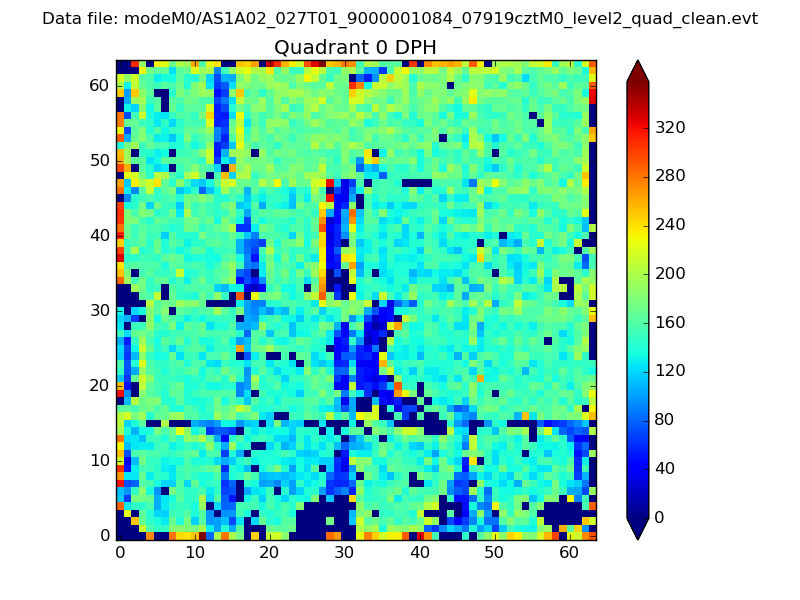 |
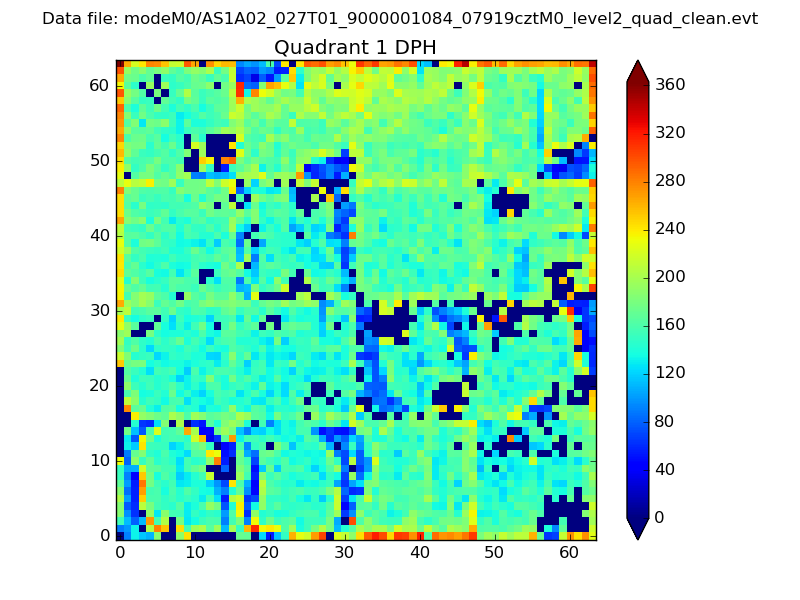 |
Quadrant B |
|---|---|---|---|
| Quadrant D | 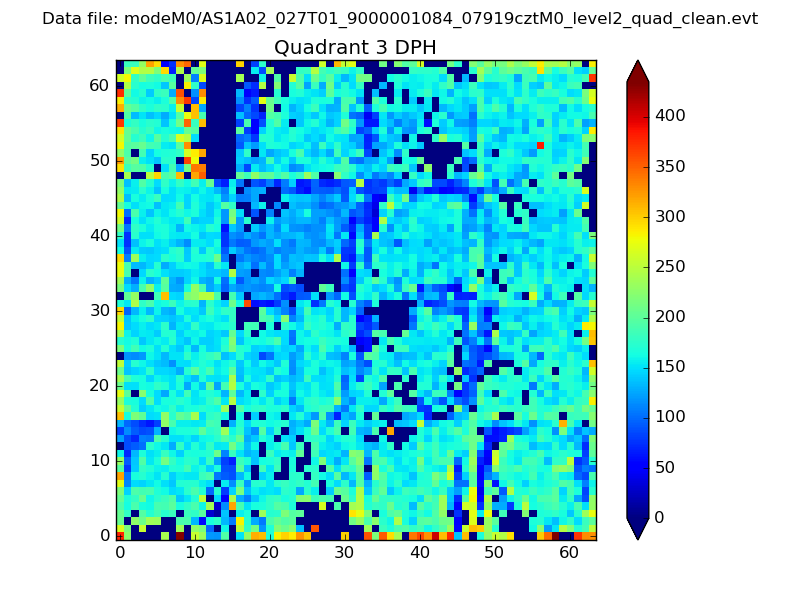 |
 |
Quadrant C |
| Plot type | Count rate plots | Images |
|---|---|---|
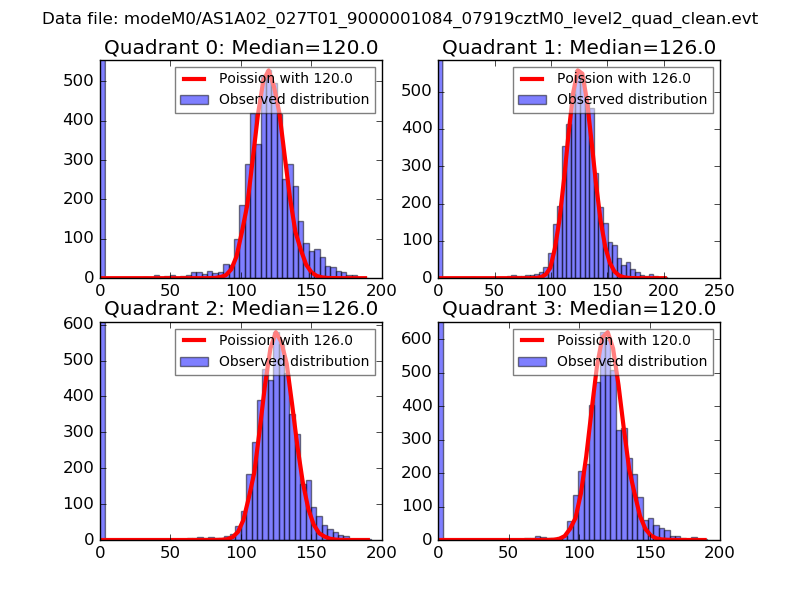
| Comparison with Poisson distribution Blue bars denote a histogram of data divided into 1 sec bins. Red curve is a Poisson curve with rate = median count rate of data. |
 |
 |
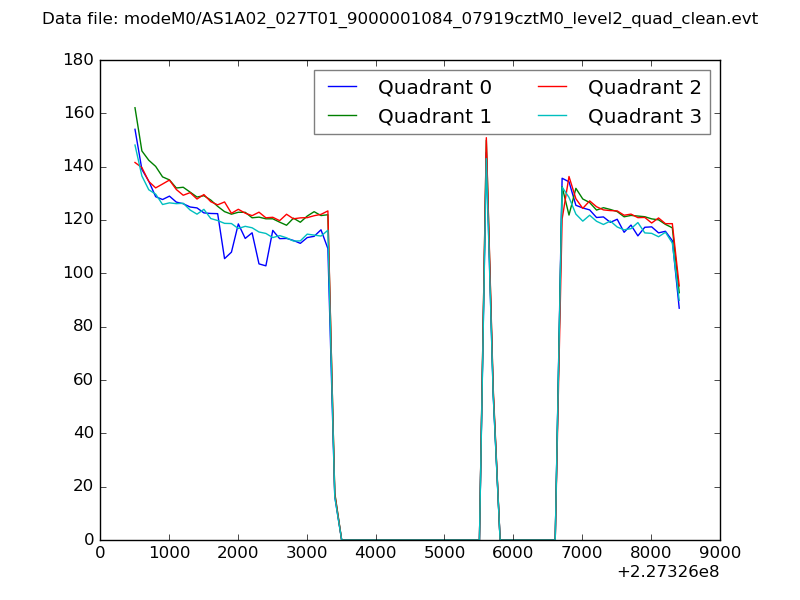
| Quadrant-wise count rates Data is divided into 100 sec bins |
 |
|
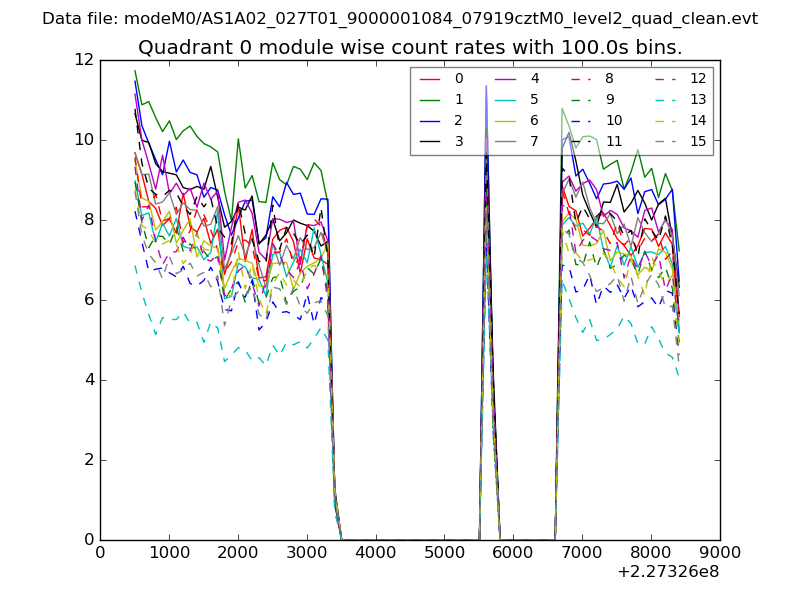
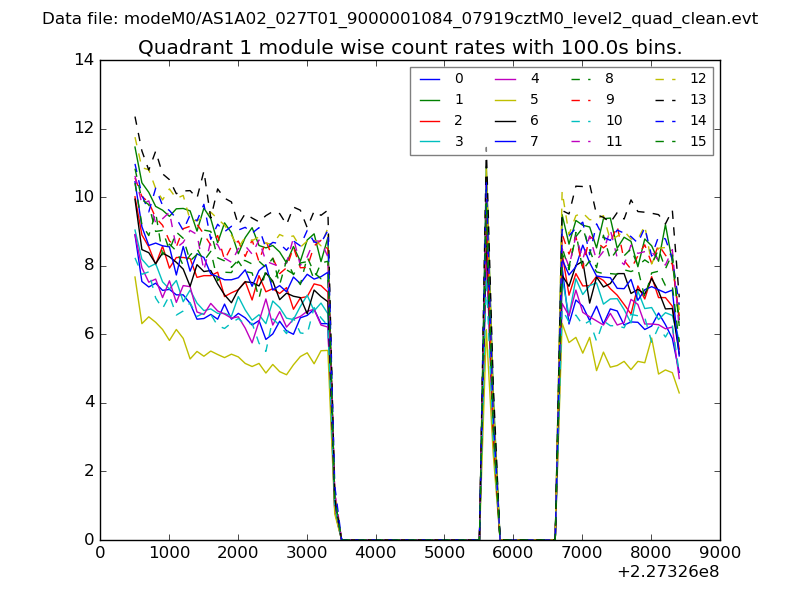
| Module-wise count rates for Quadrant A Data is divided into 100 sec bins |
 |
 |
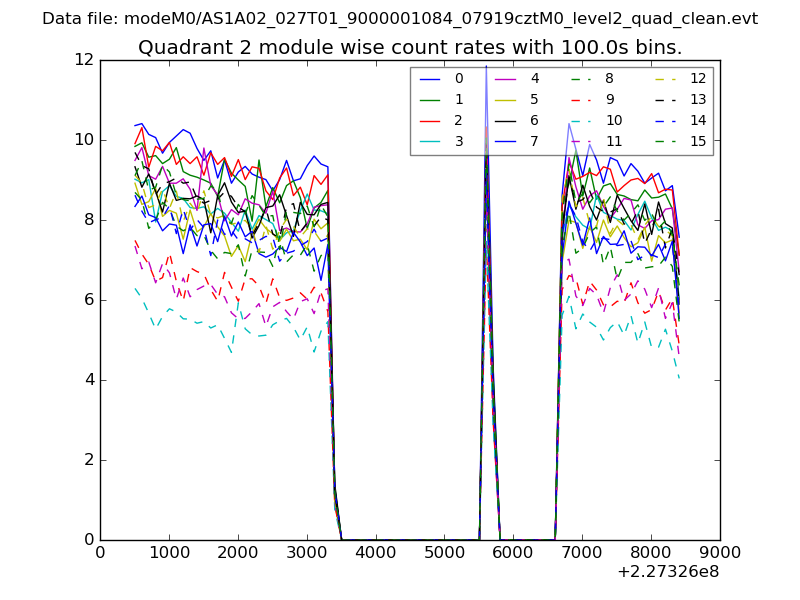
| Module-wise count rates for Quadrant B Data is divided into 100 sec bins |
 |
 |
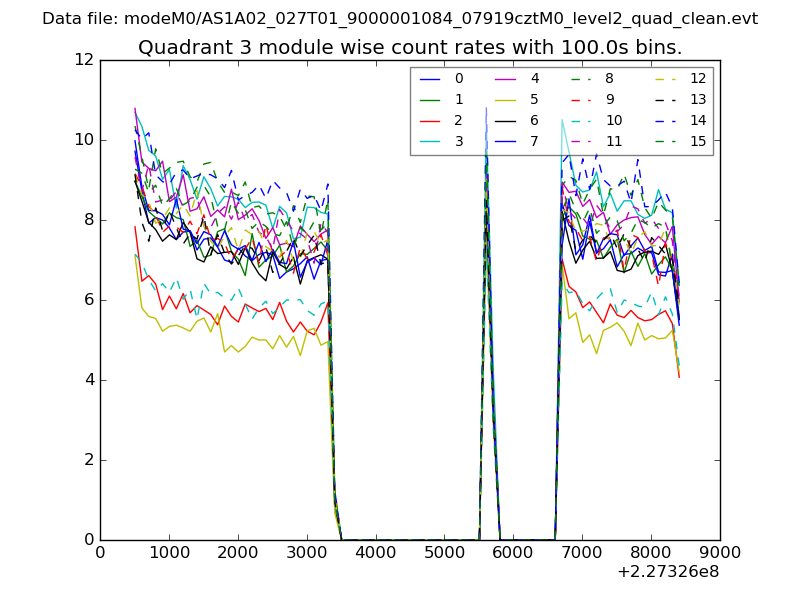
| Module-wise count rates for Quadrant C Data is divided into 100 sec bins |
 |
 |
| Module-wise count rates for Quadrant D Data is divided into 100 sec bins |
 |
 |
| Parameter | Plot |
|---|---|
| CZT HV Monitor | 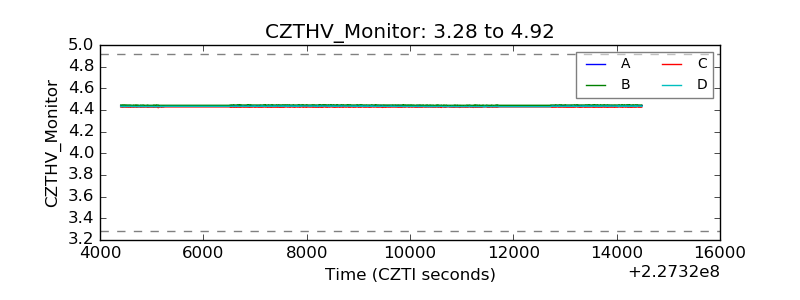 |
| D_VDD | 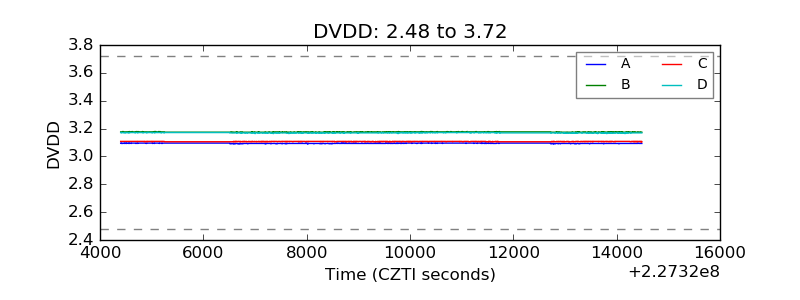 |
| Temperature 1 | 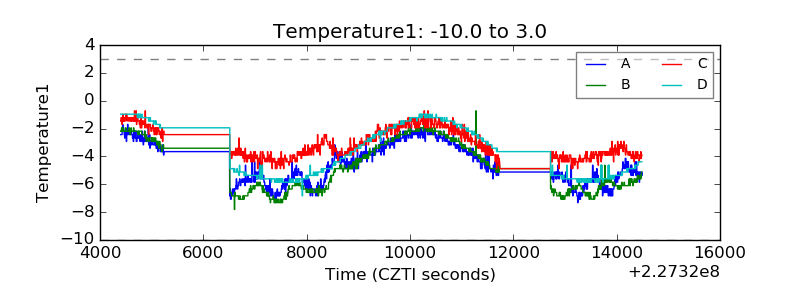 |
| Veto HV Monitor | 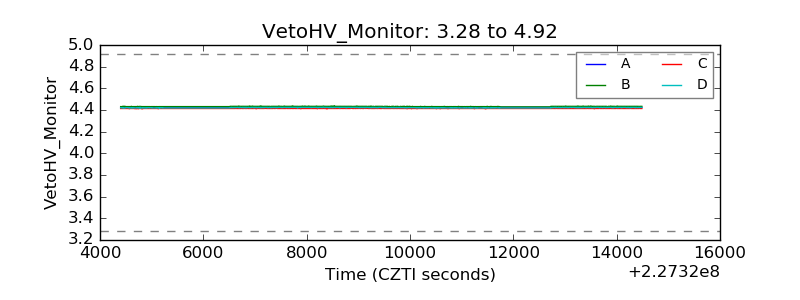 |
| Veto LLD |  |
| Alpha Counter | 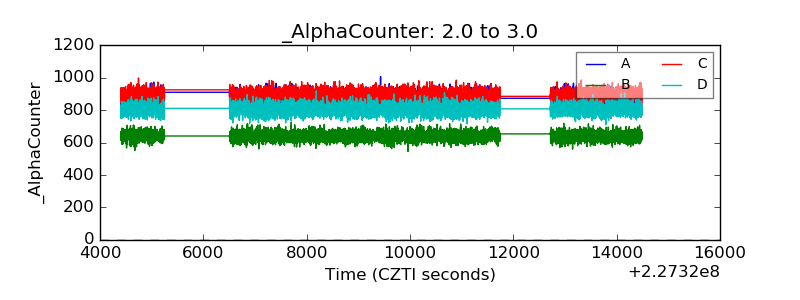 |
| _CPM_Rate | 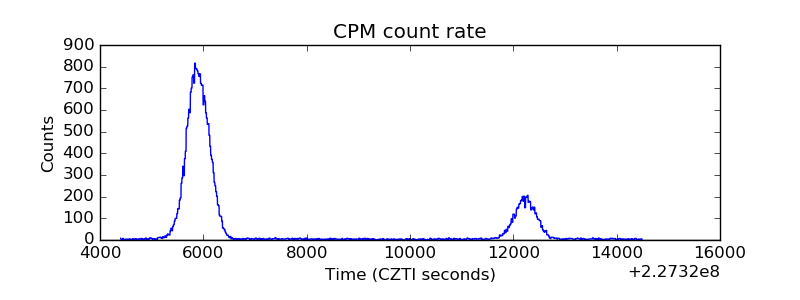 |
| CZT Counter | 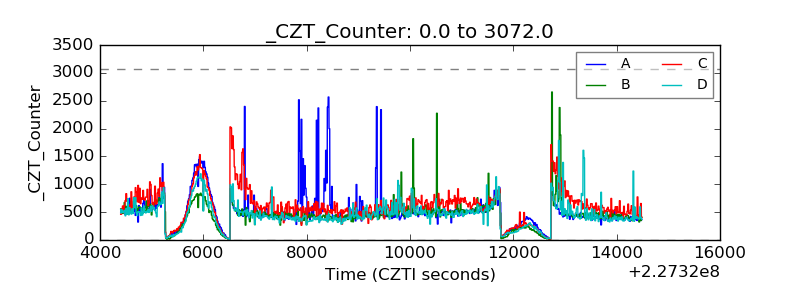 |
| +2.5 Volts monitor |  |
| +5 Volts monitor | 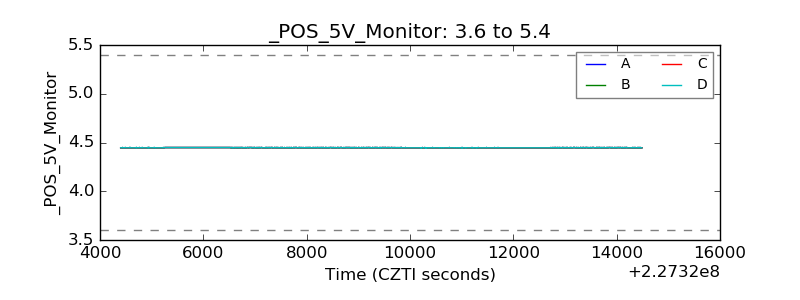 |
| _ROLL_ROT | 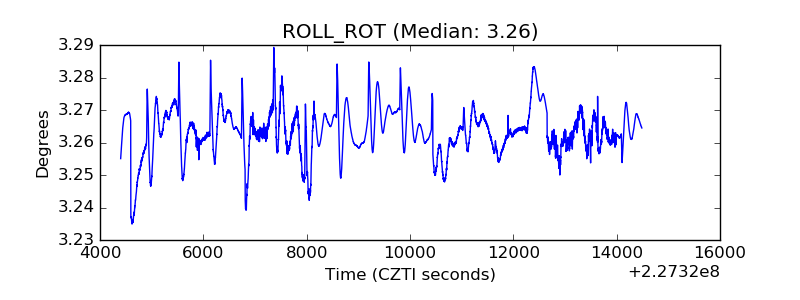 |
| _Roll_DEC | 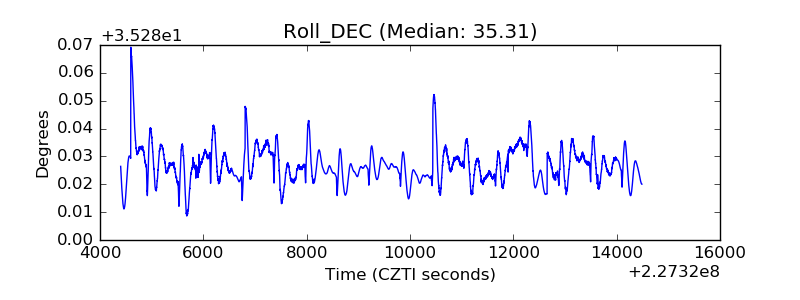 |
| _Roll_RA | 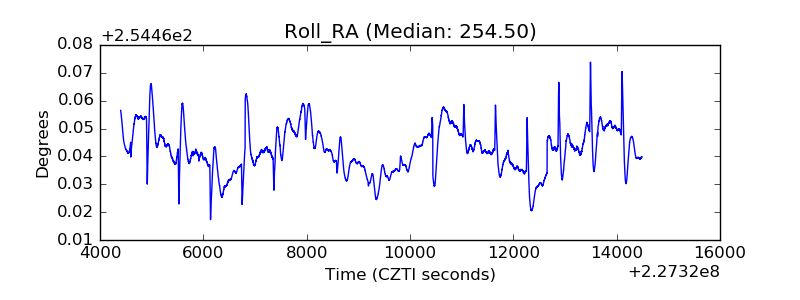 |
| Veto Counter | 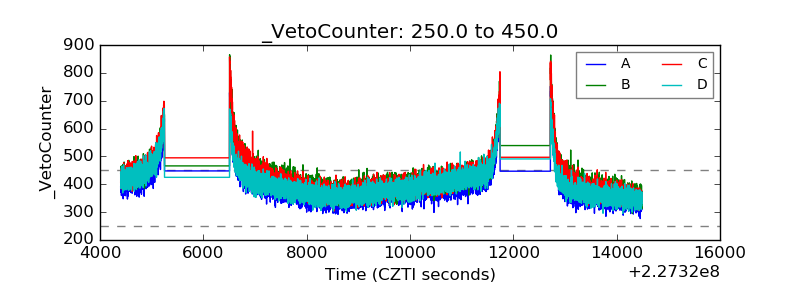 |