| Param | Original file | Final file |
|---|---|---|
| Filename | modeM0/AS1A02_027T01_9000001084_07925cztM0_level2.evt | modeM0/AS1A02_027T01_9000001084_07925cztM0_level2_quad_clean.evt |
| Size (bytes) | 1,745,740,800 | 298,483,200 |
| Size | 1.6 GB | 284.7 MB |
| Events in quadrant A | 11,806,511 | 1,792,167 |
| Events in quadrant B | 13,380,790 | 1,842,492 |
| Events in quadrant C | 13,009,469 | 1,867,502 |
| Events in quadrant D | 12,937,445 | 1,771,361 |
| Mode SS | |||
|---|---|---|---|
| Quadrant | BADHDUFLAG | Total packets | Discarded packets |
| A | 0 | 520 | 2 |
| B | 0 | 520 | 2 |
| C | 0 | 519 | 0 |
| D | 0 | 520 | 2 |
| Mode M0 | |||
|---|---|---|---|
| Quadrant | BADHDUFLAG | Total packets | Discarded packets |
| A | 0 | 53037 | 150 |
| B | 0 | 56677 | 155 |
| C | 0 | 56321 | 207 |
| D | 0 | 56506 | 179 |
| Mode M9 | |||
|---|---|---|---|
| Quadrant | BADHDUFLAG | Total packets | Discarded packets |
| A | 0 | 10 | 0 |
| B | 0 | 10 | 0 |
| C | 0 | 10 | 0 |
| D | 0 | 10 | 0 |
| Quadrant | Total seconds | Saturated seconds | Saturation percentage |
|---|---|---|---|
| A | 25680 | 697 | 2.714174% |
| B | 25679 | 883 | 3.438607% |
| C | 25676 | 480 | 1.869450% |
| D | 25680 | 669 | 2.605140% |
Noise dominated data is calculated using 1-second bins in cleaned event files. If a bin has >2000 counts, and if more than 50% of those come from <1% of pixels, then it is considered to be noise-dominated and hence unusable.
| Quadrant | # 1 sec bins | Bins with >0 counts | Bins with >2000 counts | High rate bins dominated by noise | Noise dominated (total time) | Noise dominated (detector-on time) | Marked lightcurve |
|---|---|---|---|---|---|---|---|
| A | 26697 | 25715 | 2 | 2 | 0.01% | 0.01% | 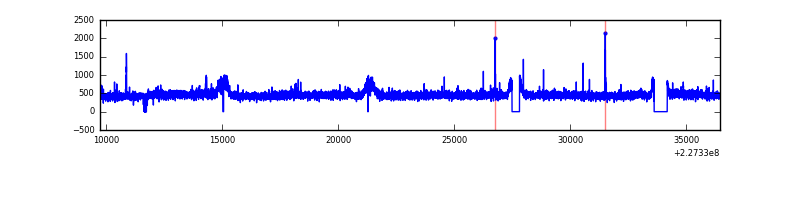 |
| B | 26697 | 25717 | 156 | 156 | 0.58% | 0.61% | 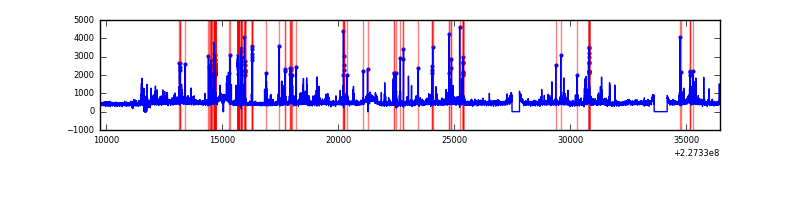 |
| C | 26697 | 25713 | 0 | 0 | 0.00% | 0.00% | 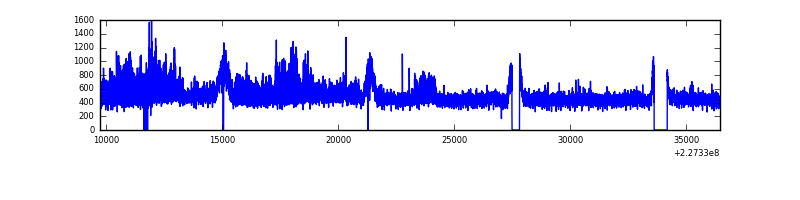 |
| D | 26697 | 25711 | 56 | 56 | 0.21% | 0.22% | 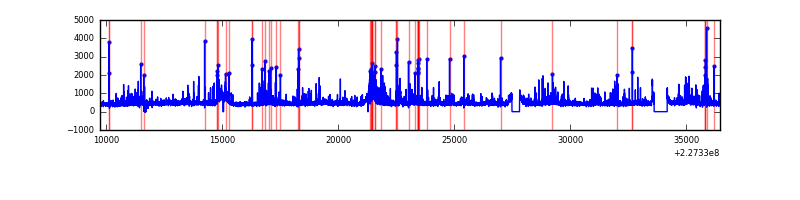 |
Top three noisy pixels from each quadrant. If the there are fewer than three noisy pixels in the level2.evt file, extra rows are filled as -1
| Pixel properties | Quadrant properties | ||||||
|---|---|---|---|---|---|---|---|
| Quadrant | DetID | PixID | Counts | Sigma | Mean | Median | Sigma |
| A | 15 | 234 | 102931 | 161.38 | 3022 | 2945 | 619.6 |
| A | 8 | 15 | 34765 | 51.36 | 3022 | 2945 | 619.6 |
| A | 0 | 226 | 28365 | 41.03 | 3022 | 2945 | 619.6 |
| B | 10 | 16 | 502840 | 860.13 | 3040 | 2964 | 581.2 |
| B | 4 | 239 | 458176 | 783.28 | 3040 | 2964 | 581.2 |
| B | 11 | 51 | 306888 | 522.96 | 3040 | 2964 | 581.2 |
| C | 1 | 16 | 1435526 | 2088.27 | 2959 | 2966 | 686.0 |
| C | 13 | 61 | 22974 | 29.17 | 2959 | 2966 | 686.0 |
| C | 8 | 128 | 16655 | 19.95 | 2959 | 2966 | 686.0 |
| D | 5 | 233 | 679704 | 934.01 | 2947 | 2844 | 724.7 |
| D | 1 | 52 | 636059 | 873.79 | 2947 | 2844 | 724.7 |
| D | 13 | 104 | 141828 | 191.79 | 2947 | 2844 | 724.7 |
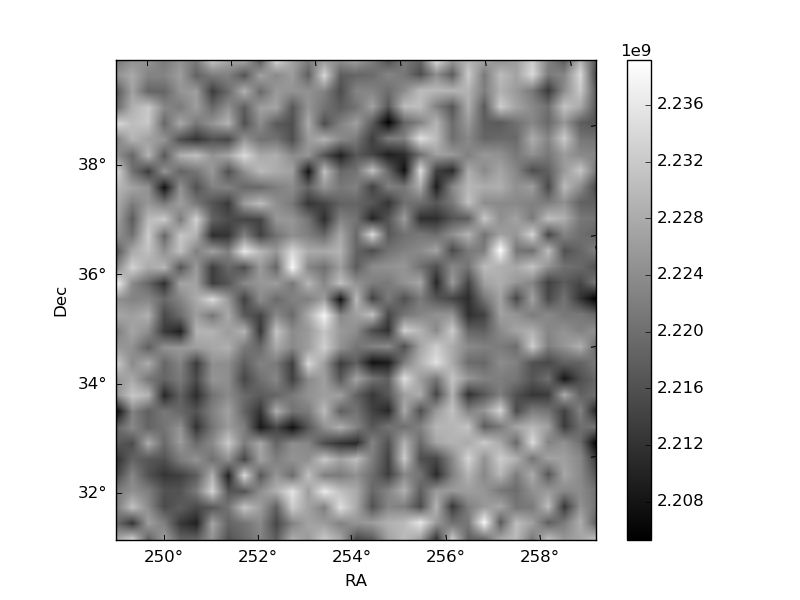
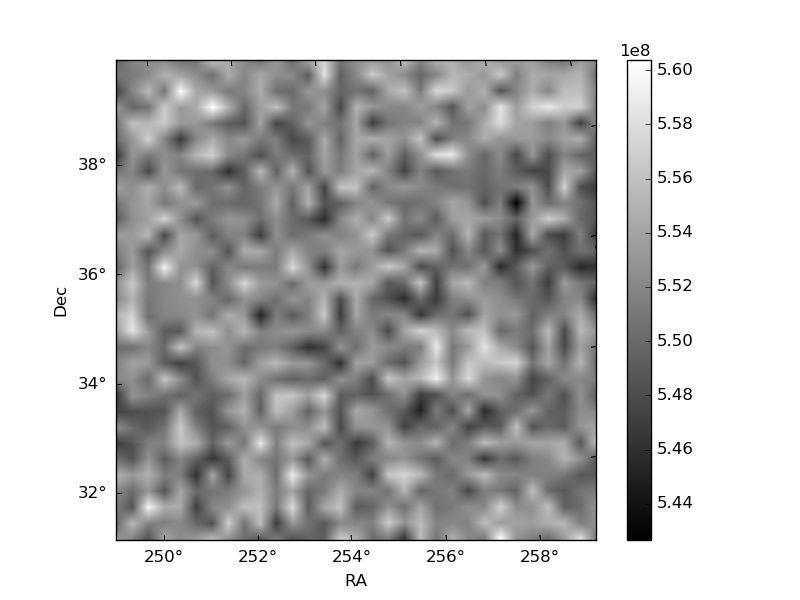
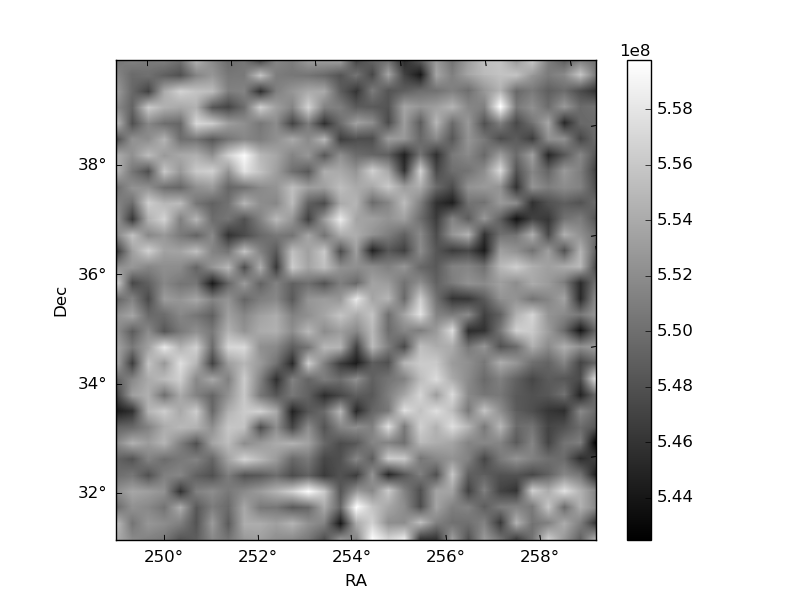
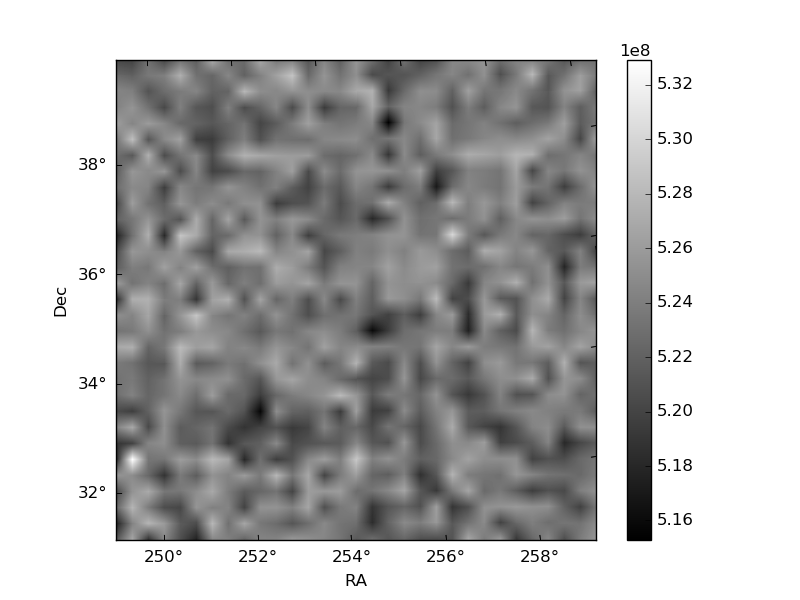
Histogram calculated using DETX and DETY for each event in the final _common_clean file
| Quadrant A | 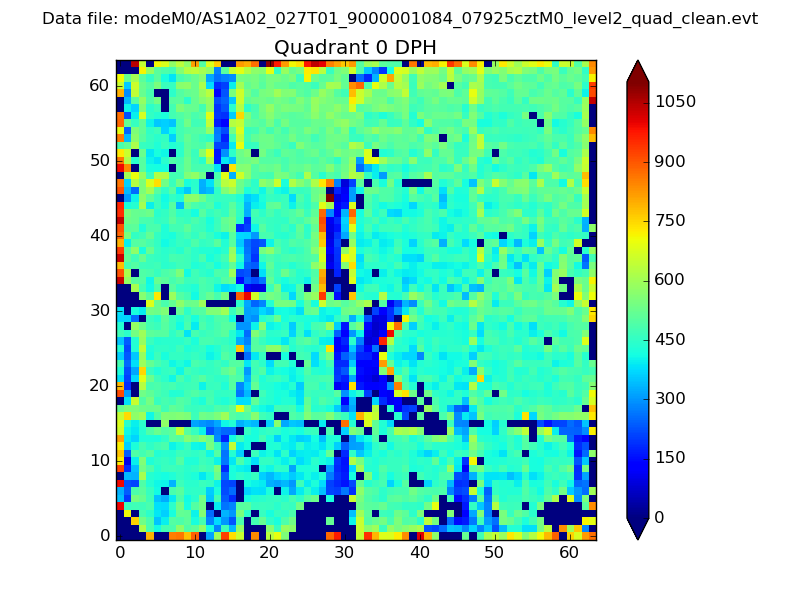 |
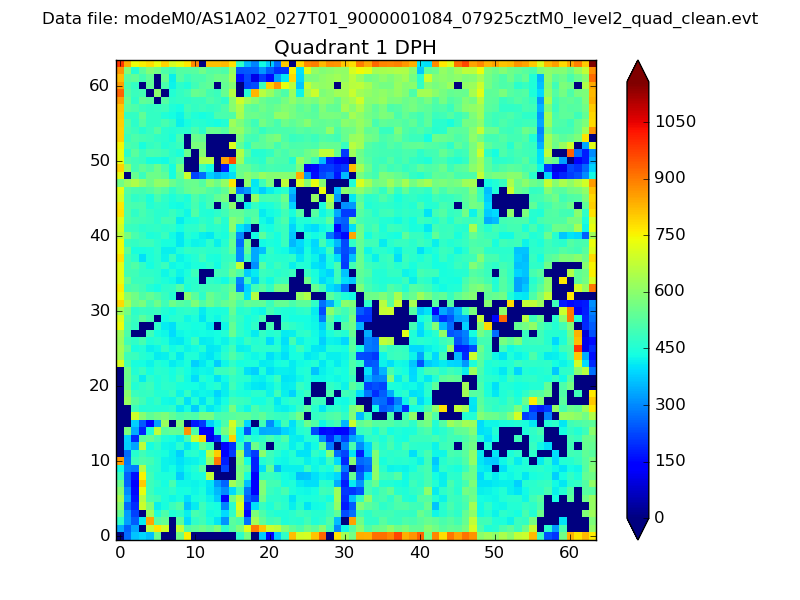 |
Quadrant B |
|---|---|---|---|
| Quadrant D |  |
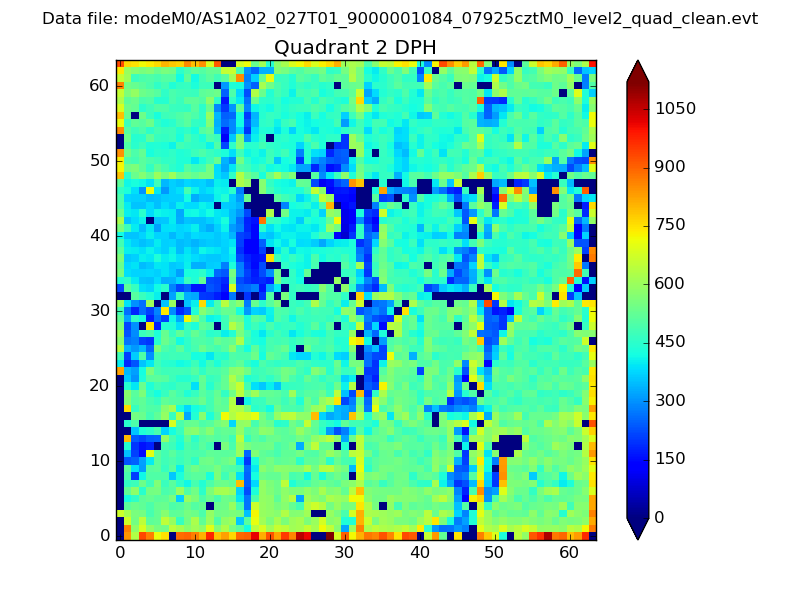 |
Quadrant C |
| Plot type | Count rate plots | Images |
|---|---|---|
| Comparison with Poisson distribution Blue bars denote a histogram of data divided into 1 sec bins. Red curve is a Poisson curve with rate = median count rate of data. |
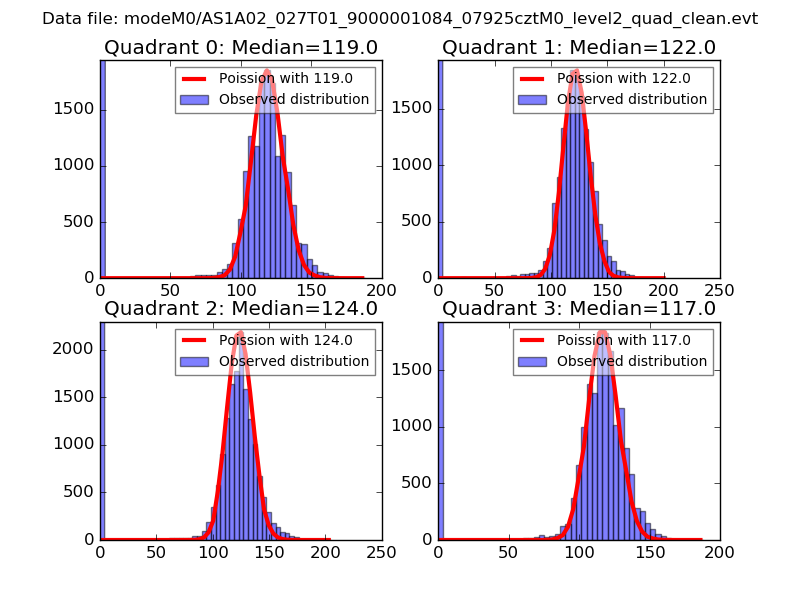 |
 |
| Quadrant-wise count rates Data is divided into 100 sec bins |
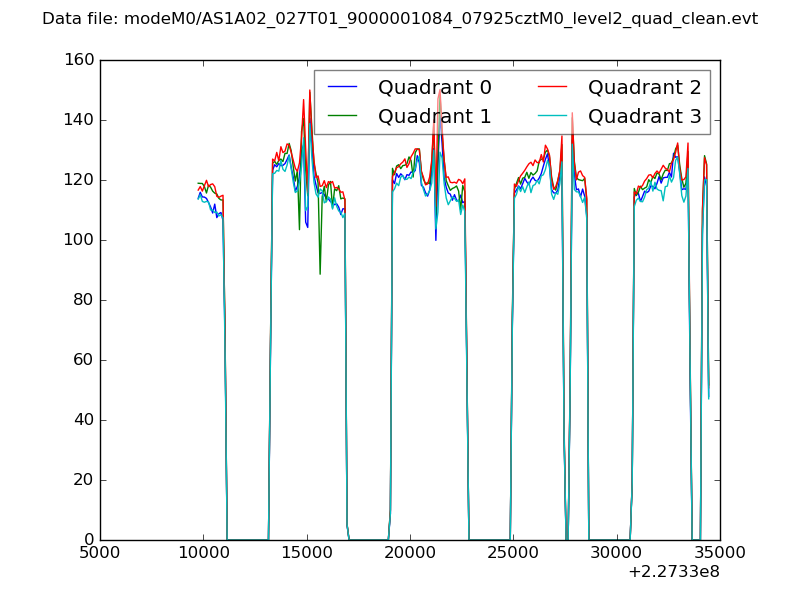 |
|
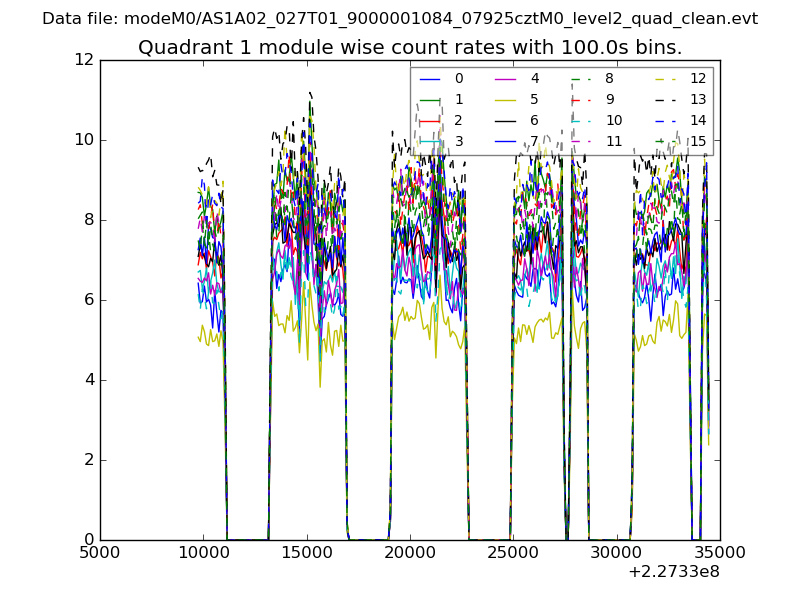
| Module-wise count rates for Quadrant A Data is divided into 100 sec bins |
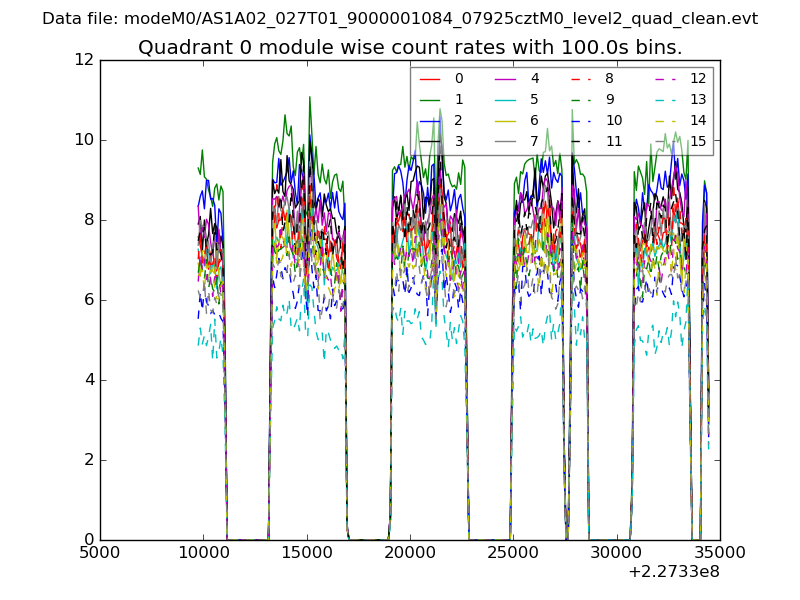 |
 |
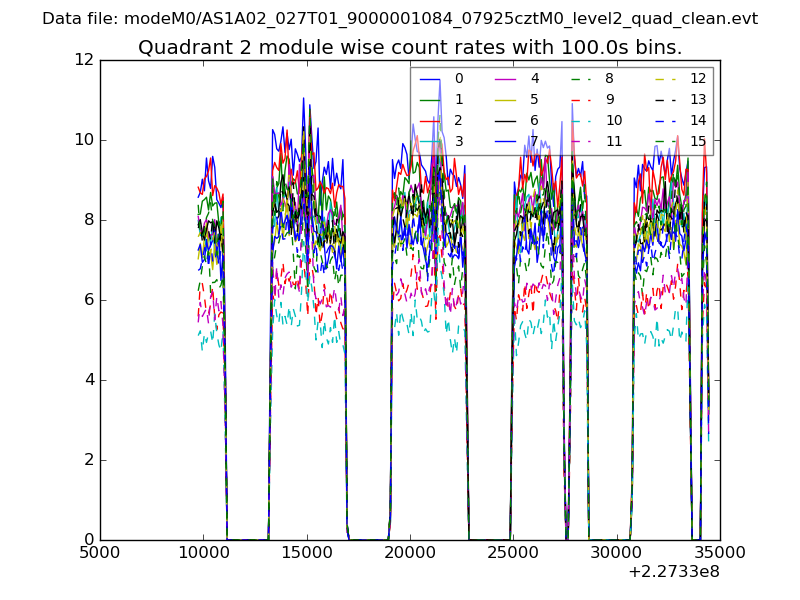
| Module-wise count rates for Quadrant B Data is divided into 100 sec bins |
 |
 |
| Module-wise count rates for Quadrant C Data is divided into 100 sec bins |
 |
 |
| Module-wise count rates for Quadrant D Data is divided into 100 sec bins |
 |
 |
| Parameter | Plot |
|---|---|
| CZT HV Monitor | 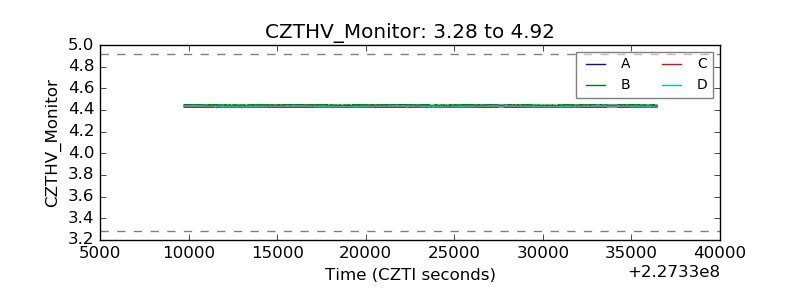 |
| D_VDD | 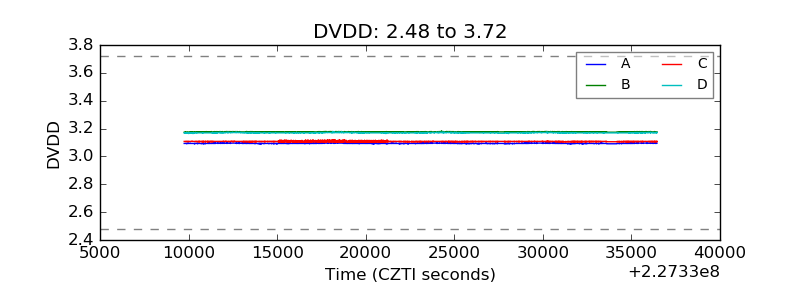 |
| Temperature 1 | 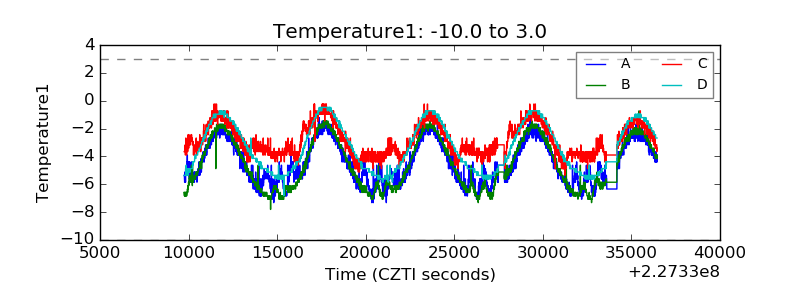 |
| Veto HV Monitor | 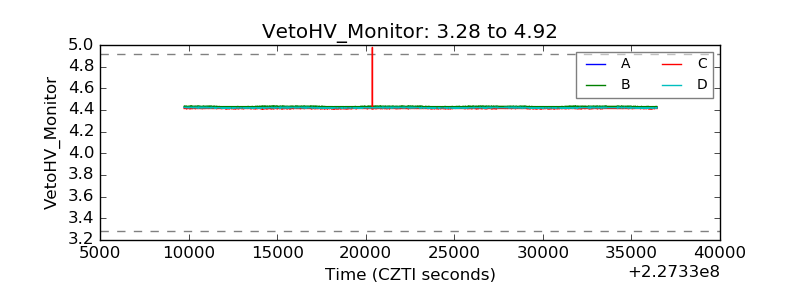 |
| Veto LLD | 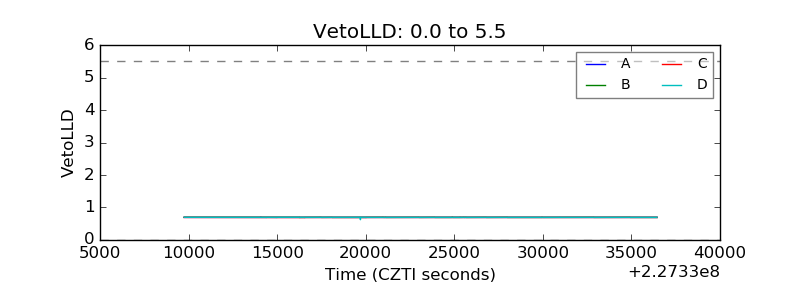 |
| Alpha Counter | 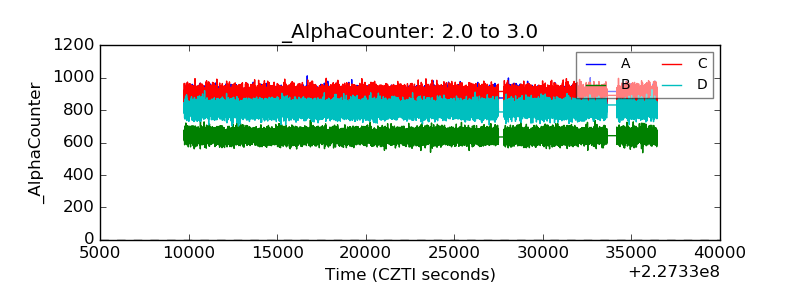 |
| _CPM_Rate | 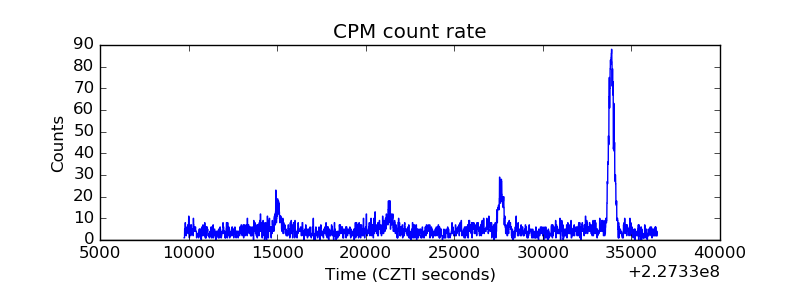 |
| CZT Counter | 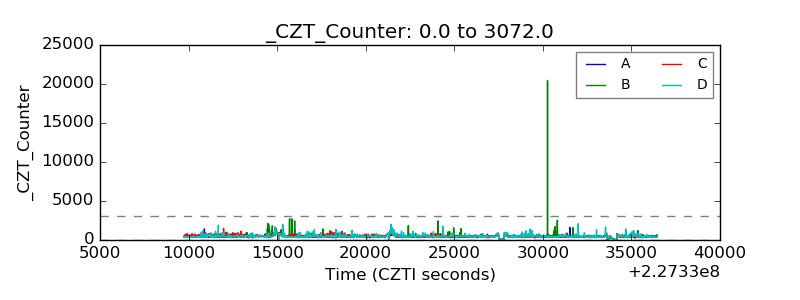 |
| +2.5 Volts monitor | 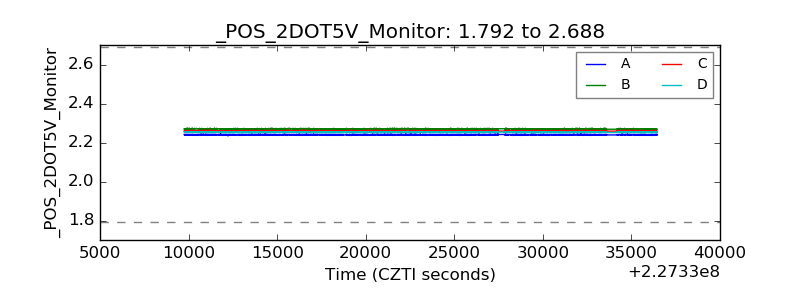 |
| +5 Volts monitor |  |
| _ROLL_ROT | 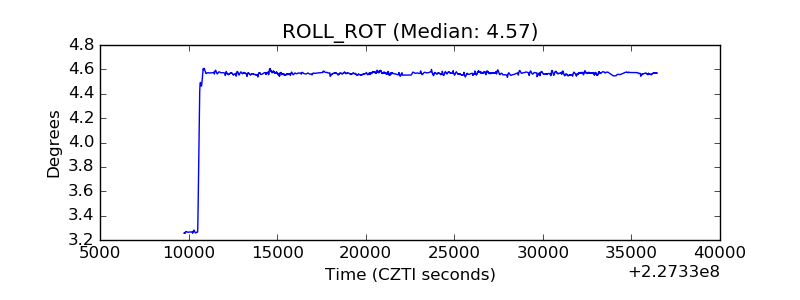 |
| _Roll_DEC | 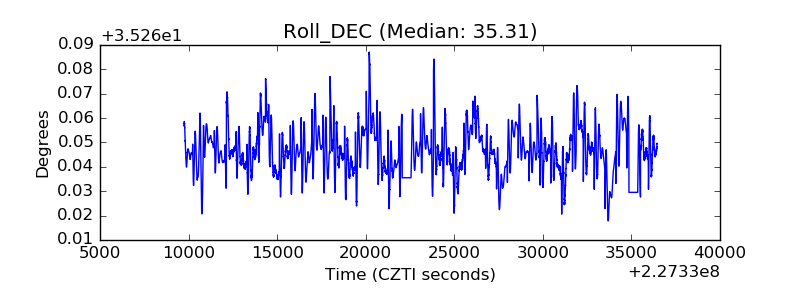 |
| _Roll_RA | 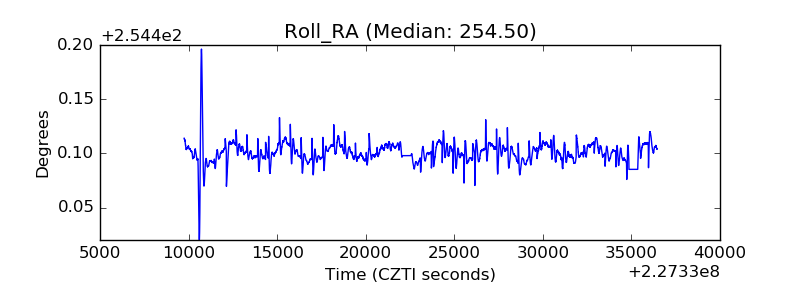 |
| Veto Counter | 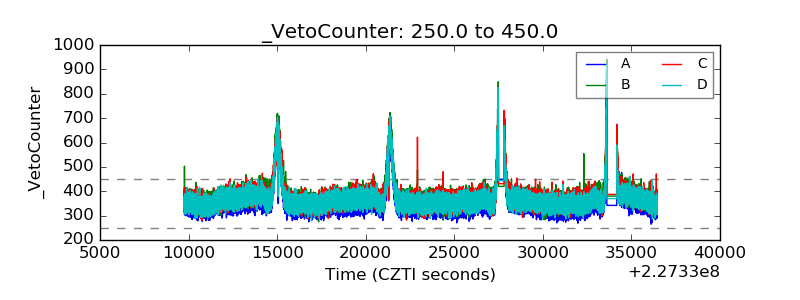 |