| Param | Original file | Final file |
|---|---|---|
| Filename | modeM0/AS1A02_027T01_9000001084_07926cztM0_level2.evt | modeM0/AS1A02_027T01_9000001084_07926cztM0_level2_quad_clean.evt |
| Size (bytes) | 690,739,200 | 124,891,200 |
| Size | 658.7 MB | 119.1 MB |
| Events in quadrant A | 4,845,936 | 755,262 |
| Events in quadrant B | 5,231,487 | 769,990 |
| Events in quadrant C | 4,797,812 | 778,100 |
| Events in quadrant D | 5,326,592 | 746,522 |
| Mode SS | |||
|---|---|---|---|
| Quadrant | BADHDUFLAG | Total packets | Discarded packets |
| A | 0 | 216 | 0 |
| B | 0 | 216 | 0 |
| C | 0 | 216 | 0 |
| D | 0 | 216 | 0 |
| Mode M0 | |||
|---|---|---|---|
| Quadrant | BADHDUFLAG | Total packets | Discarded packets |
| A | 0 | 21655 | 3 |
| B | 0 | 22437 | 2 |
| C | 0 | 21577 | 2 |
| D | 0 | 23330 | 2 |
| Mode M9 | |||
|---|---|---|---|
| Quadrant | BADHDUFLAG | Total packets | Discarded packets |
| A | 0 | 16 | 0 |
| B | 0 | 16 | 0 |
| C | 0 | 16 | 0 |
| D | 0 | 16 | 0 |
| Quadrant | Total seconds | Saturated seconds | Saturation percentage |
|---|---|---|---|
| A | 10575 | 125 | 1.182033% |
| B | 10575 | 154 | 1.456265% |
| C | 10575 | 118 | 1.115839% |
| D | 10575 | 158 | 1.494090% |
Noise dominated data is calculated using 1-second bins in cleaned event files. If a bin has >2000 counts, and if more than 50% of those come from <1% of pixels, then it is considered to be noise-dominated and hence unusable.
| Quadrant | # 1 sec bins | Bins with >0 counts | Bins with >2000 counts | High rate bins dominated by noise | Noise dominated (total time) | Noise dominated (detector-on time) | Marked lightcurve |
|---|---|---|---|---|---|---|---|
| A | 12250 | 10576 | 3 | 3 | 0.02% | 0.03% | 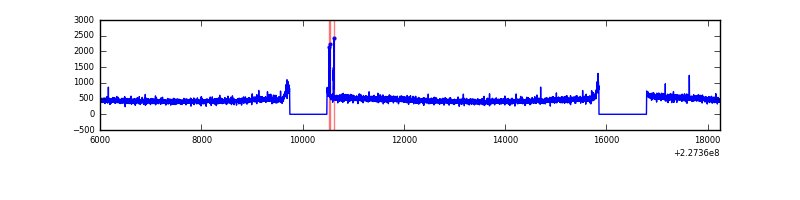 |
| B | 12250 | 10576 | 14 | 14 | 0.11% | 0.13% | 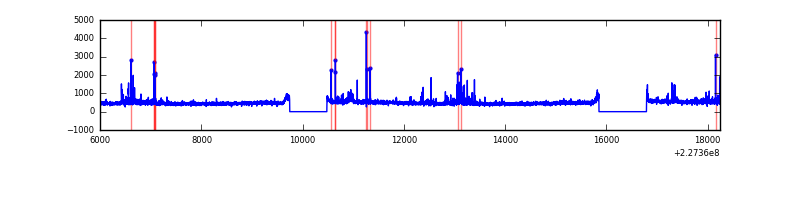 |
| C | 12250 | 10576 | 2 | 2 | 0.02% | 0.02% | 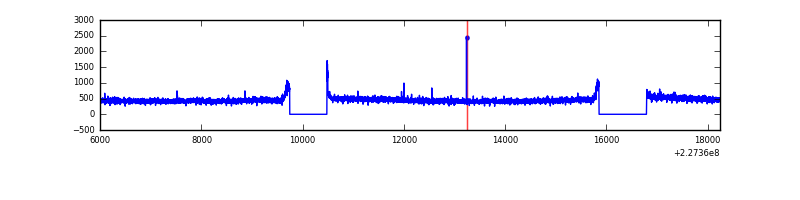 |
| D | 12250 | 10576 | 34 | 34 | 0.28% | 0.32% | 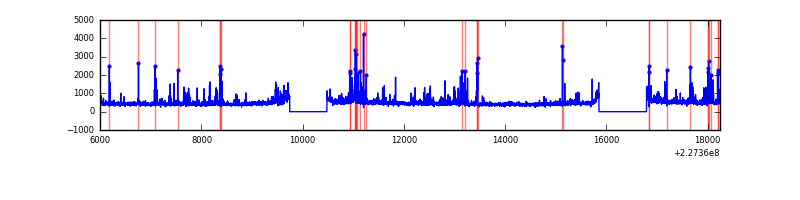 |
Top three noisy pixels from each quadrant. If the there are fewer than three noisy pixels in the level2.evt file, extra rows are filled as -1
| Pixel properties | Quadrant properties | ||||||
|---|---|---|---|---|---|---|---|
| Quadrant | DetID | PixID | Counts | Sigma | Mean | Median | Sigma |
| A | 8 | 15 | 38115 | 146.62 | 1241 | 1215 | 251.7 |
| A | 15 | 234 | 26809 | 101.69 | 1241 | 1215 | 251.7 |
| A | 0 | 226 | 11736 | 41.8 | 1241 | 1215 | 251.7 |
| B | 4 | 239 | 106790 | 440.99 | 1252 | 1222 | 239.4 |
| B | 11 | 51 | 80226 | 330.02 | 1252 | 1222 | 239.4 |
| B | 4 | 173 | 64606 | 264.77 | 1252 | 1222 | 239.4 |
| C | 1 | 16 | 27249 | 91.44 | 1221 | 1226 | 284.6 |
| C | 13 | 61 | 9399 | 28.72 | 1221 | 1226 | 284.6 |
| C | 12 | 4 | 8722 | 26.34 | 1221 | 1226 | 284.6 |
| D | 5 | 233 | 244265 | 821.66 | 1215 | 1176 | 295.8 |
| D | 1 | 52 | 176918 | 594.03 | 1215 | 1176 | 295.8 |
| D | 13 | 104 | 136591 | 457.72 | 1215 | 1176 | 295.8 |
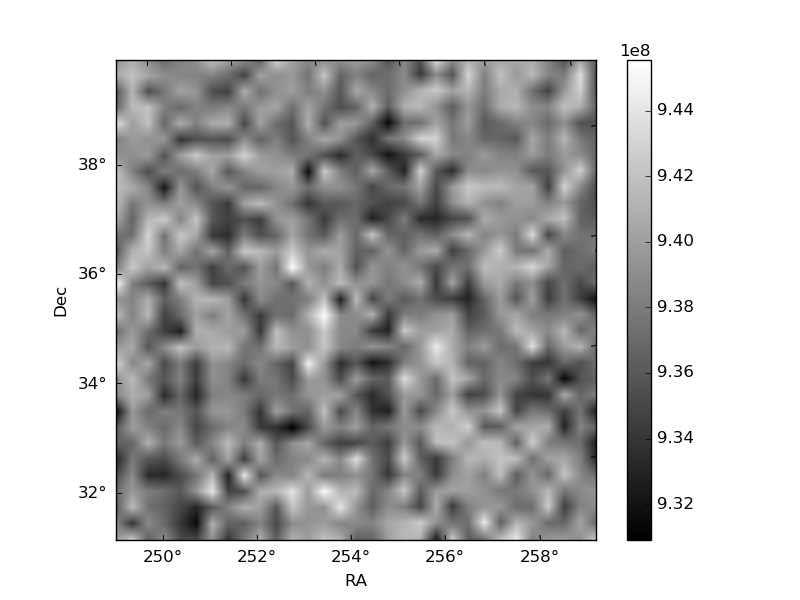
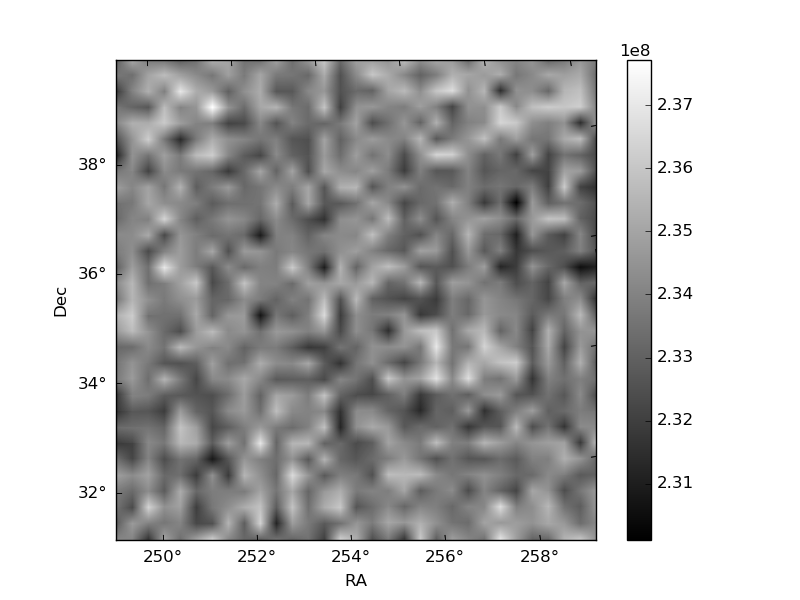
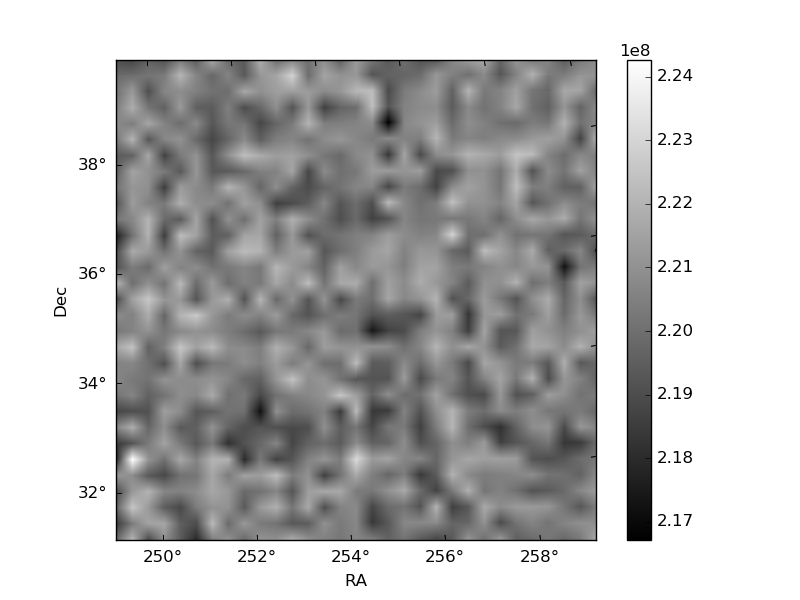
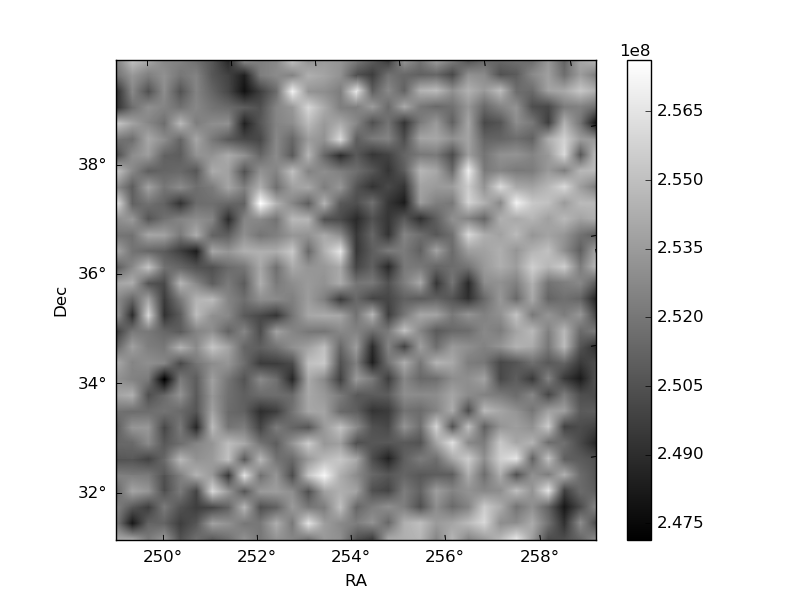
Histogram calculated using DETX and DETY for each event in the final _common_clean file
| Quadrant A | 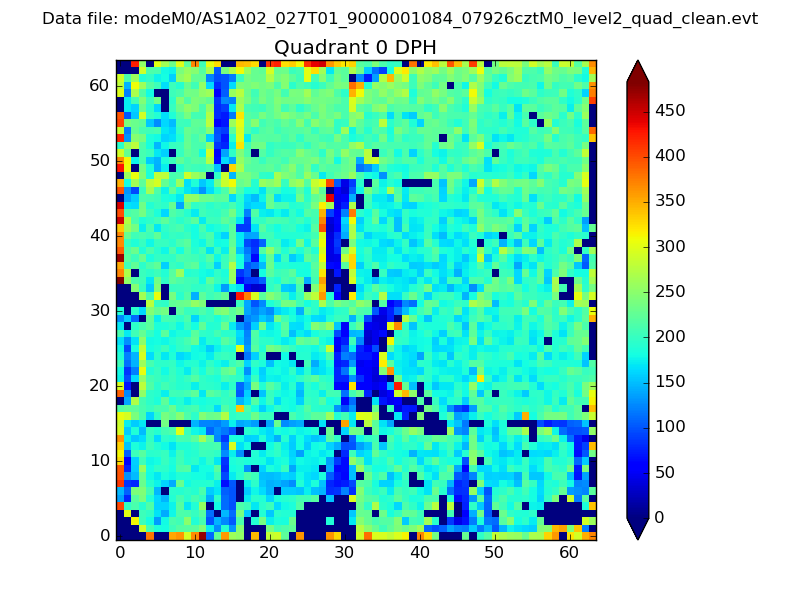 |
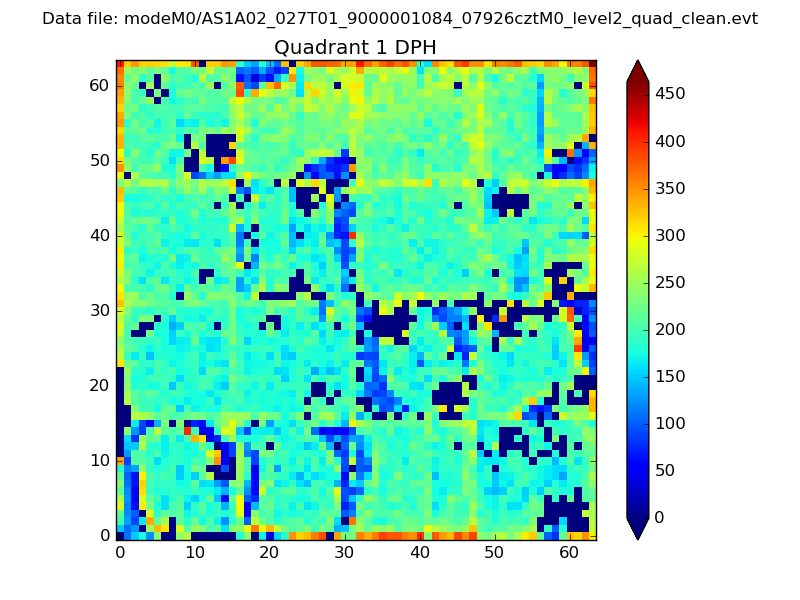 |
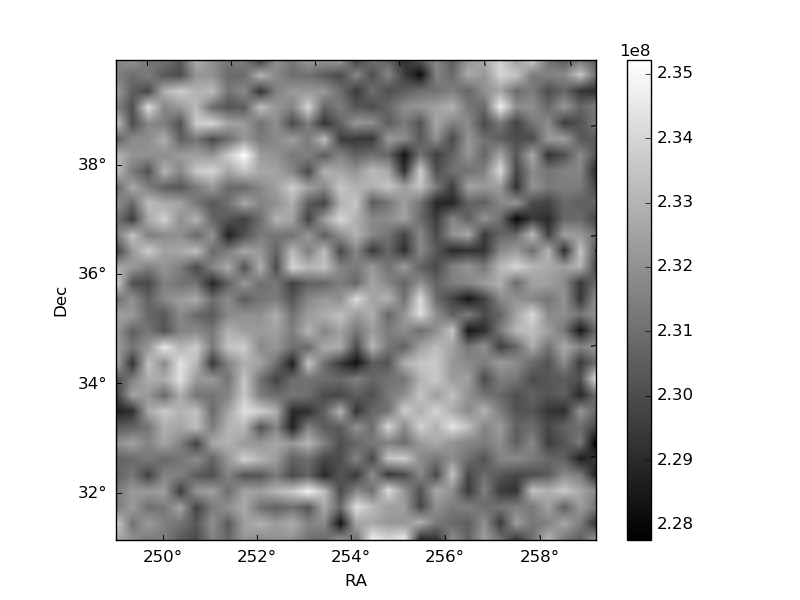
Quadrant B |
|---|---|---|---|
| Quadrant D | 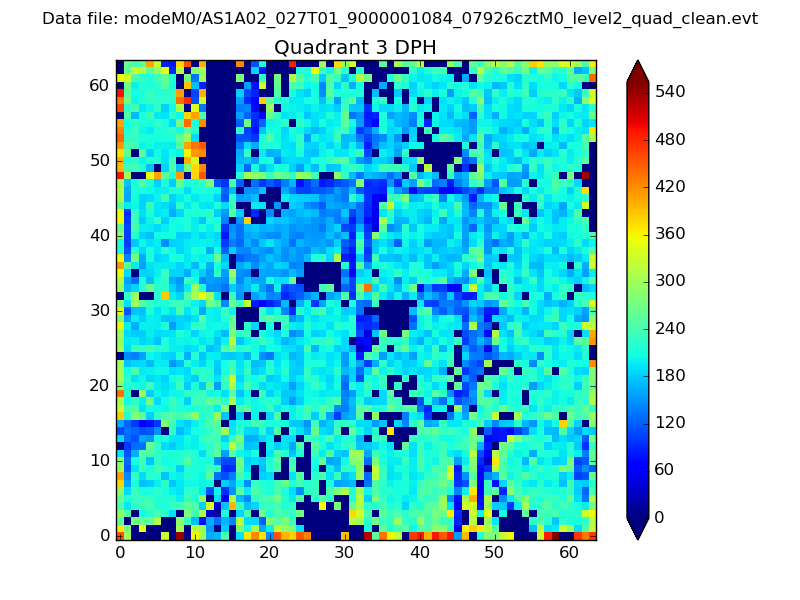 |
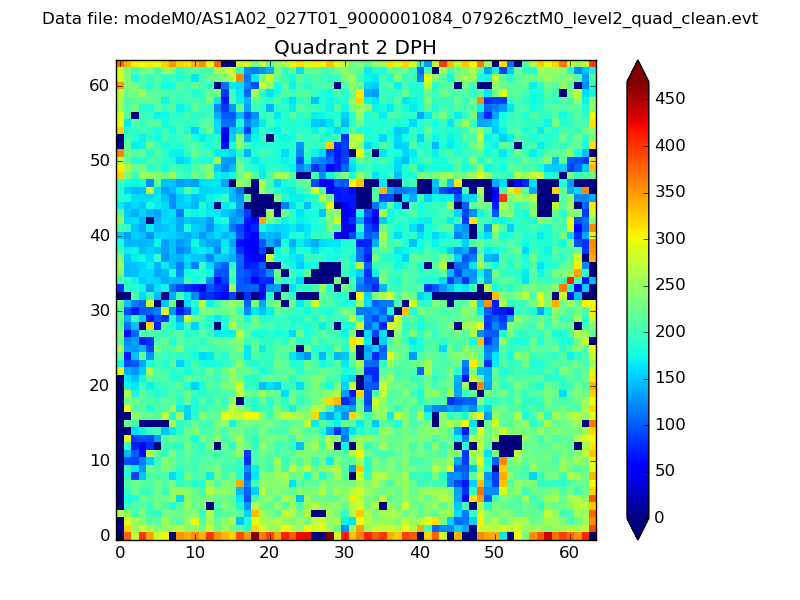 |
Quadrant C |
| Plot type | Count rate plots | Images |
|---|---|---|
| Comparison with Poisson distribution Blue bars denote a histogram of data divided into 1 sec bins. Red curve is a Poisson curve with rate = median count rate of data. |
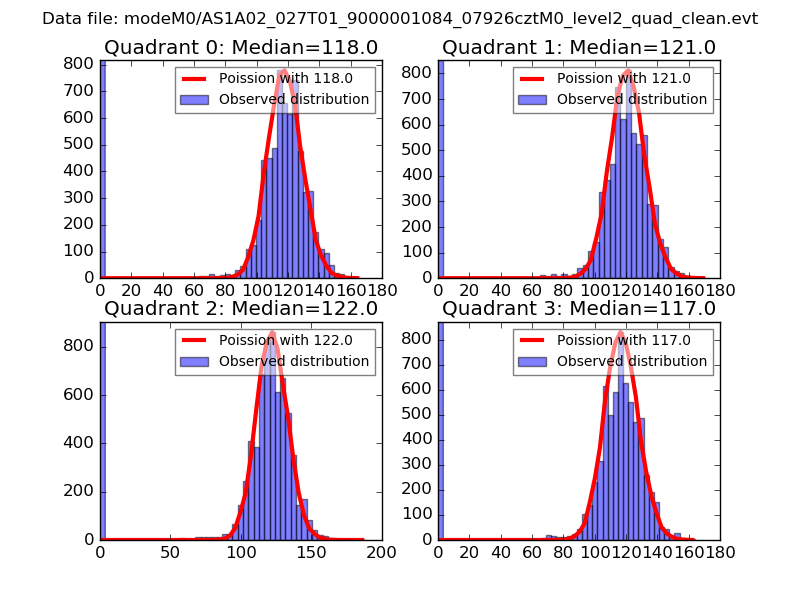 |
 |
| Quadrant-wise count rates Data is divided into 100 sec bins |
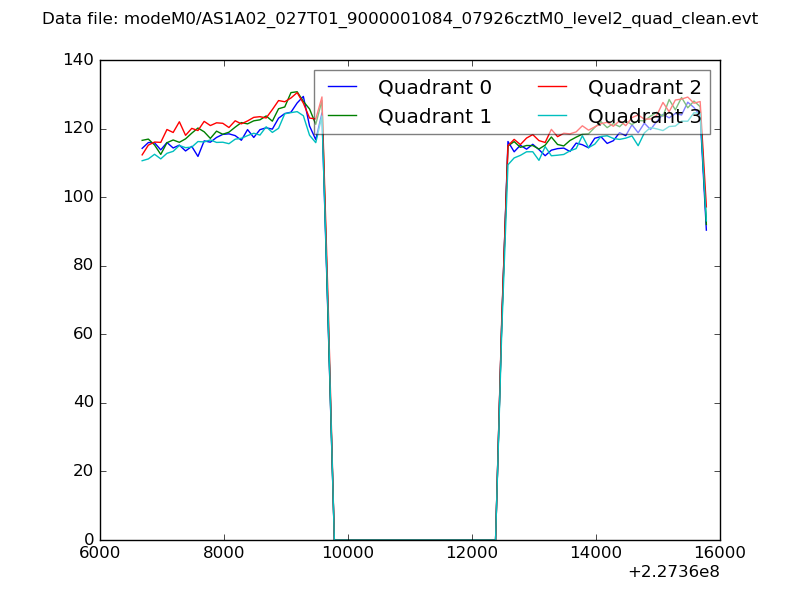 |
|
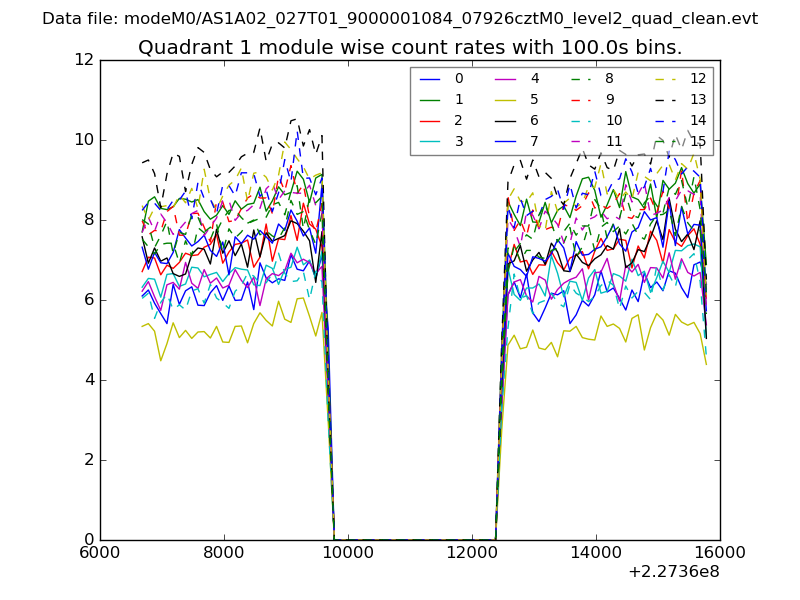
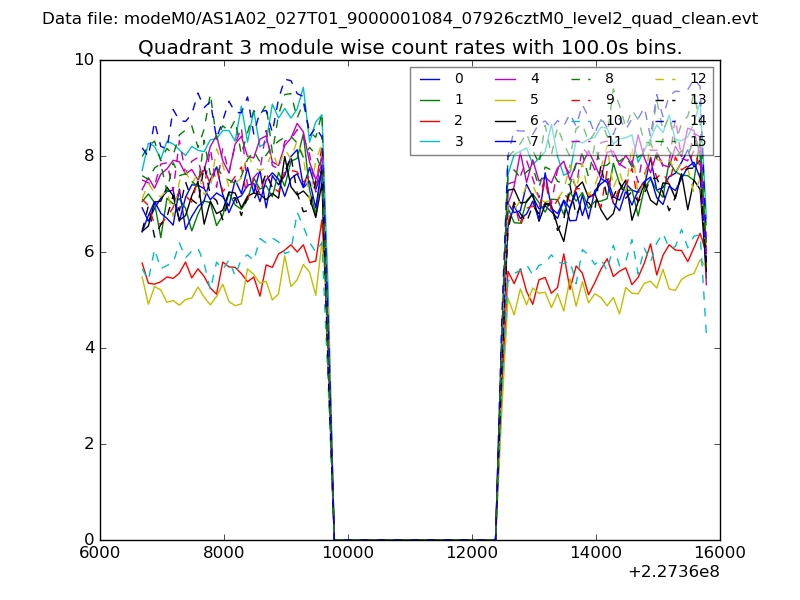
| Module-wise count rates for Quadrant A Data is divided into 100 sec bins |
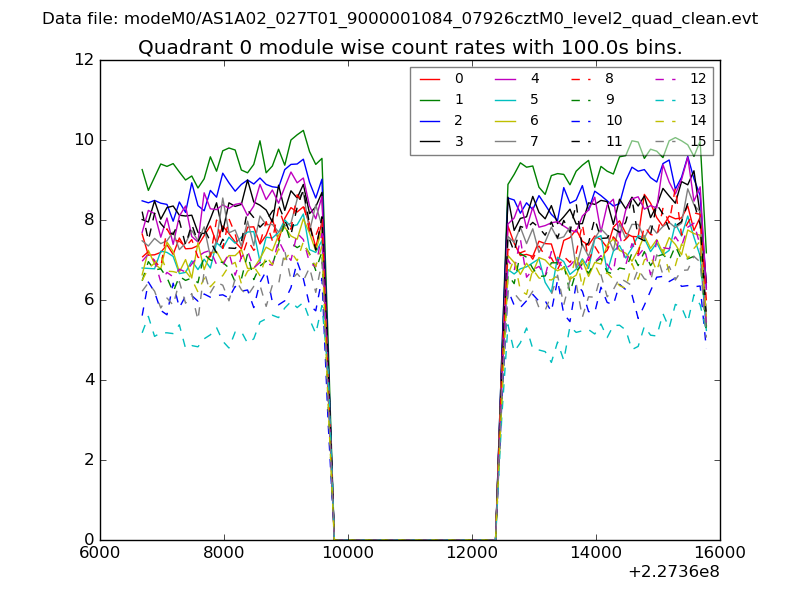 |
 |
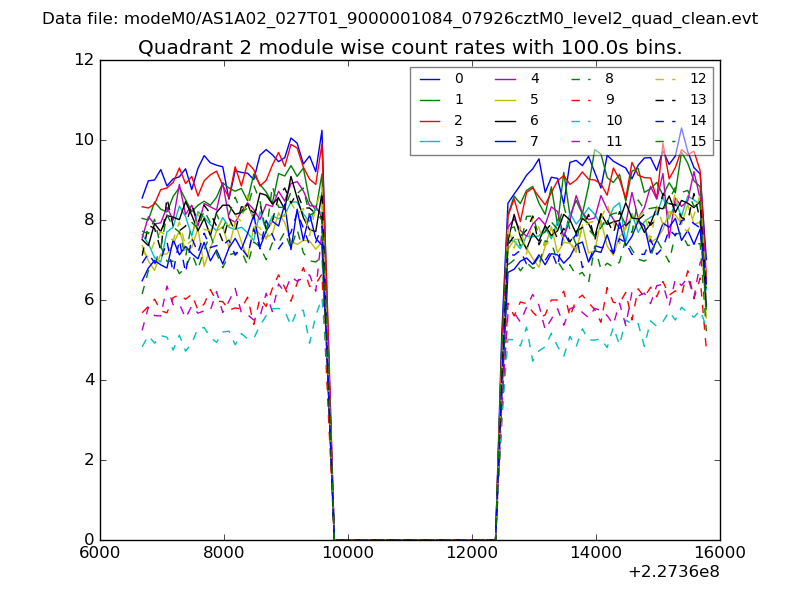
| Module-wise count rates for Quadrant B Data is divided into 100 sec bins |
 |
 |
| Module-wise count rates for Quadrant C Data is divided into 100 sec bins |
 |
 |
| Module-wise count rates for Quadrant D Data is divided into 100 sec bins |
 |
 |
| Parameter | Plot |
|---|---|
| CZT HV Monitor | 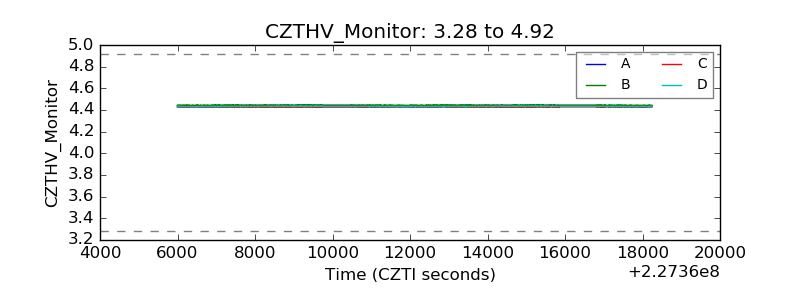 |
| D_VDD | 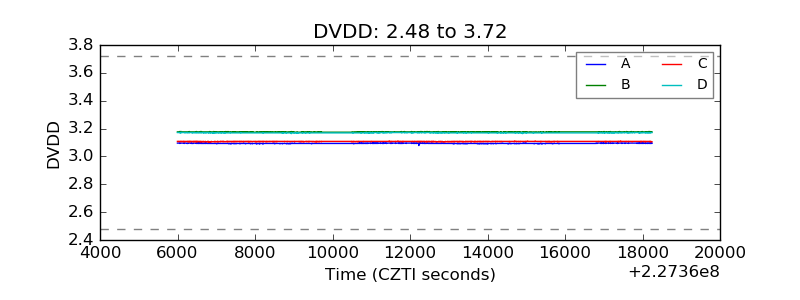 |
| Temperature 1 |  |
| Veto HV Monitor | 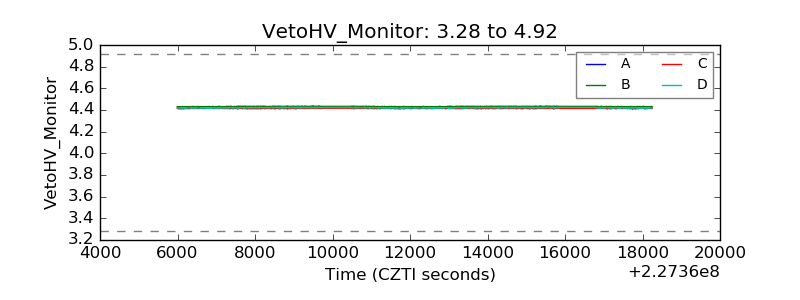 |
| Veto LLD | 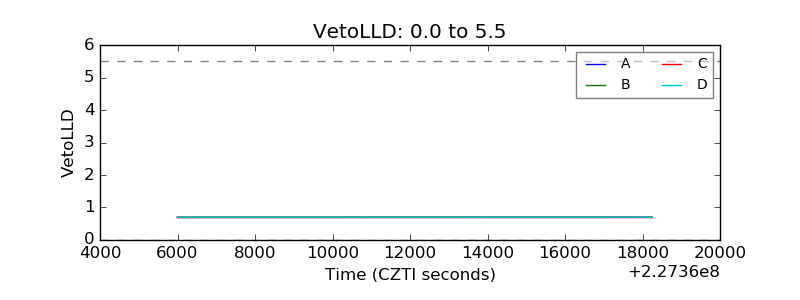 |
| Alpha Counter | 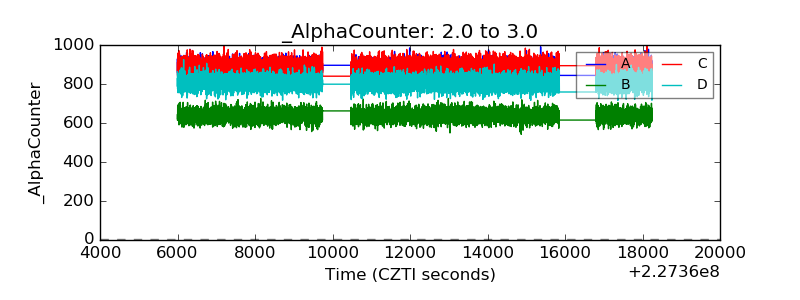 |
| _CPM_Rate | 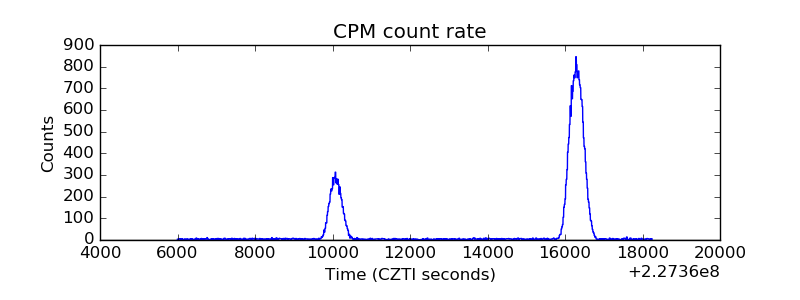 |
| CZT Counter | 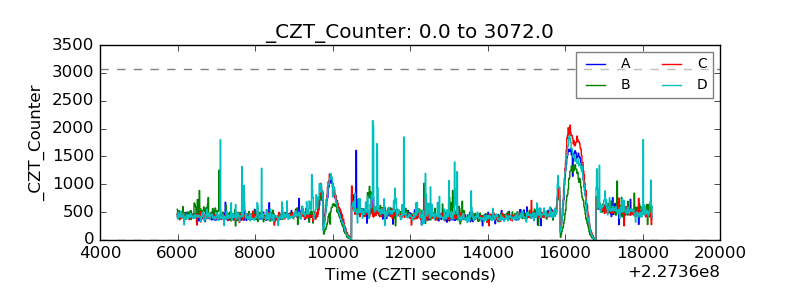 |
| +2.5 Volts monitor |  |
| +5 Volts monitor |  |
| _ROLL_ROT | 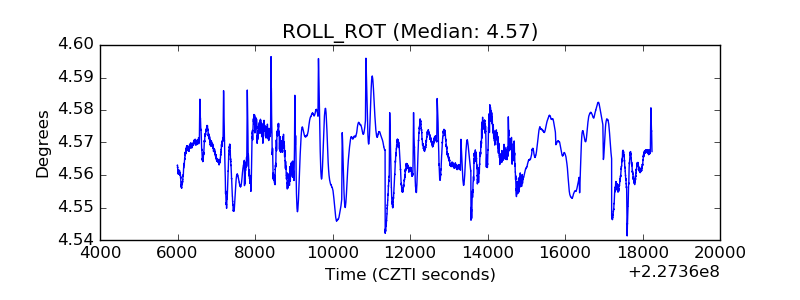 |
| _Roll_DEC | 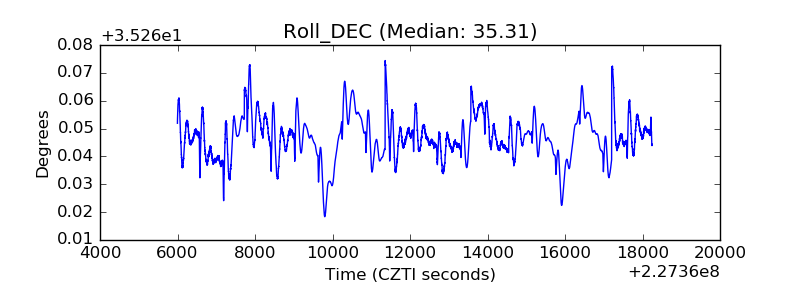 |
| _Roll_RA | 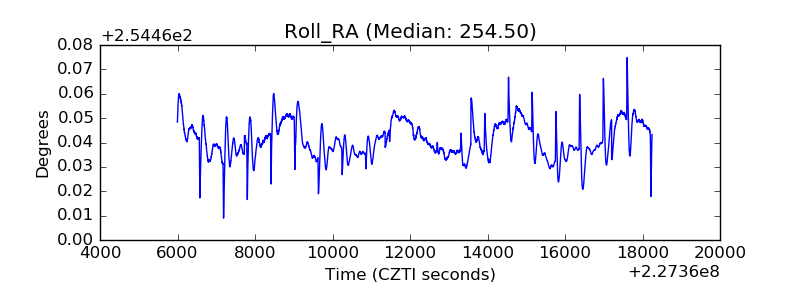 |
| Veto Counter | 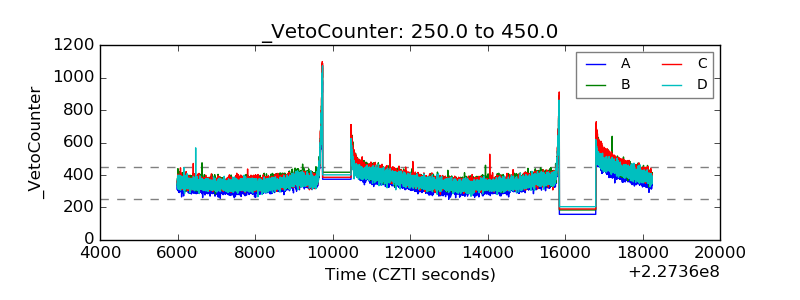 |