| Param | Original file | Final file |
|---|---|---|
| Filename | modeM0/AS1A02_027T01_9000001084_07927cztM0_level2.evt | modeM0/AS1A02_027T01_9000001084_07927cztM0_level2_quad_clean.evt |
| Size (bytes) | 465,266,880 | 80,256,960 |
| Size | 443.7 MB | 76.5 MB |
| Events in quadrant A | 3,198,158 | 483,872 |
| Events in quadrant B | 3,598,796 | 494,320 |
| Events in quadrant C | 3,175,360 | 502,098 |
| Events in quadrant D | 3,659,856 | 479,628 |
| Mode SS | |||
|---|---|---|---|
| Quadrant | BADHDUFLAG | Total packets | Discarded packets |
| A | 0 | 138 | 0 |
| B | 0 | 138 | 0 |
| C | 0 | 138 | 0 |
| D | 0 | 138 | 0 |
| Mode M0 | |||
|---|---|---|---|
| Quadrant | BADHDUFLAG | Total packets | Discarded packets |
| A | 0 | 14018 | 3 |
| B | 0 | 15190 | 2 |
| C | 0 | 13926 | 2 |
| D | 0 | 15392 | 2 |
| Mode M9 | |||
|---|---|---|---|
| Quadrant | BADHDUFLAG | Total packets | Discarded packets |
| A | 0 | 18 | 0 |
| B | 0 | 18 | 0 |
| C | 0 | 18 | 0 |
| D | 0 | 19 | 0 |
| Quadrant | Total seconds | Saturated seconds | Saturation percentage |
|---|---|---|---|
| A | 6744 | 47 | 0.696916% |
| B | 6744 | 121 | 1.794187% |
| C | 6744 | 37 | 0.548636% |
| D | 6744 | 74 | 1.097272% |
Noise dominated data is calculated using 1-second bins in cleaned event files. If a bin has >2000 counts, and if more than 50% of those come from <1% of pixels, then it is considered to be noise-dominated and hence unusable.
| Quadrant | # 1 sec bins | Bins with >0 counts | Bins with >2000 counts | High rate bins dominated by noise | Noise dominated (total time) | Noise dominated (detector-on time) | Marked lightcurve |
|---|---|---|---|---|---|---|---|
| A | 7824 | 6745 | 0 | 0 | 0.00% | 0.00% | 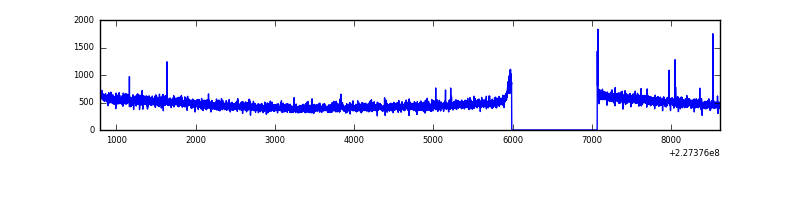 |
| B | 7824 | 6745 | 23 | 23 | 0.29% | 0.34% | 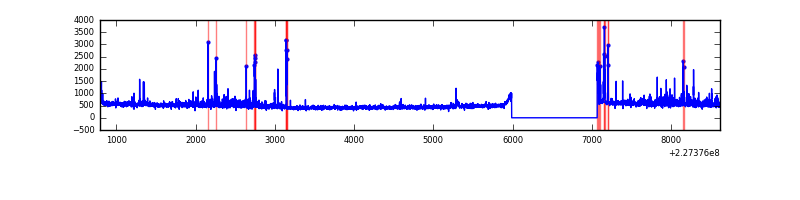 |
| C | 7824 | 6745 | 0 | 0 | 0.00% | 0.00% | 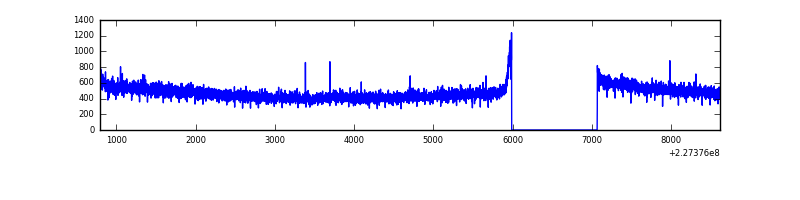 |
| D | 7824 | 6745 | 29 | 29 | 0.37% | 0.43% | 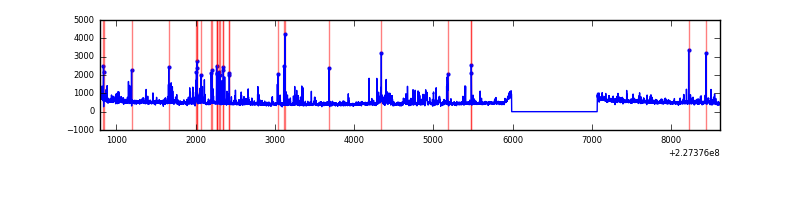 |
Top three noisy pixels from each quadrant. If the there are fewer than three noisy pixels in the level2.evt file, extra rows are filled as -1
| Pixel properties | Quadrant properties | ||||||
|---|---|---|---|---|---|---|---|
| Quadrant | DetID | PixID | Counts | Sigma | Mean | Median | Sigma |
| A | 8 | 15 | 21257 | 121.84 | 820 | 800 | 167.9 |
| A | 15 | 234 | 21226 | 121.66 | 820 | 800 | 167.9 |
| A | 0 | 226 | 7944 | 42.55 | 820 | 800 | 167.9 |
| B | 11 | 51 | 195042 | 1230.88 | 824 | 805 | 157.8 |
| B | 4 | 239 | 130854 | 824.12 | 824 | 805 | 157.8 |
| B | 10 | 16 | 33244 | 205.57 | 824 | 805 | 157.8 |
| C | 1 | 16 | 13440 | 67.08 | 810 | 816 | 188.2 |
| C | 13 | 61 | 6205 | 28.64 | 810 | 816 | 188.2 |
| C | 14 | 67 | 2225 | 7.49 | 810 | 816 | 188.2 |
| D | 5 | 233 | 320355 | 1605.01 | 807 | 783 | 199.1 |
| D | 1 | 52 | 99918 | 497.89 | 807 | 783 | 199.1 |
| D | 7 | 55 | 40774 | 200.85 | 807 | 783 | 199.1 |
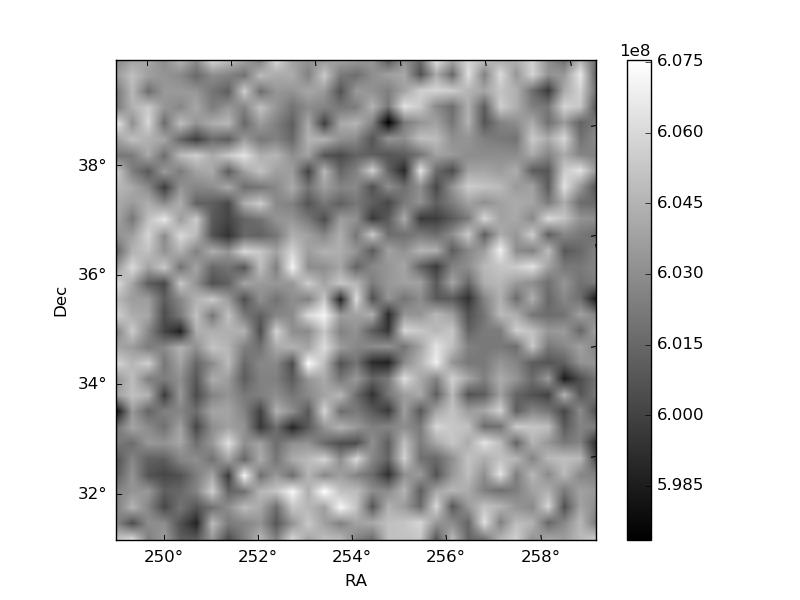
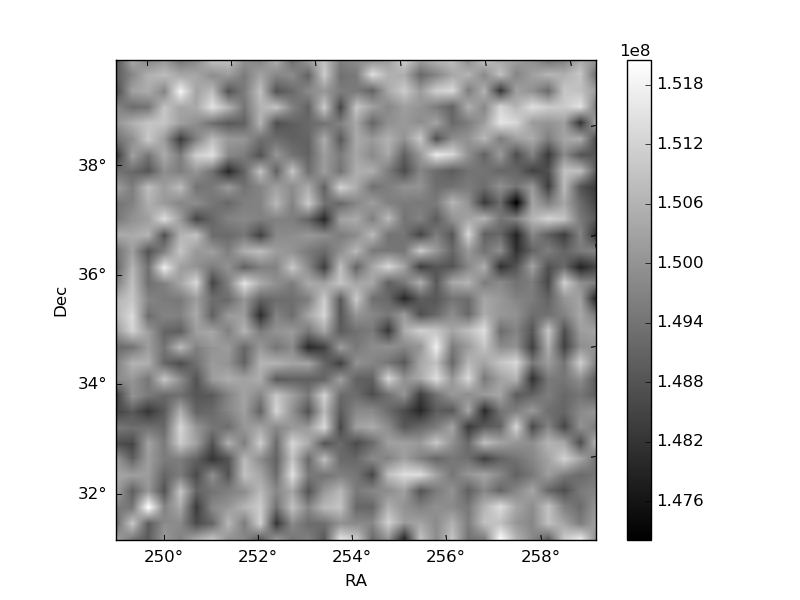
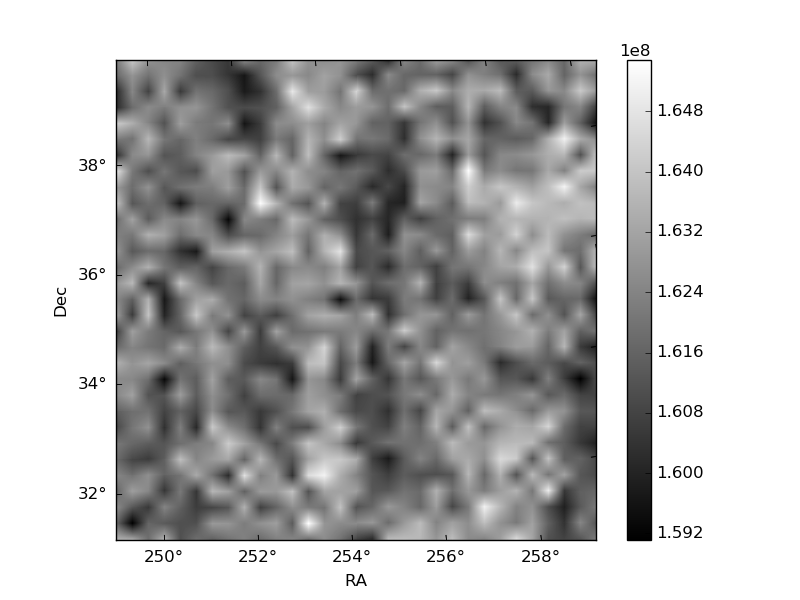
Histogram calculated using DETX and DETY for each event in the final _common_clean file
| Quadrant A | 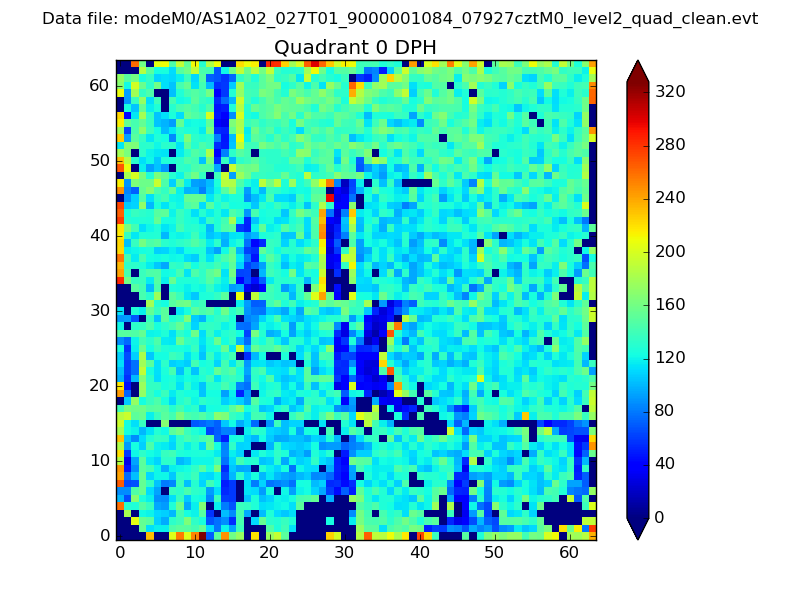 |
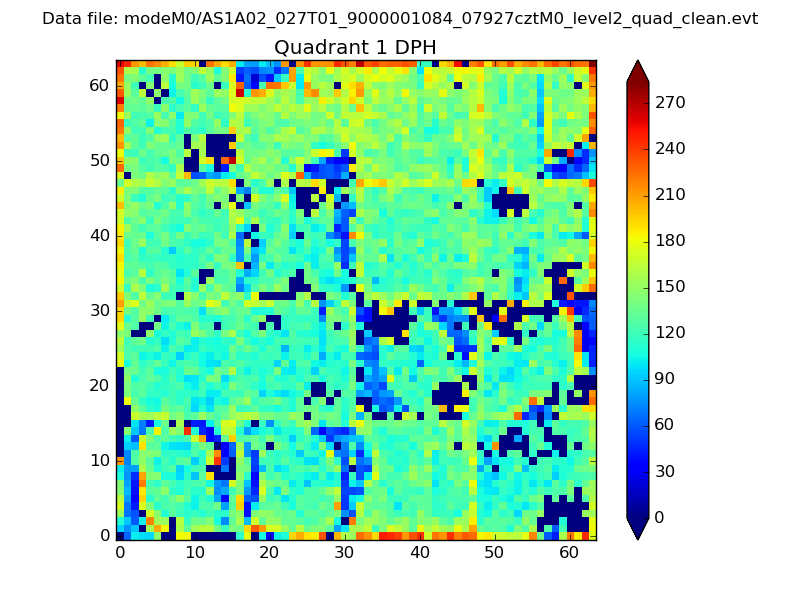 |
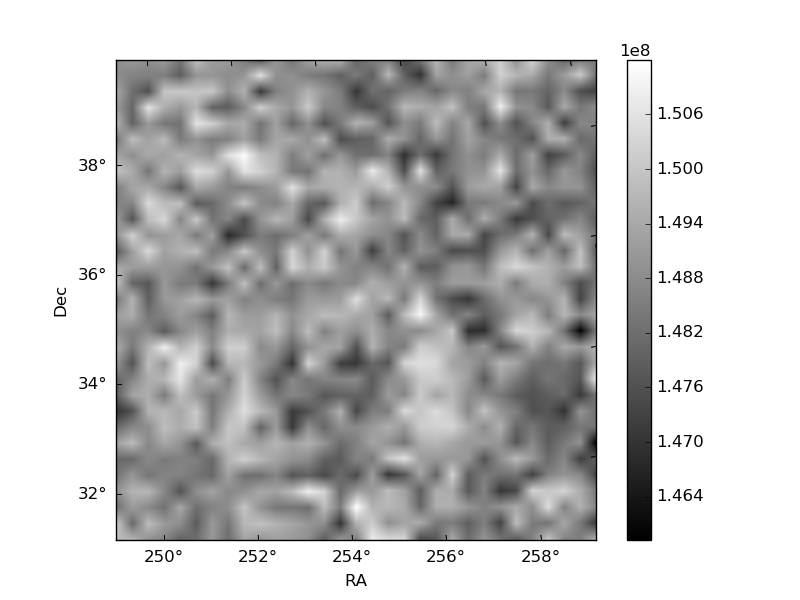
Quadrant B |
|---|---|---|---|
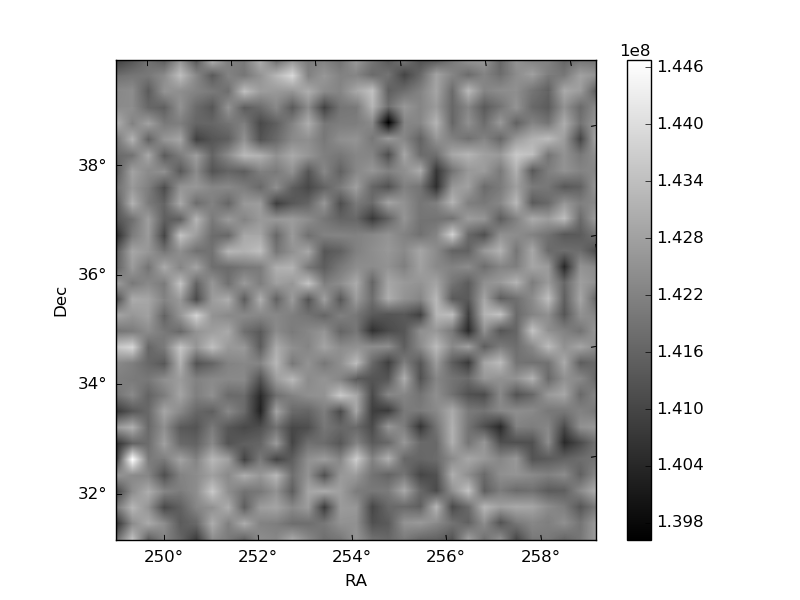
| Quadrant D | 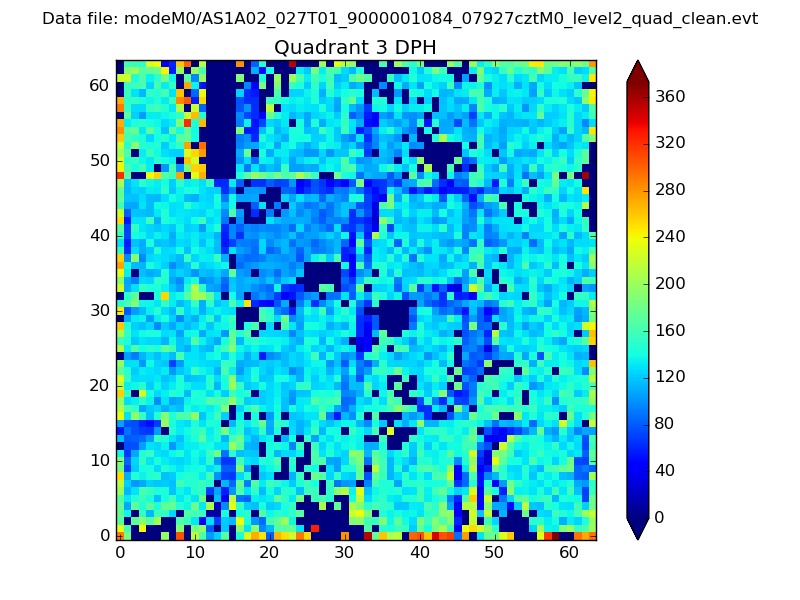 |
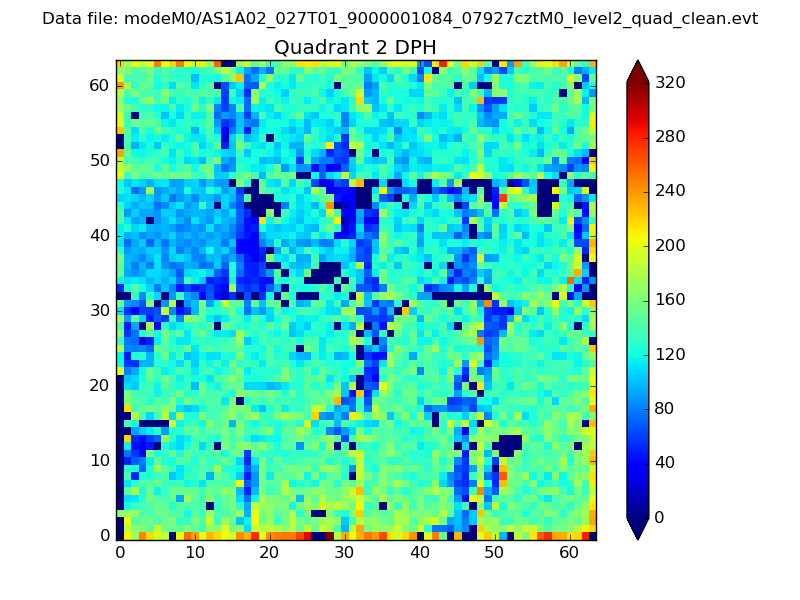 |
Quadrant C |
| Plot type | Count rate plots | Images |
|---|---|---|
| Comparison with Poisson distribution Blue bars denote a histogram of data divided into 1 sec bins. Red curve is a Poisson curve with rate = median count rate of data. |
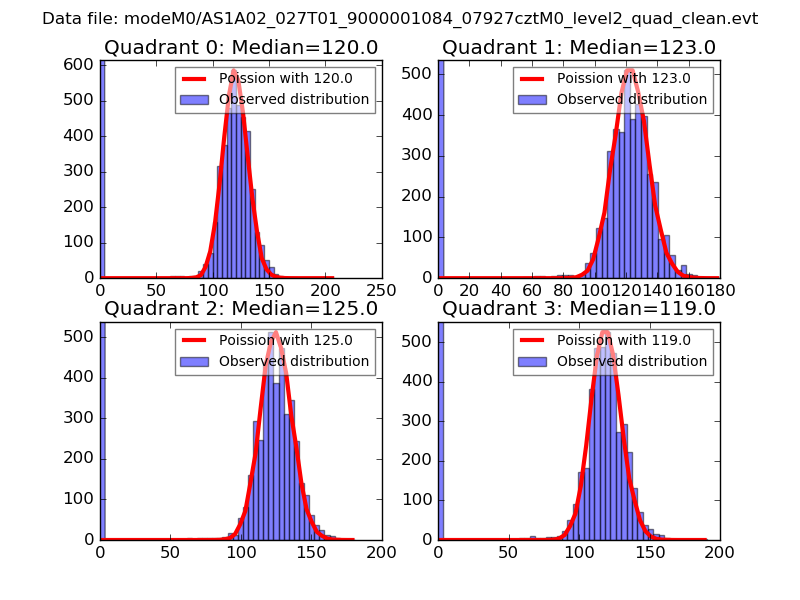 |
 |
| Quadrant-wise count rates Data is divided into 100 sec bins |
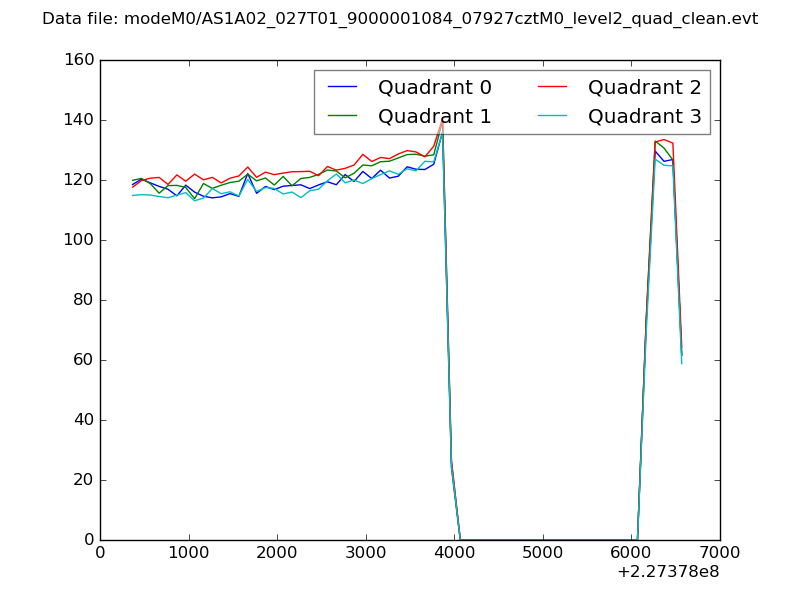 |
|
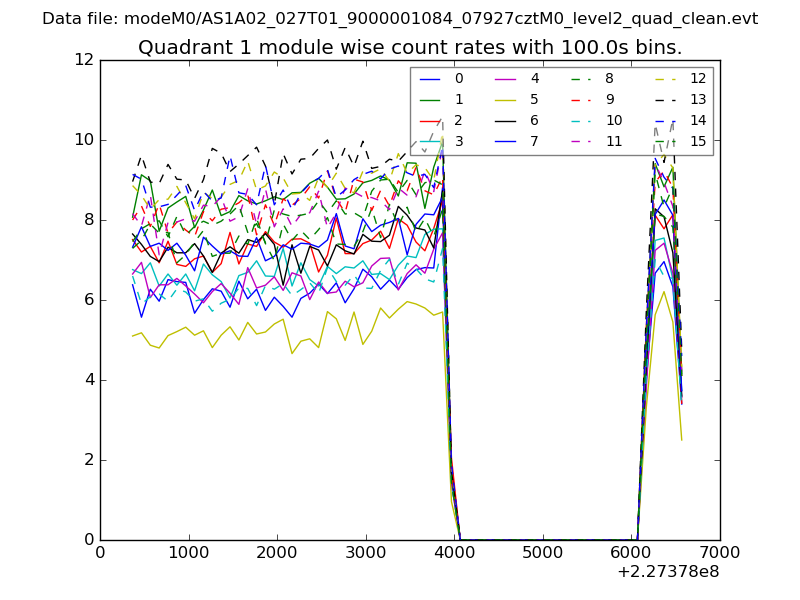
| Module-wise count rates for Quadrant A Data is divided into 100 sec bins |
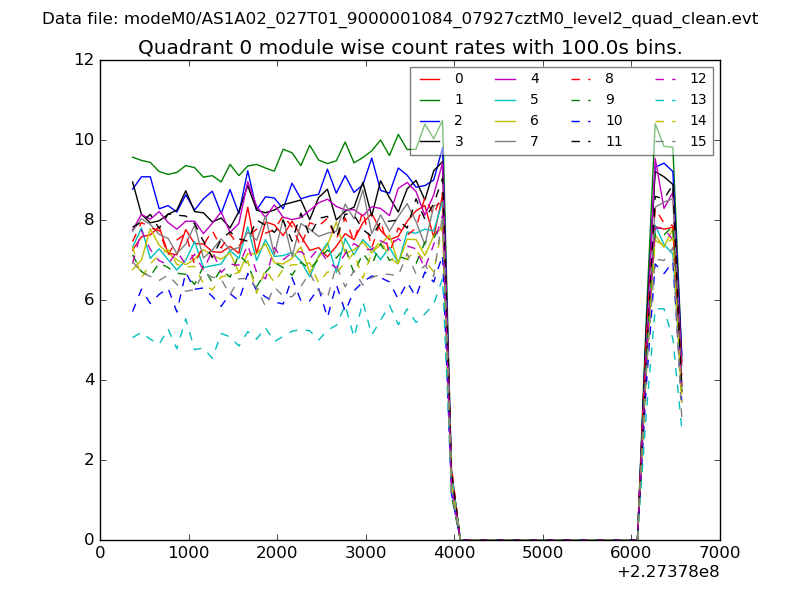 |
 |
| Module-wise count rates for Quadrant B Data is divided into 100 sec bins |
 |
 |
| Module-wise count rates for Quadrant C Data is divided into 100 sec bins |
 |
 |
| Module-wise count rates for Quadrant D Data is divided into 100 sec bins |
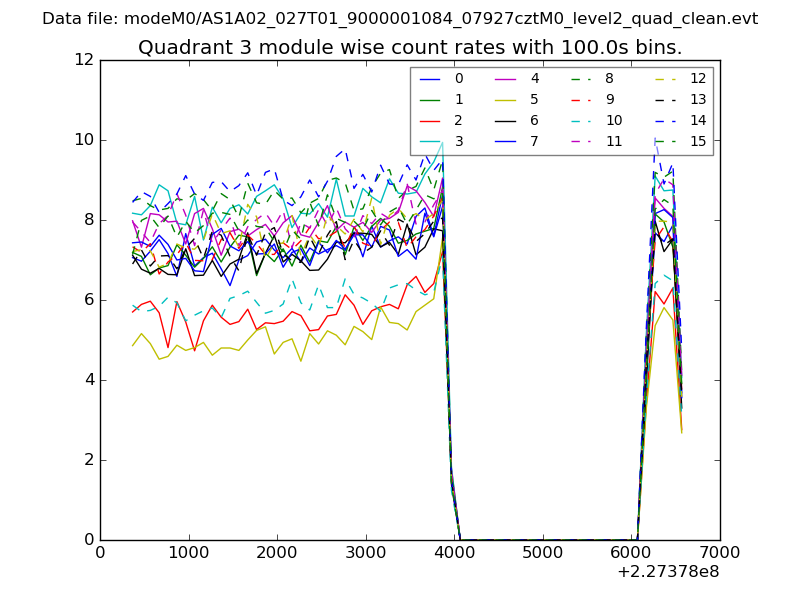 |
 |
| Parameter | Plot |
|---|---|
| CZT HV Monitor | 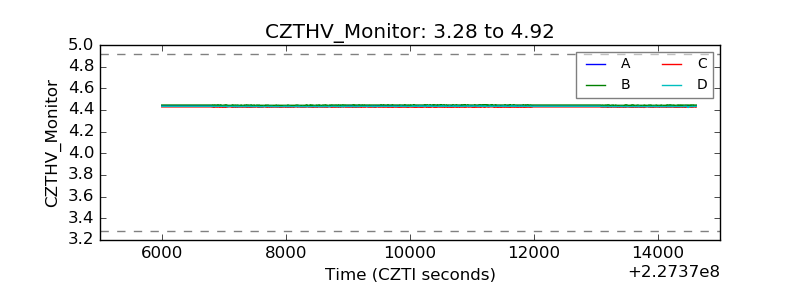 |
| D_VDD | 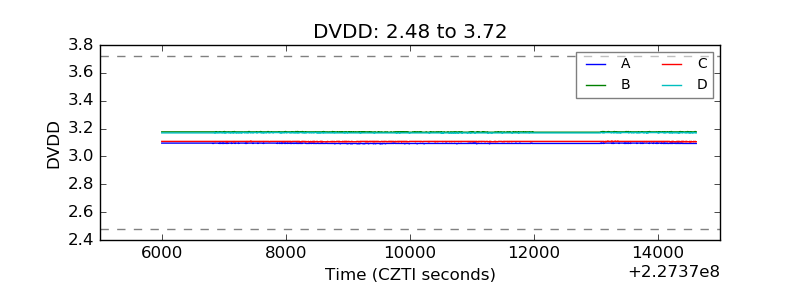 |
| Temperature 1 | 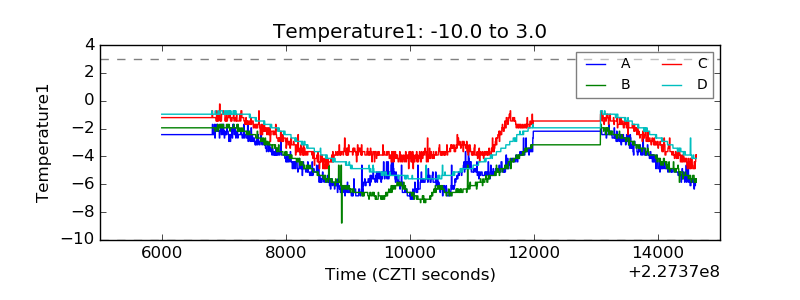 |
| Veto HV Monitor | 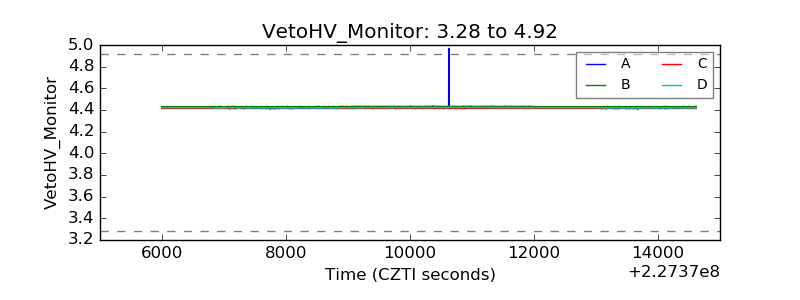 |
| Veto LLD | 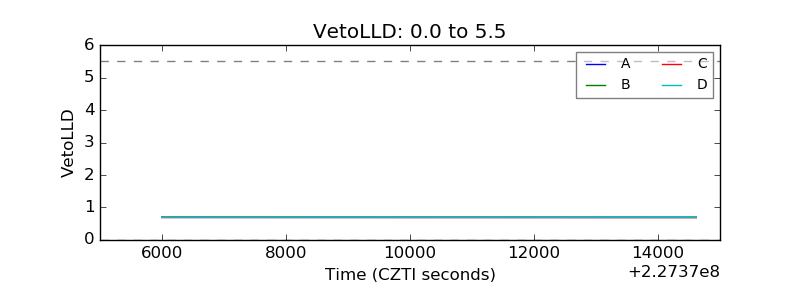 |
| Alpha Counter | 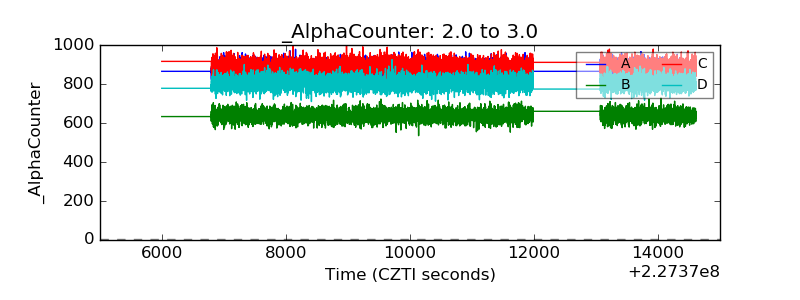 |
| _CPM_Rate | 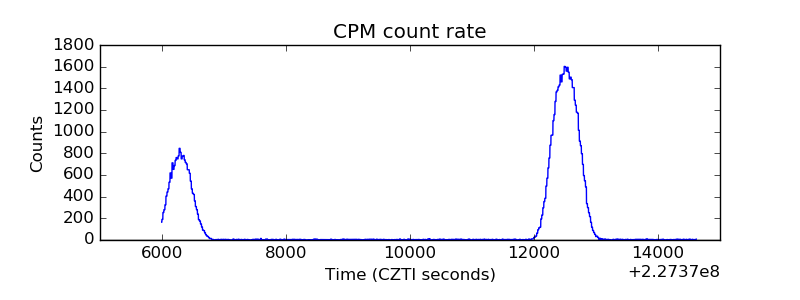 |
| CZT Counter | 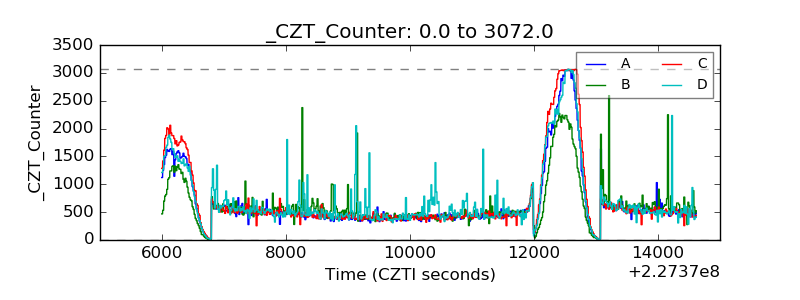 |
| +2.5 Volts monitor |  |
| +5 Volts monitor |  |
| _ROLL_ROT | 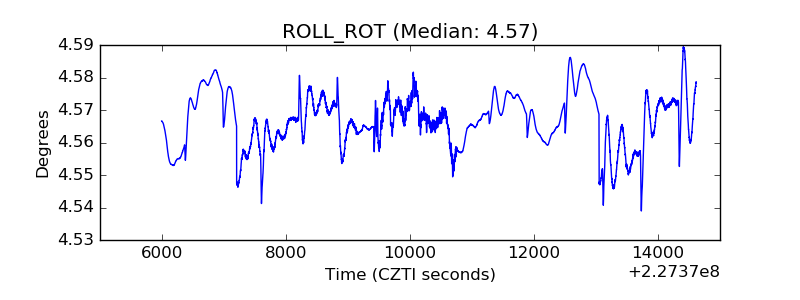 |
| _Roll_DEC |  |
| _Roll_RA | 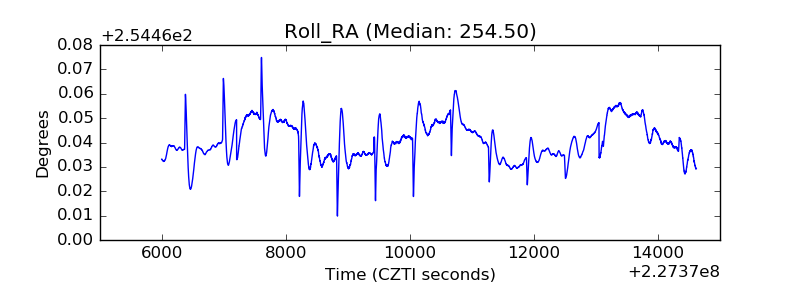 |
| Veto Counter | 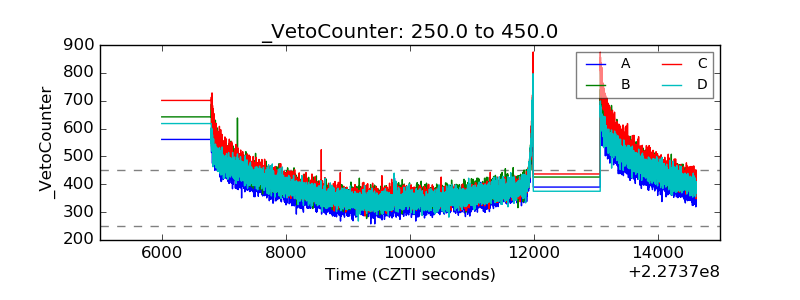 |