| Param | Original file | Final file |
|---|---|---|
| Filename | modeM0/AS1A02_027T01_9000001084_07929cztM0_level2.evt | modeM0/AS1A02_027T01_9000001084_07929cztM0_level2_quad_clean.evt |
| Size (bytes) | 454,213,440 | 85,461,120 |
| Size | 433.2 MB | 81.5 MB |
| Events in quadrant A | 3,124,317 | 529,253 |
| Events in quadrant B | 3,604,588 | 541,595 |
| Events in quadrant C | 3,072,723 | 552,602 |
| Events in quadrant D | 3,521,303 | 520,014 |
| Mode SS | |||
|---|---|---|---|
| Quadrant | BADHDUFLAG | Total packets | Discarded packets |
| A | 0 | 130 | 0 |
| B | 0 | 130 | 0 |
| C | 0 | 130 | 0 |
| D | 0 | 130 | 0 |
| Mode M0 | |||
|---|---|---|---|
| Quadrant | BADHDUFLAG | Total packets | Discarded packets |
| A | 0 | 13646 | 3 |
| B | 0 | 15072 | 2 |
| C | 0 | 13367 | 2 |
| D | 0 | 14683 | 2 |
| Mode M9 | |||
|---|---|---|---|
| Quadrant | BADHDUFLAG | Total packets | Discarded packets |
| A | 0 | 15 | 0 |
| B | 0 | 15 | 0 |
| C | 0 | 15 | 0 |
| D | 0 | 16 | 0 |
| Quadrant | Total seconds | Saturated seconds | Saturation percentage |
|---|---|---|---|
| A | 6369 | 54 | 0.847857% |
| B | 6369 | 167 | 2.622076% |
| C | 6369 | 31 | 0.486733% |
| D | 6369 | 65 | 1.020568% |
Noise dominated data is calculated using 1-second bins in cleaned event files. If a bin has >2000 counts, and if more than 50% of those come from <1% of pixels, then it is considered to be noise-dominated and hence unusable.
| Quadrant | # 1 sec bins | Bins with >0 counts | Bins with >2000 counts | High rate bins dominated by noise | Noise dominated (total time) | Noise dominated (detector-on time) | Marked lightcurve |
|---|---|---|---|---|---|---|---|
| A | 7569 | 6370 | 8 | 8 | 0.11% | 0.13% |  |
| B | 7569 | 6370 | 47 | 47 | 0.62% | 0.74% |  |
| C | 7569 | 6370 | 0 | 0 | 0.00% | 0.00% | 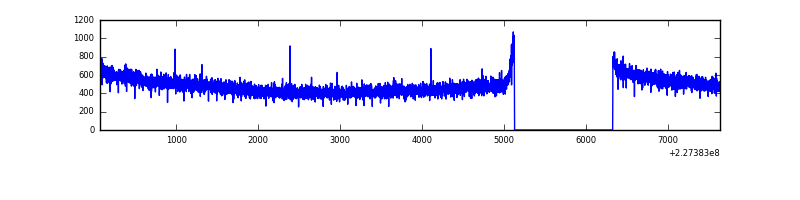 |
| D | 7569 | 6370 | 23 | 23 | 0.30% | 0.36% |  |
Top three noisy pixels from each quadrant. If the there are fewer than three noisy pixels in the level2.evt file, extra rows are filled as -1
| Pixel properties | Quadrant properties | ||||||
|---|---|---|---|---|---|---|---|
| Quadrant | DetID | PixID | Counts | Sigma | Mean | Median | Sigma |
| A | 15 | 234 | 81973 | 508.07 | 787 | 772 | 159.8 |
| A | 8 | 15 | 10032 | 57.94 | 787 | 772 | 159.8 |
| A | 0 | 226 | 7696 | 43.32 | 787 | 772 | 159.8 |
| B | 4 | 239 | 260890 | 1743.31 | 794 | 774 | 149.2 |
| B | 11 | 51 | 122588 | 816.4 | 794 | 774 | 149.2 |
| B | 0 | 219 | 45741 | 301.37 | 794 | 774 | 149.2 |
| C | 14 | 67 | 6589 | 32.04 | 785 | 791 | 181.0 |
| C | 13 | 61 | 6114 | 29.42 | 785 | 791 | 181.0 |
| C | 1 | 16 | 4352 | 19.68 | 785 | 791 | 181.0 |
| D | 1 | 52 | 194090 | 1016.23 | 777 | 756 | 190.2 |
| D | 2 | 152 | 144250 | 754.25 | 777 | 756 | 190.2 |
| D | 4 | 95 | 67440 | 350.51 | 777 | 756 | 190.2 |
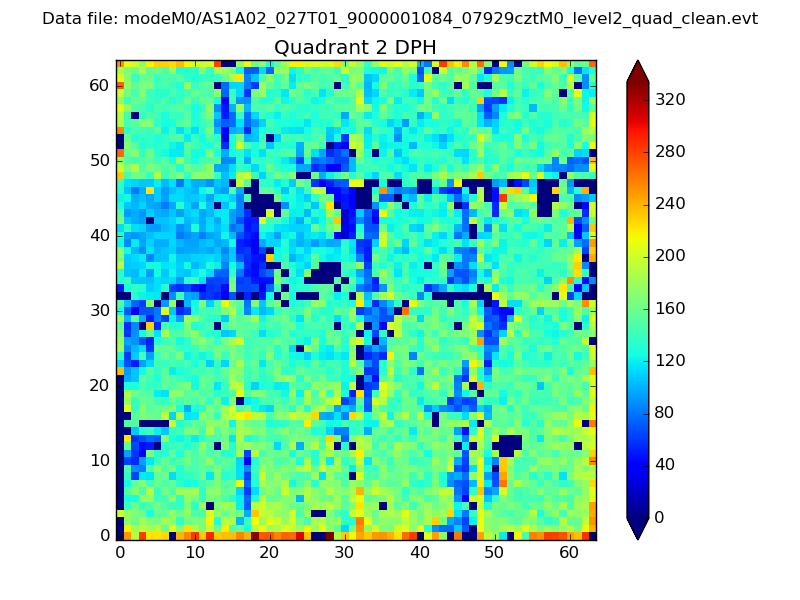
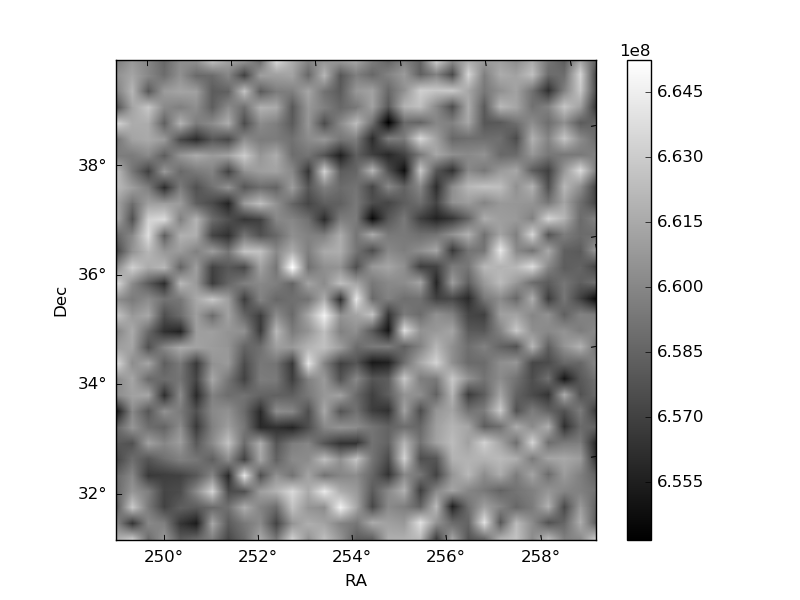
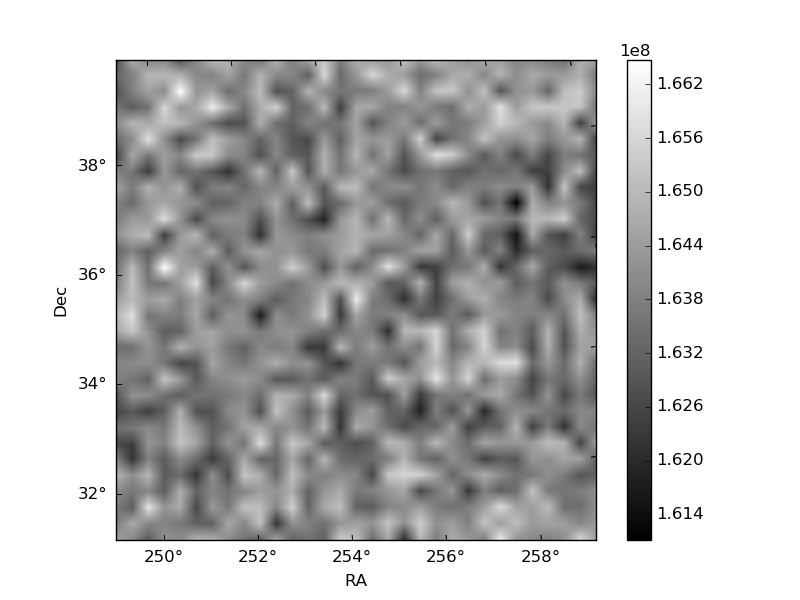
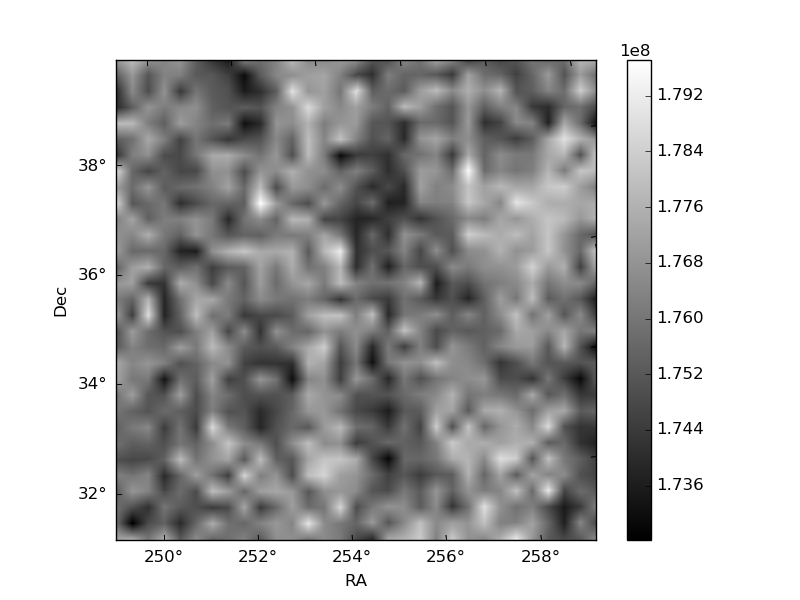
Histogram calculated using DETX and DETY for each event in the final _common_clean file
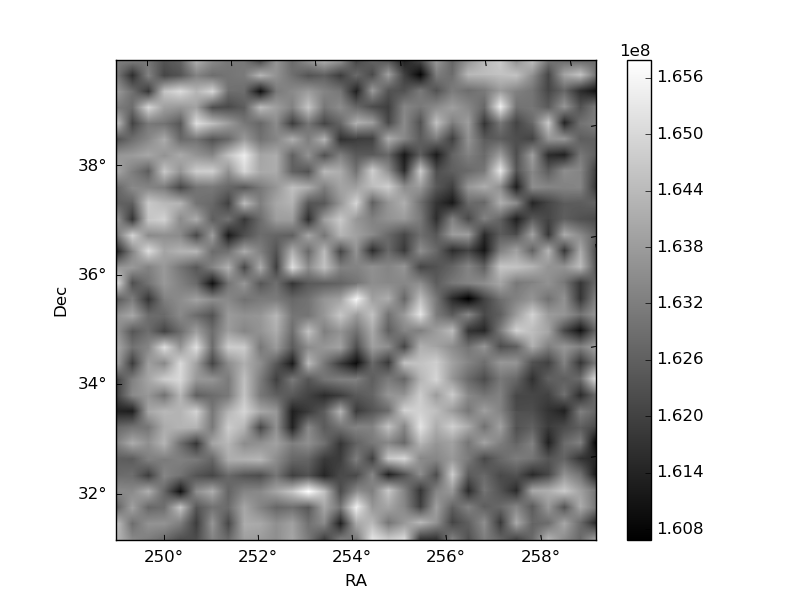
| Quadrant A |  |
 |
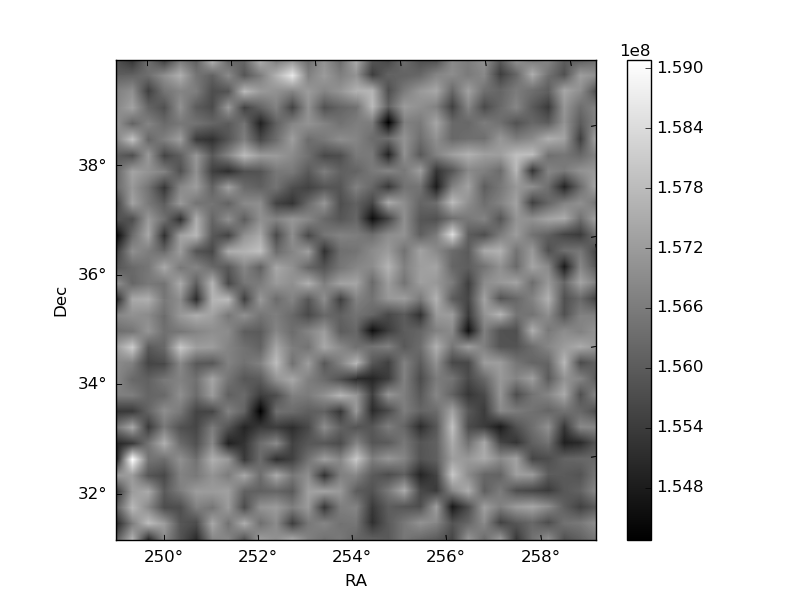
Quadrant B |
|---|---|---|---|
| Quadrant D | 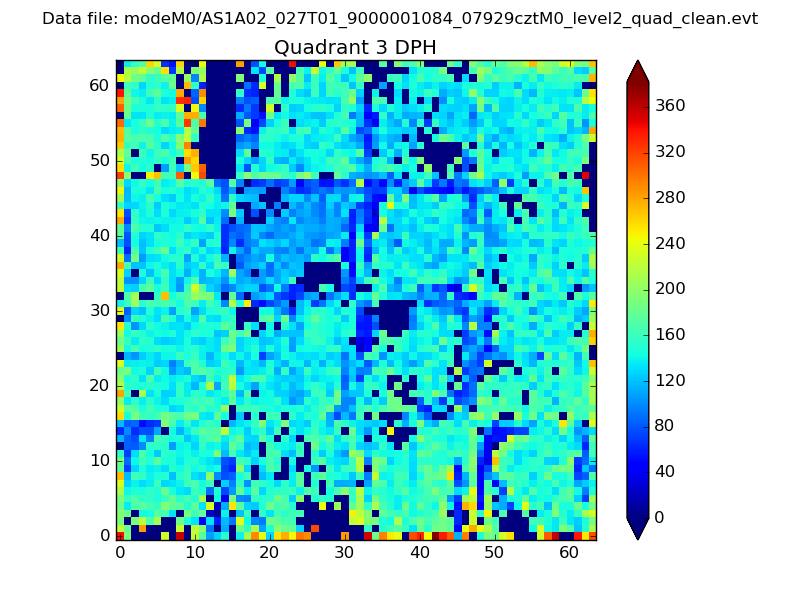 |
 |
Quadrant C |
| Plot type | Count rate plots | Images |
|---|---|---|
| Comparison with Poisson distribution Blue bars denote a histogram of data divided into 1 sec bins. Red curve is a Poisson curve with rate = median count rate of data. |
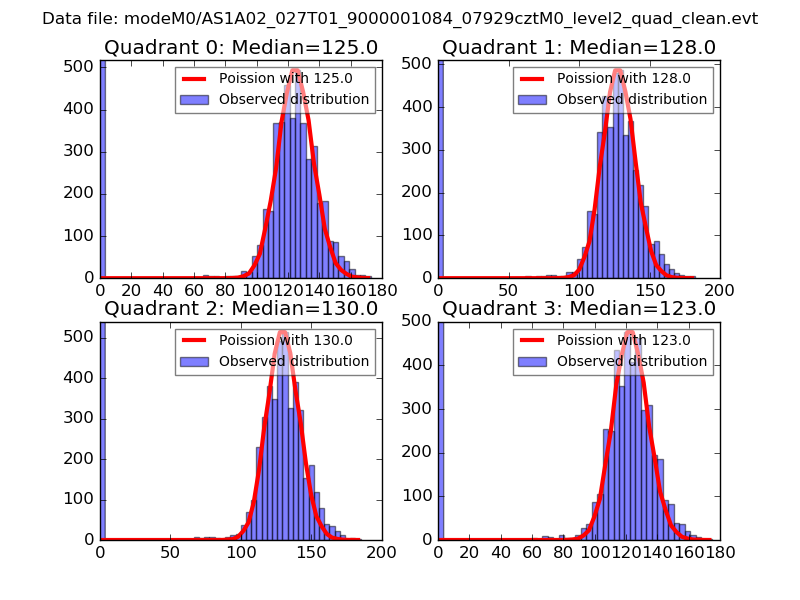 |
 |
| Quadrant-wise count rates Data is divided into 100 sec bins |
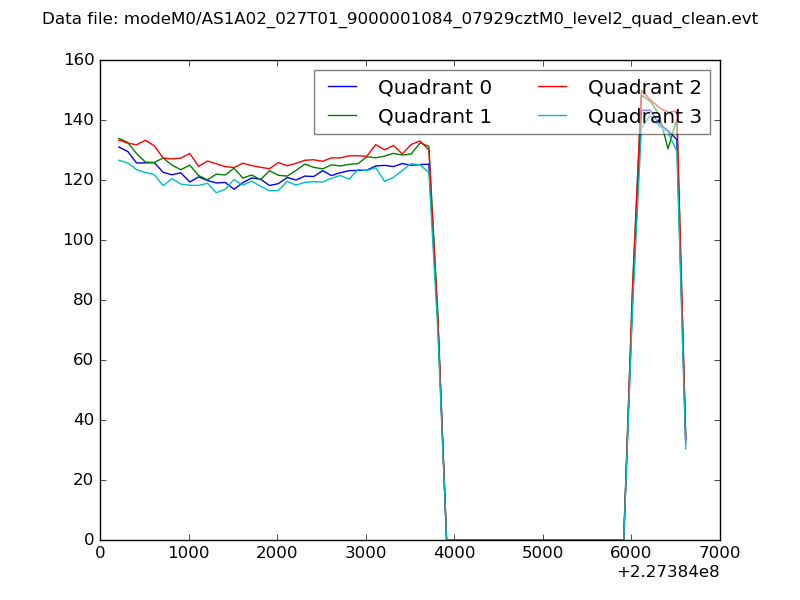 |
|
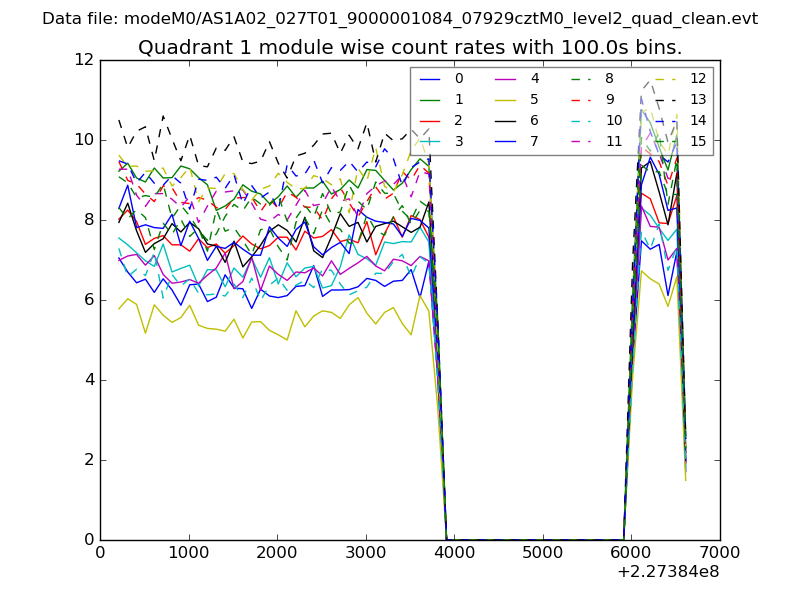
| Module-wise count rates for Quadrant A Data is divided into 100 sec bins |
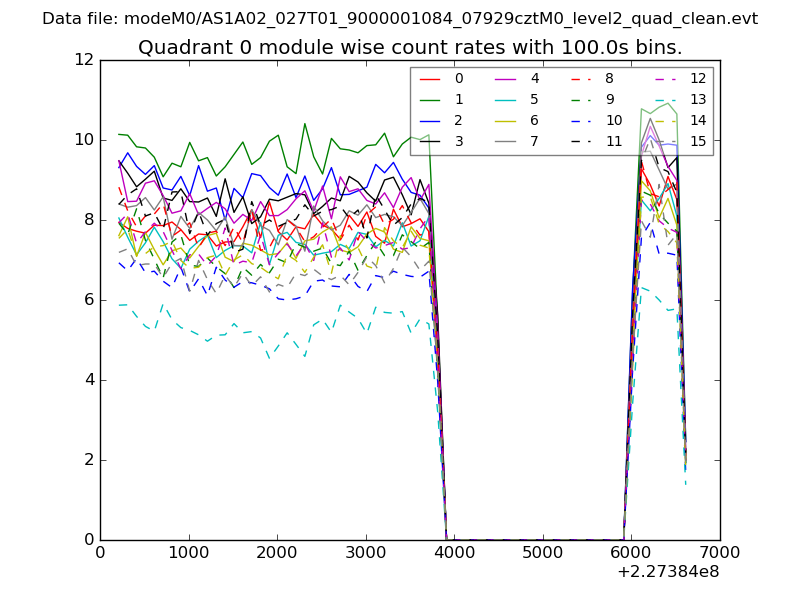 |
 |
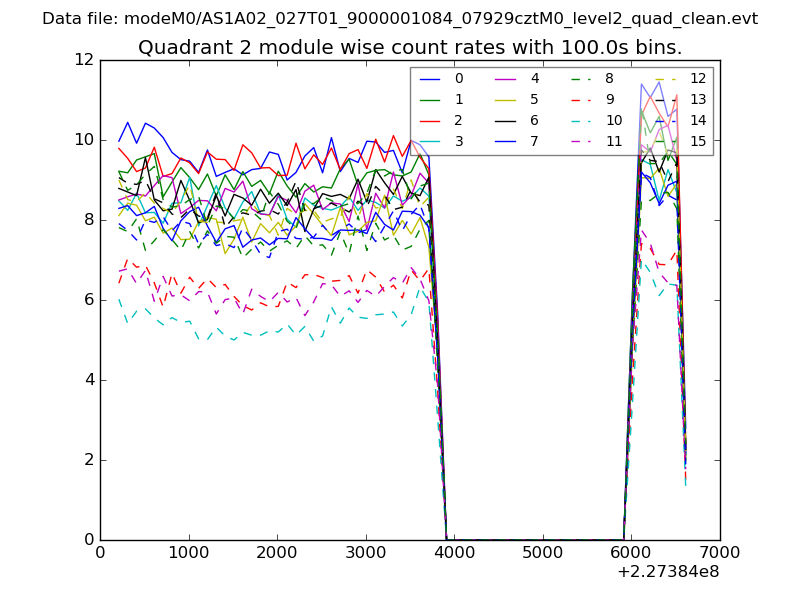
| Module-wise count rates for Quadrant B Data is divided into 100 sec bins |
 |
 |
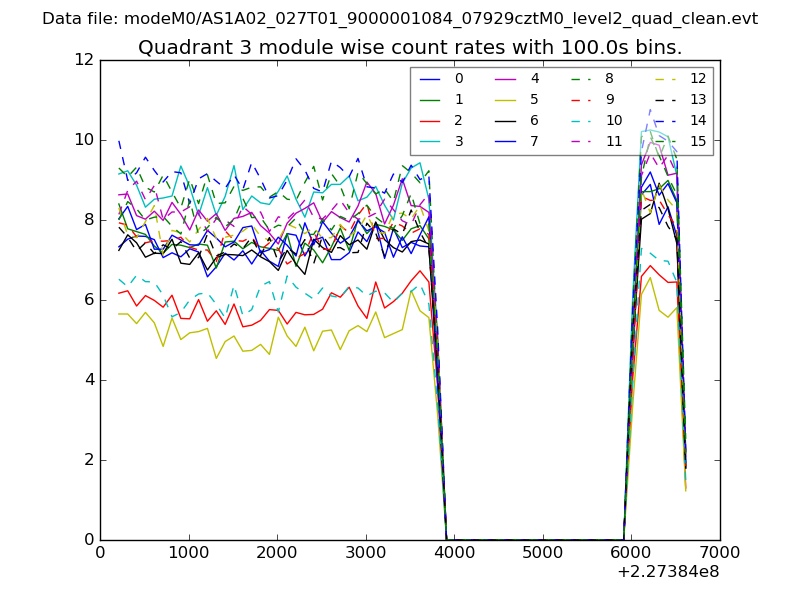
| Module-wise count rates for Quadrant C Data is divided into 100 sec bins |
 |
 |
| Module-wise count rates for Quadrant D Data is divided into 100 sec bins |
 |
 |
| Parameter | Plot |
|---|---|
| CZT HV Monitor | 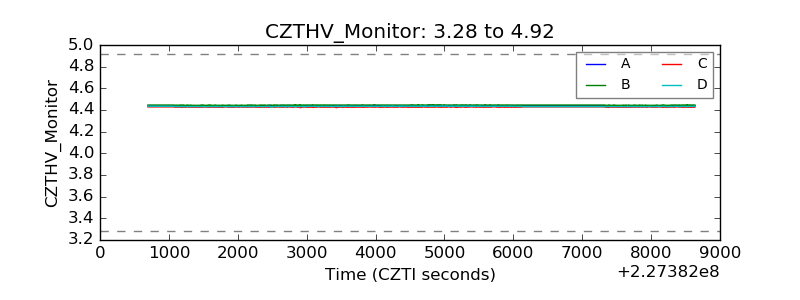 |
| D_VDD | 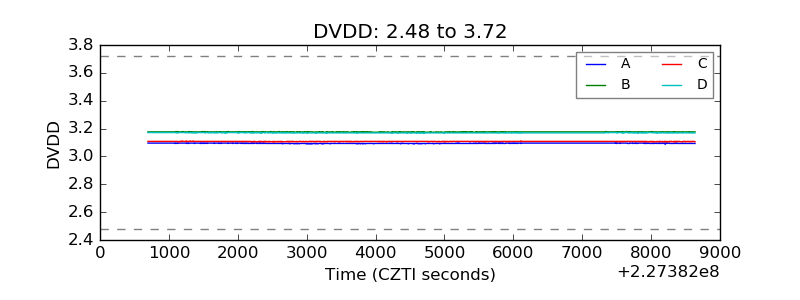 |
| Temperature 1 | 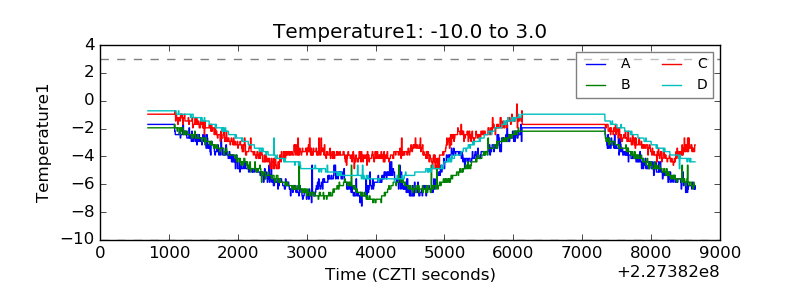 |
| Veto HV Monitor | 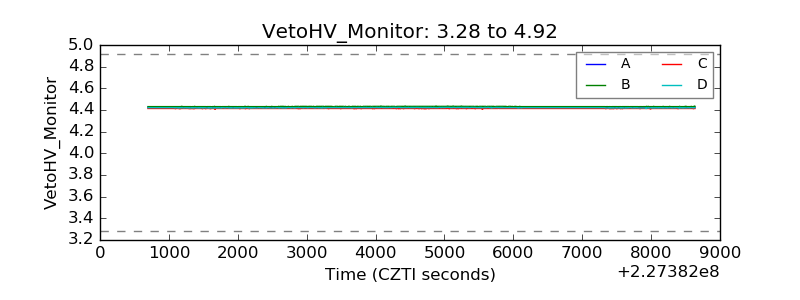 |
| Veto LLD | 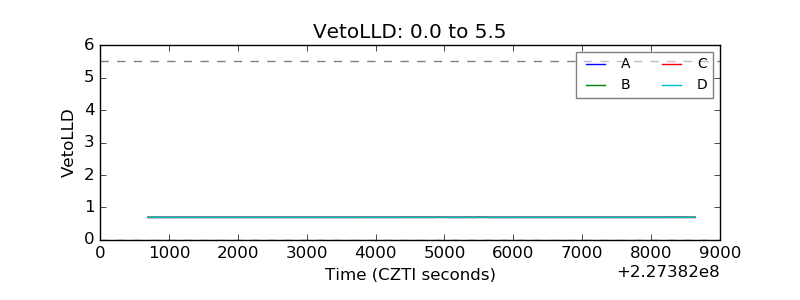 |
| Alpha Counter | 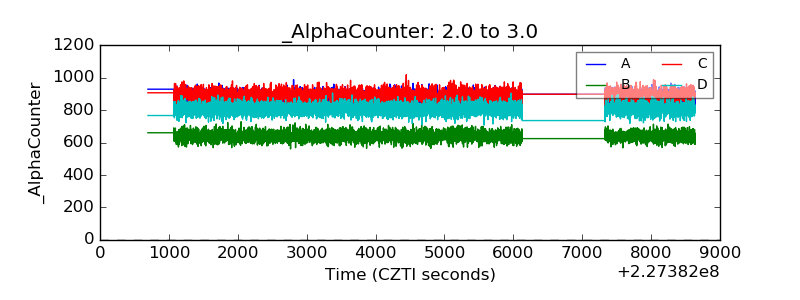 |
| _CPM_Rate | 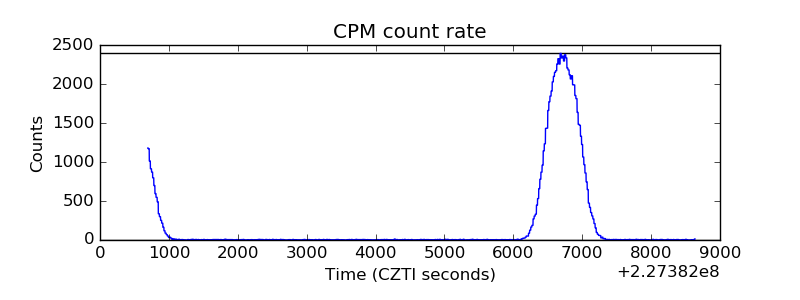 |
| CZT Counter | 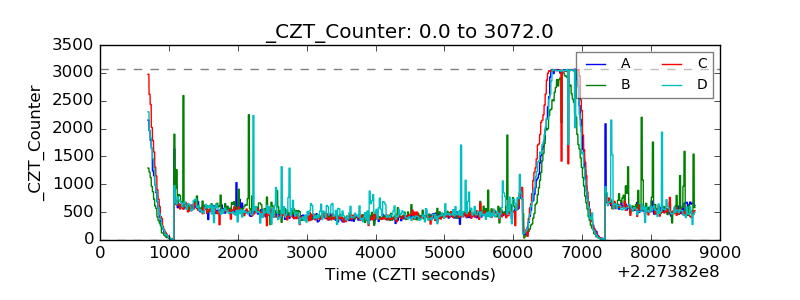 |
| +2.5 Volts monitor | 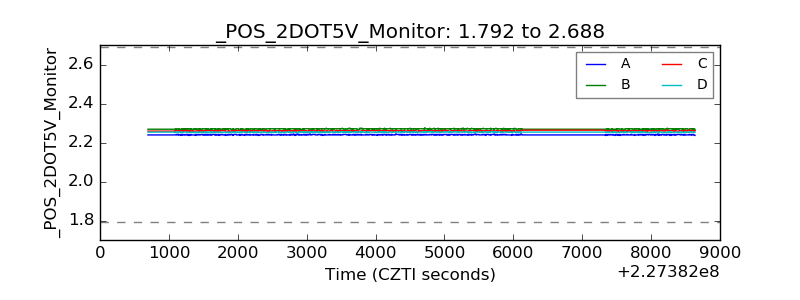 |
| +5 Volts monitor |  |
| _ROLL_ROT | 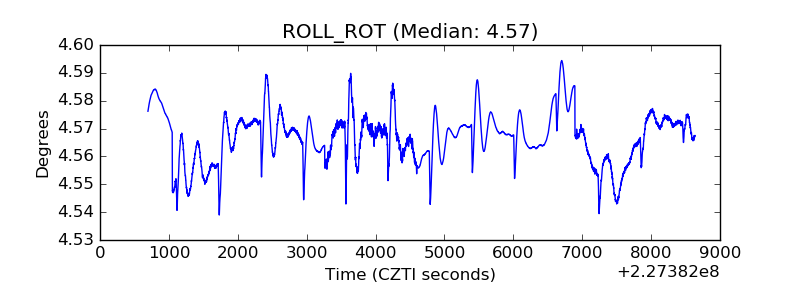 |
| _Roll_DEC | 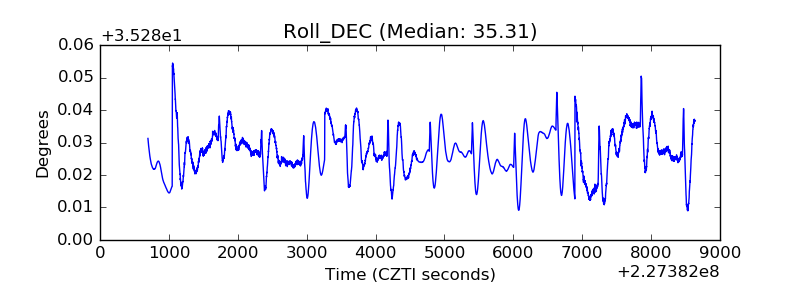 |
| _Roll_RA | 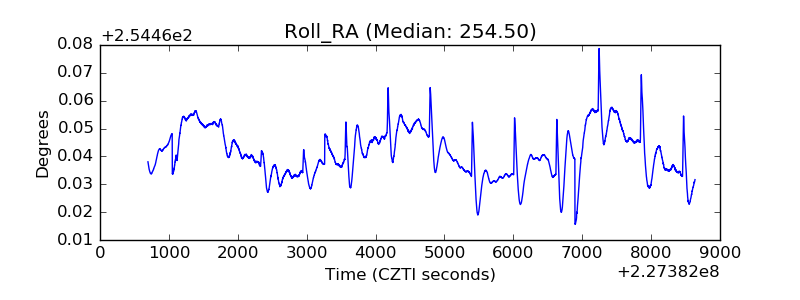 |
| Veto Counter | 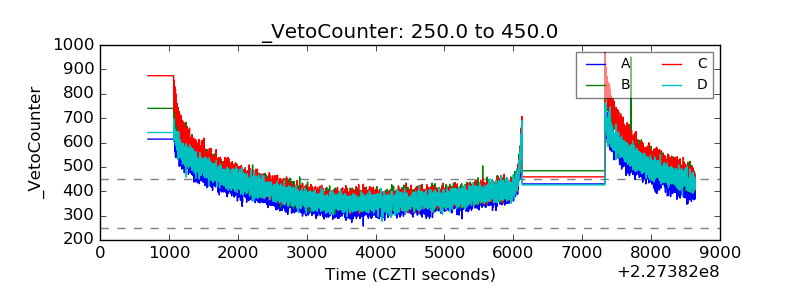 |