| Param | Original file | Final file |
|---|---|---|
| Filename | modeM0/AS1A02_027T01_9000001084_07930cztM0_level2.evt | modeM0/AS1A02_027T01_9000001084_07930cztM0_level2_quad_clean.evt |
| Size (bytes) | 456,361,920 | 95,304,960 |
| Size | 435.2 MB | 90.9 MB |
| Events in quadrant A | 3,346,562 | 599,739 |
| Events in quadrant B | 3,457,801 | 624,164 |
| Events in quadrant C | 3,068,649 | 634,683 |
| Events in quadrant D | 3,525,448 | 593,494 |
| Mode SS | |||
|---|---|---|---|
| Quadrant | BADHDUFLAG | Total packets | Discarded packets |
| A | 0 | 126 | 0 |
| B | 0 | 126 | 0 |
| C | 0 | 126 | 0 |
| D | 0 | 126 | 0 |
| Mode M0 | |||
|---|---|---|---|
| Quadrant | BADHDUFLAG | Total packets | Discarded packets |
| A | 0 | 13834 | 3 |
| B | 0 | 14490 | 2 |
| C | 0 | 13165 | 2 |
| D | 0 | 14632 | 2 |
| Mode M9 | |||
|---|---|---|---|
| Quadrant | BADHDUFLAG | Total packets | Discarded packets |
| A | 0 | 13 | 0 |
| B | 0 | 13 | 0 |
| C | 0 | 13 | 0 |
| D | 0 | 14 | 0 |
| Quadrant | Total seconds | Saturated seconds | Saturation percentage |
|---|---|---|---|
| A | 6222 | 40 | 0.642880% |
| B | 6222 | 144 | 2.314368% |
| C | 6222 | 32 | 0.514304% |
| D | 6222 | 89 | 1.430408% |
Noise dominated data is calculated using 1-second bins in cleaned event files. If a bin has >2000 counts, and if more than 50% of those come from <1% of pixels, then it is considered to be noise-dominated and hence unusable.
| Quadrant | # 1 sec bins | Bins with >0 counts | Bins with >2000 counts | High rate bins dominated by noise | Noise dominated (total time) | Noise dominated (detector-on time) | Marked lightcurve |
|---|---|---|---|---|---|---|---|
| A | 7497 | 6223 | 8 | 8 | 0.11% | 0.13% | 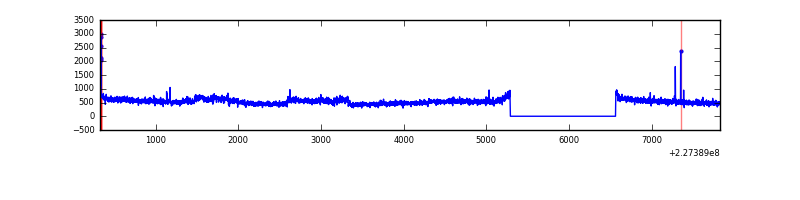 |
| B | 7497 | 6223 | 52 | 52 | 0.69% | 0.84% | 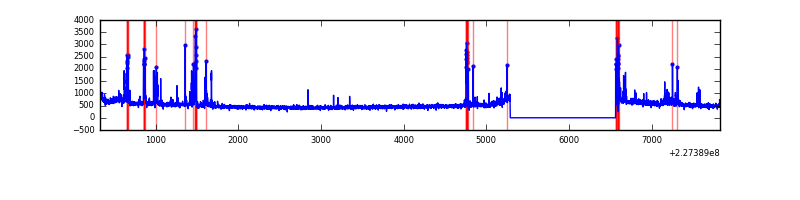 |
| C | 7497 | 6223 | 0 | 0 | 0.00% | 0.00% |  |
| D | 7497 | 6223 | 49 | 49 | 0.65% | 0.79% |  |
Top three noisy pixels from each quadrant. If the there are fewer than three noisy pixels in the level2.evt file, extra rows are filled as -1
| Pixel properties | Quadrant properties | ||||||
|---|---|---|---|---|---|---|---|
| Quadrant | DetID | PixID | Counts | Sigma | Mean | Median | Sigma |
| A | 15 | 234 | 326591 | 2070.86 | 778 | 764 | 157.3 |
| A | 15 | 223 | 12790 | 76.43 | 778 | 764 | 157.3 |
| A | 0 | 226 | 7626 | 43.61 | 778 | 764 | 157.3 |
| B | 4 | 239 | 235268 | 1586.85 | 789 | 770 | 147.8 |
| B | 0 | 219 | 55427 | 369.87 | 789 | 770 | 147.8 |
| B | 5 | 255 | 23930 | 156.72 | 789 | 770 | 147.8 |
| C | 14 | 67 | 17858 | 95.25 | 781 | 788 | 179.2 |
| C | 13 | 61 | 5922 | 28.65 | 781 | 788 | 179.2 |
| C | 1 | 16 | 5458 | 26.06 | 781 | 788 | 179.2 |
| D | 5 | 233 | 117624 | 620.61 | 767 | 745 | 188.3 |
| D | 12 | 233 | 106309 | 560.53 | 767 | 745 | 188.3 |
| D | 1 | 52 | 100840 | 531.49 | 767 | 745 | 188.3 |
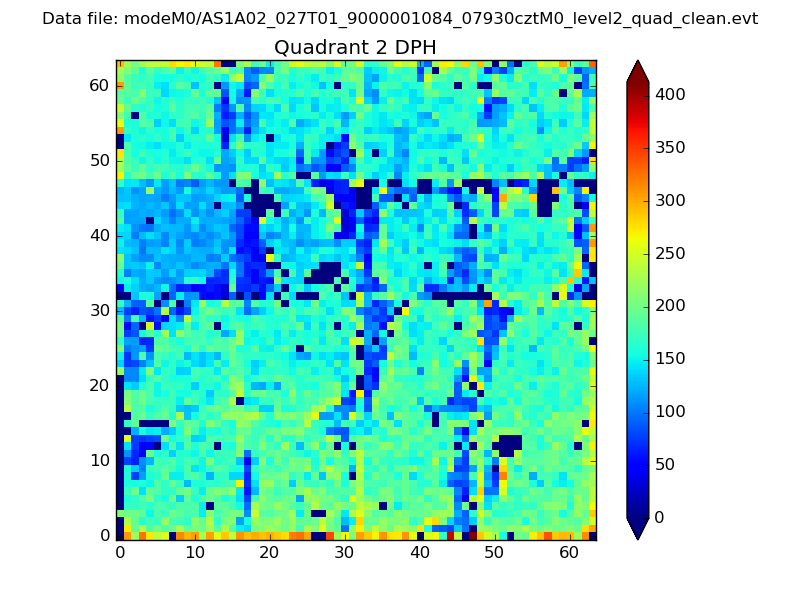
Histogram calculated using DETX and DETY for each event in the final _common_clean file
| Quadrant A | 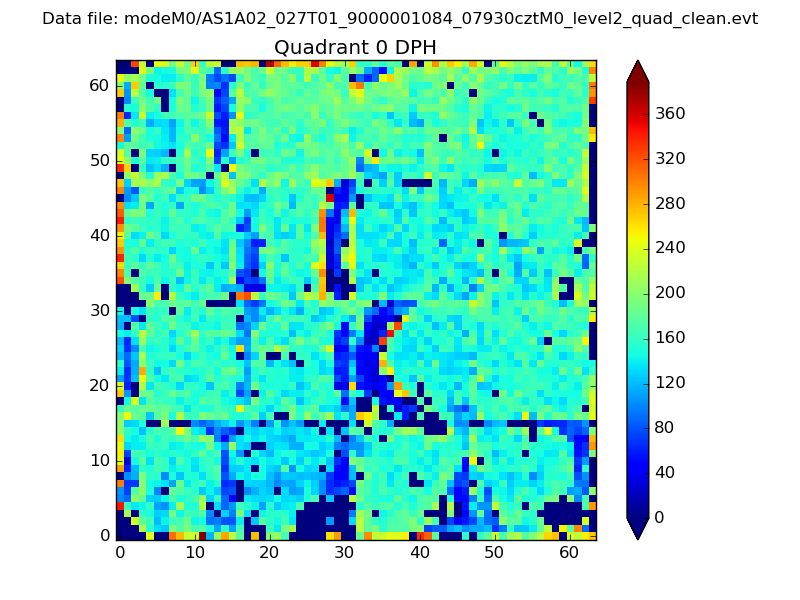 |
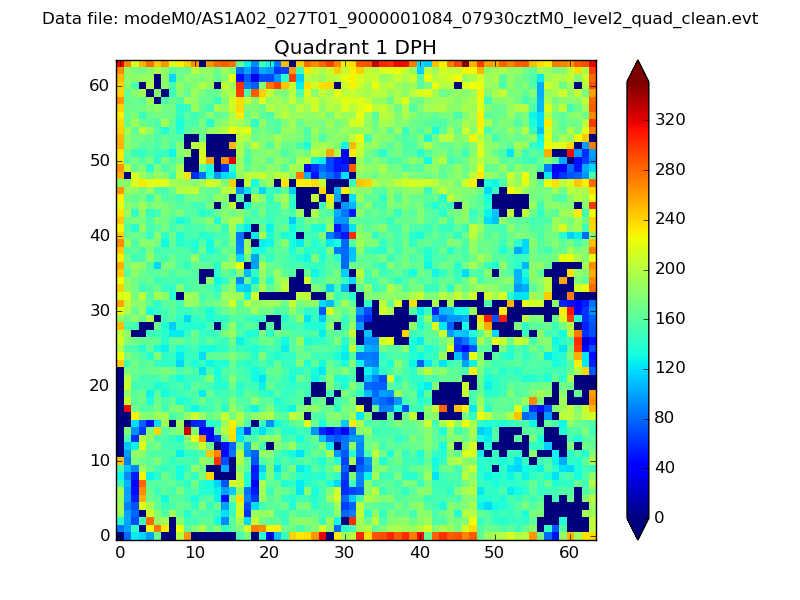 |
Quadrant B |
|---|---|---|---|
| Quadrant D | 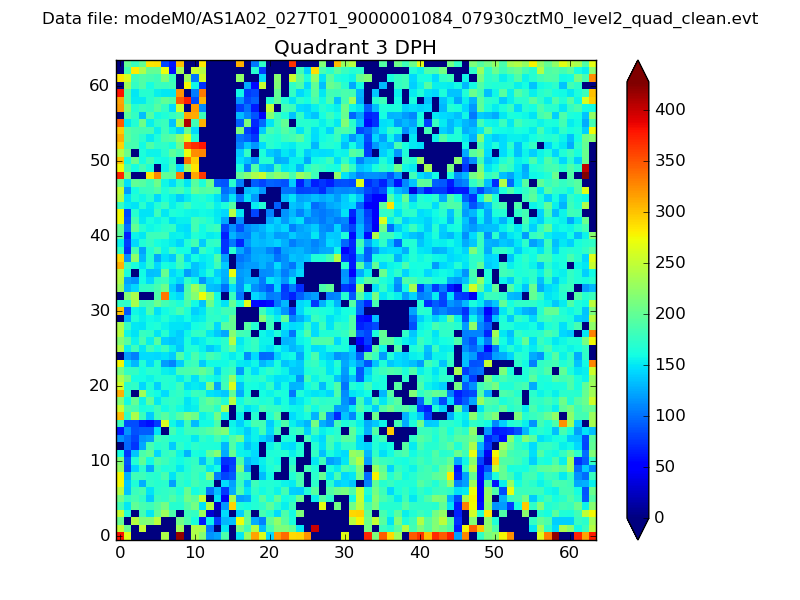 |
 |
Quadrant C |
| Plot type | Count rate plots | Images |
|---|---|---|
| Comparison with Poisson distribution Blue bars denote a histogram of data divided into 1 sec bins. Red curve is a Poisson curve with rate = median count rate of data. |
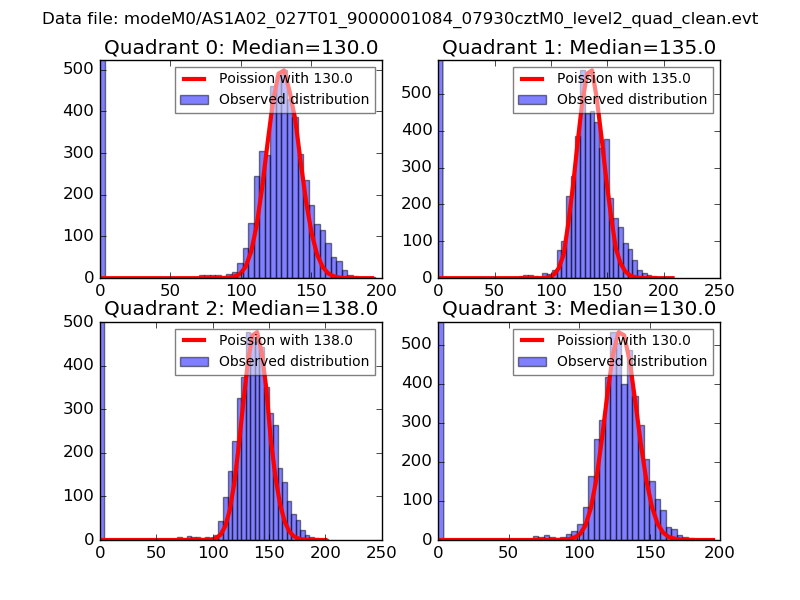 |
 |
| Quadrant-wise count rates Data is divided into 100 sec bins |
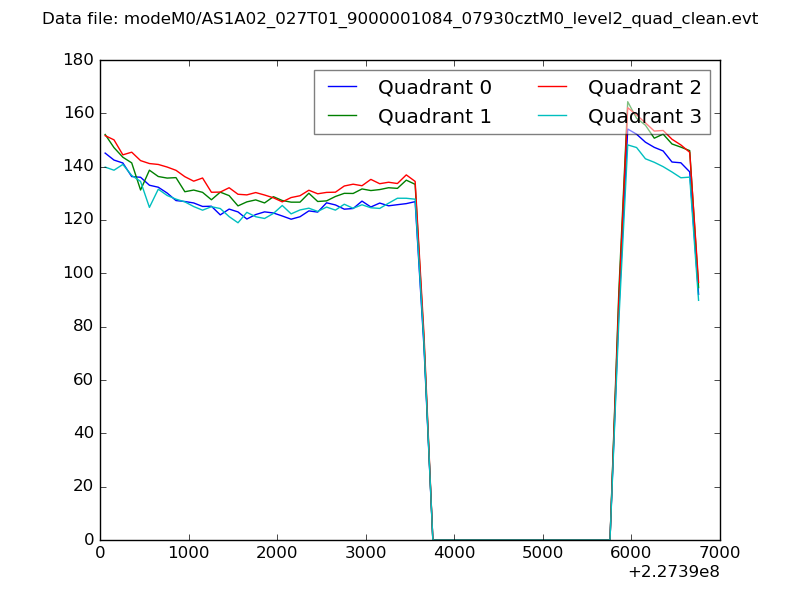 |
|
| Module-wise count rates for Quadrant A Data is divided into 100 sec bins |
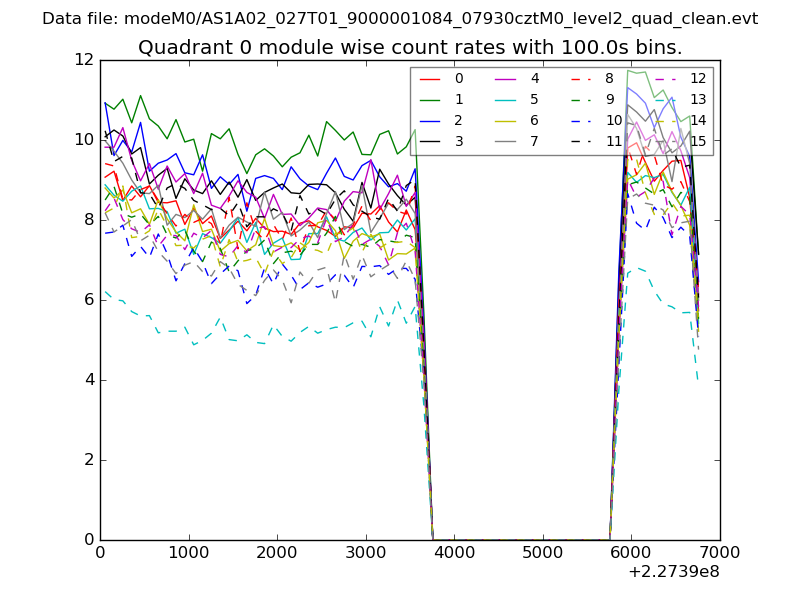 |
 |
| Module-wise count rates for Quadrant B Data is divided into 100 sec bins |
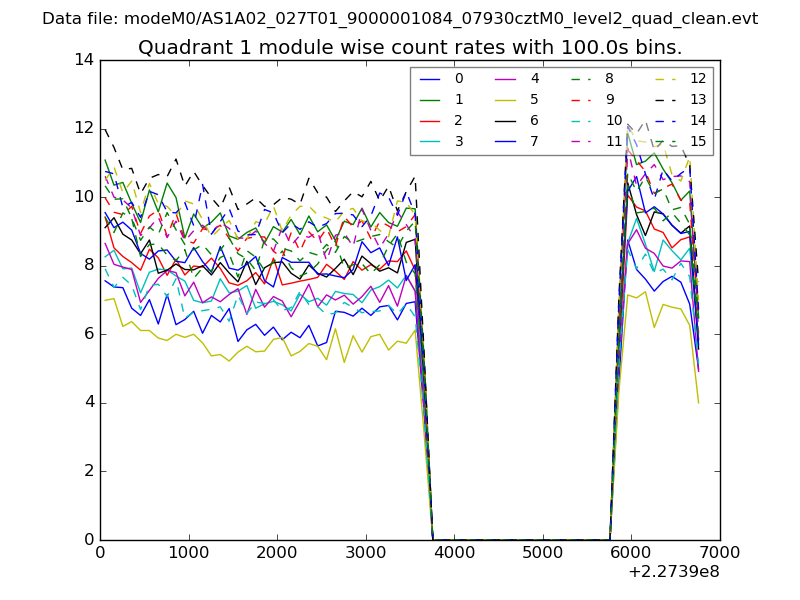 |
 |
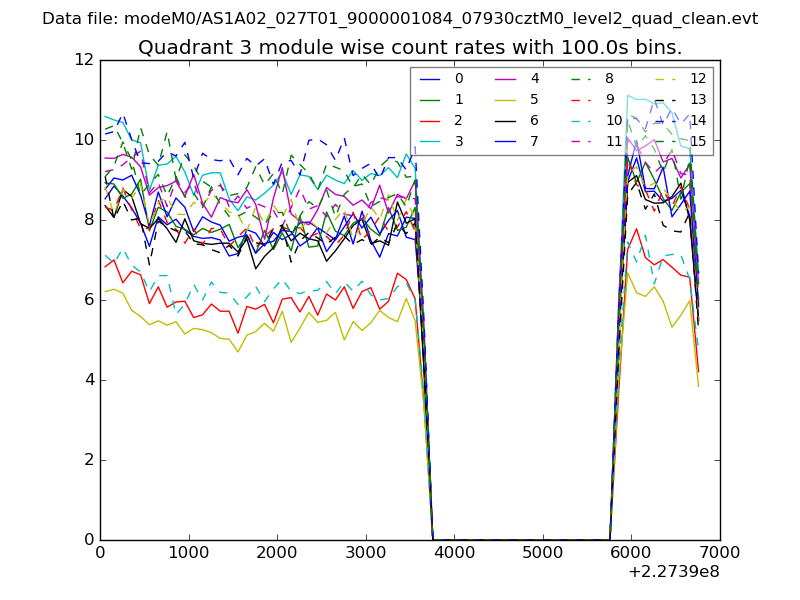
| Module-wise count rates for Quadrant C Data is divided into 100 sec bins |
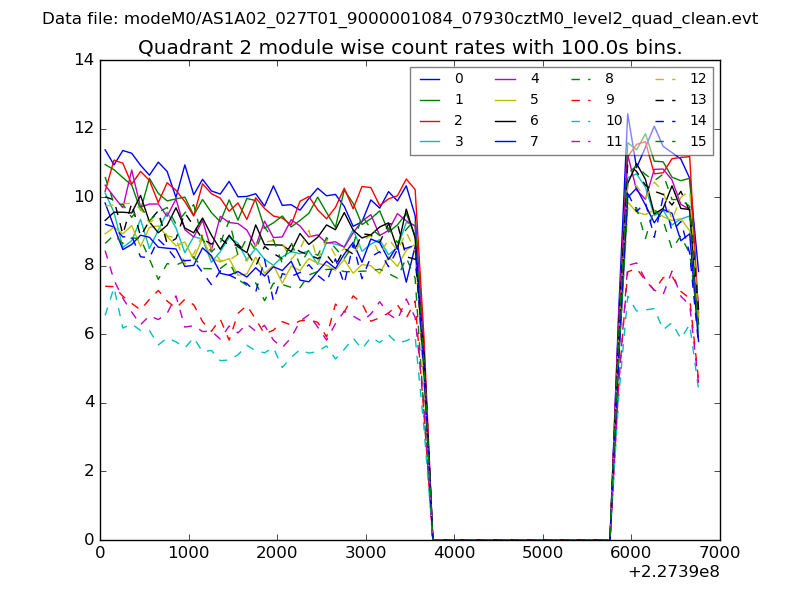 |
 |
| Module-wise count rates for Quadrant D Data is divided into 100 sec bins |
 |
 |
| Parameter | Plot |
|---|---|
| CZT HV Monitor | 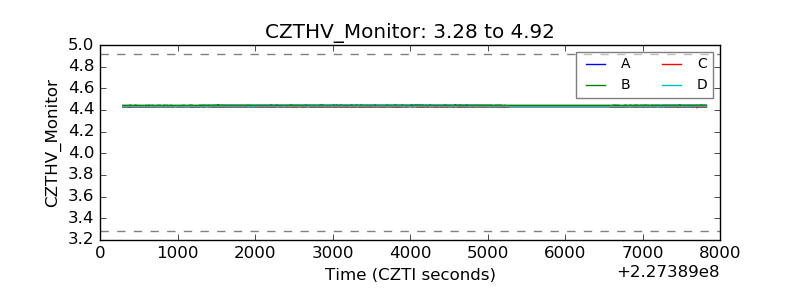 |
| D_VDD | 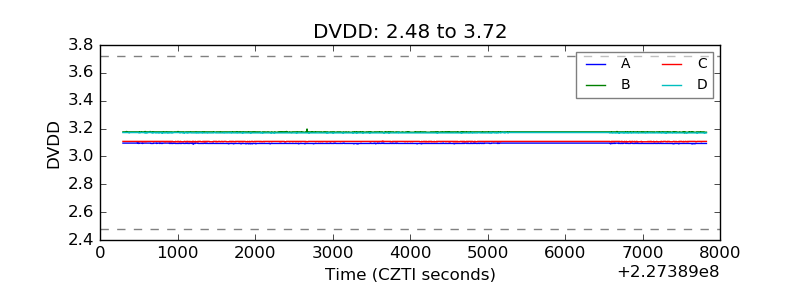 |
| Temperature 1 | 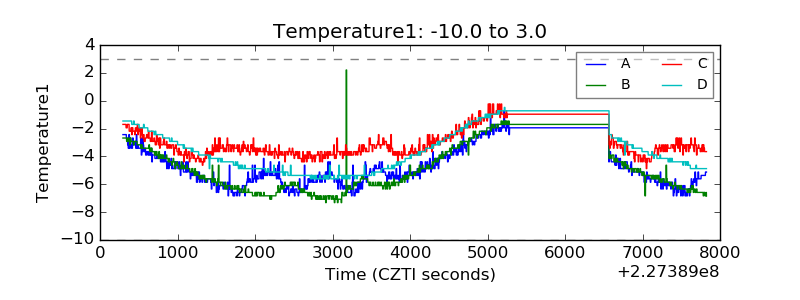 |
| Veto HV Monitor | 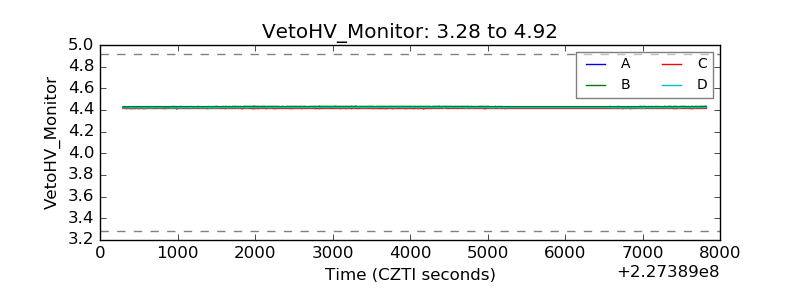 |
| Veto LLD | 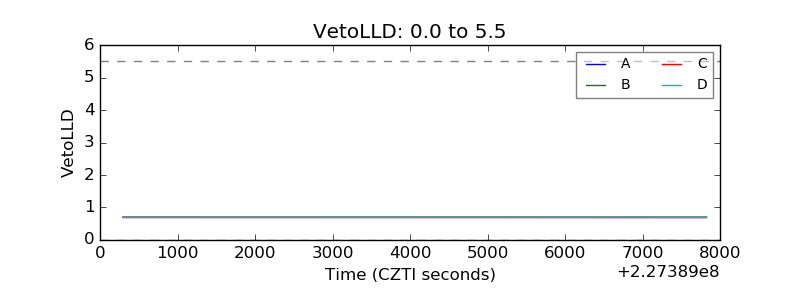 |
| Alpha Counter | 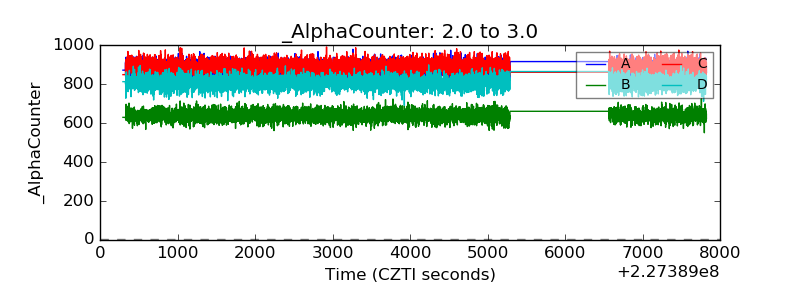 |
| _CPM_Rate | 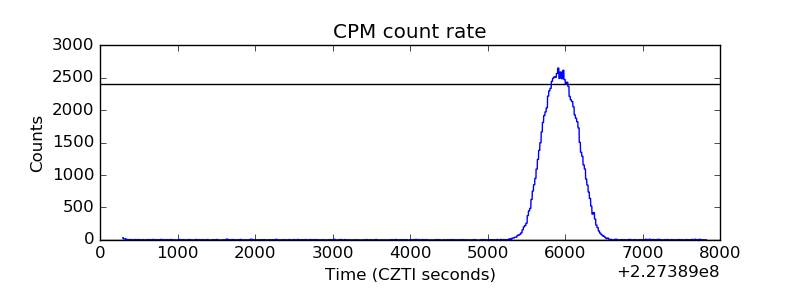 |
| CZT Counter | 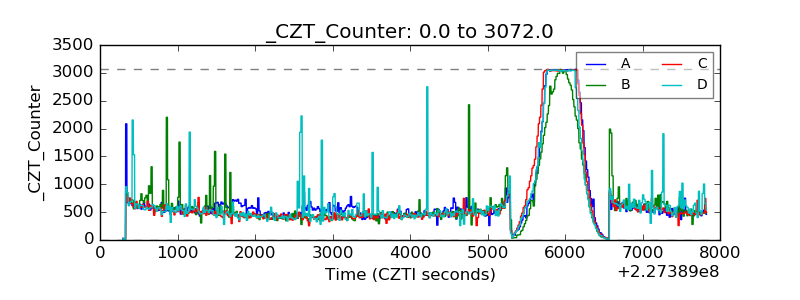 |
| +2.5 Volts monitor |  |
| +5 Volts monitor | 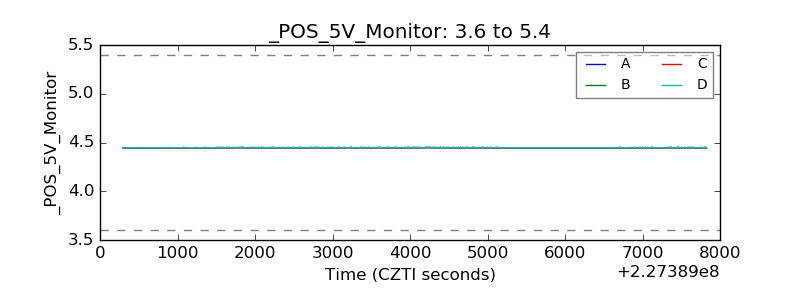 |
| _ROLL_ROT | 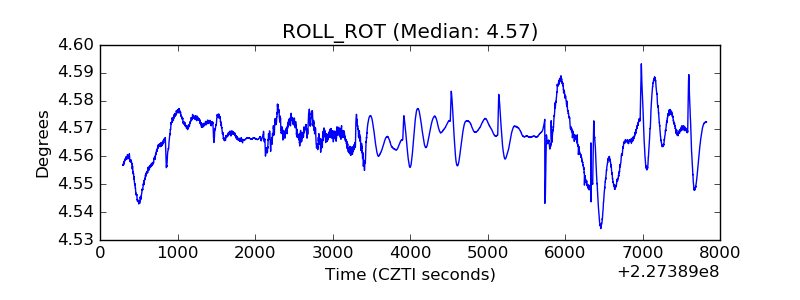 |
| _Roll_DEC | 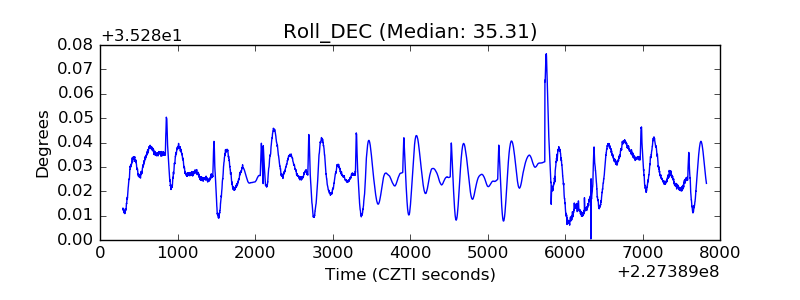 |
| _Roll_RA | 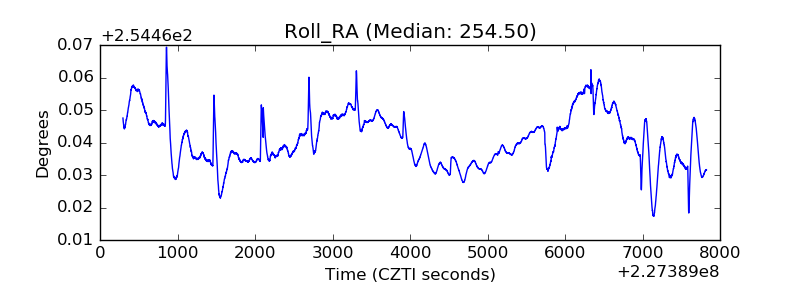 |
| Veto Counter | 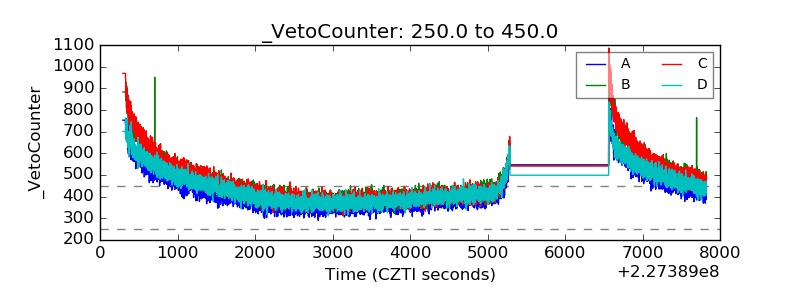 |