| Param | Original file | Final file |
|---|---|---|
| Filename | modeM0/AS1A02_027T01_9000001084_07931cztM0_level2.evt | modeM0/AS1A02_027T01_9000001084_07931cztM0_level2_quad_clean.evt |
| Size (bytes) | 392,339,520 | 90,855,360 |
| Size | 374.2 MB | 86.6 MB |
| Events in quadrant A | 2,697,096 | 578,649 |
| Events in quadrant B | 2,957,011 | 605,817 |
| Events in quadrant C | 2,711,618 | 609,308 |
| Events in quadrant D | 3,138,022 | 568,801 |
| Mode SS | |||
|---|---|---|---|
| Quadrant | BADHDUFLAG | Total packets | Discarded packets |
| A | 0 | 112 | 0 |
| B | 0 | 112 | 0 |
| C | 0 | 112 | 0 |
| D | 0 | 112 | 0 |
| Mode M0 | |||
|---|---|---|---|
| Quadrant | BADHDUFLAG | Total packets | Discarded packets |
| A | 0 | 11706 | 2 |
| B | 0 | 12569 | 2 |
| C | 0 | 11727 | 2 |
| D | 0 | 13164 | 2 |
| Mode M9 | |||
|---|---|---|---|
| Quadrant | BADHDUFLAG | Total packets | Discarded packets |
| A | 0 | 15 | 0 |
| B | 0 | 15 | 0 |
| C | 0 | 15 | 0 |
| D | 0 | 16 | 0 |
| Quadrant | Total seconds | Saturated seconds | Saturation percentage |
|---|---|---|---|
| A | 5563 | 25 | 0.449398% |
| B | 5563 | 89 | 1.599856% |
| C | 5563 | 26 | 0.467374% |
| D | 5563 | 58 | 1.042603% |
Noise dominated data is calculated using 1-second bins in cleaned event files. If a bin has >2000 counts, and if more than 50% of those come from <1% of pixels, then it is considered to be noise-dominated and hence unusable.
| Quadrant | # 1 sec bins | Bins with >0 counts | Bins with >2000 counts | High rate bins dominated by noise | Noise dominated (total time) | Noise dominated (detector-on time) | Marked lightcurve |
|---|---|---|---|---|---|---|---|
| A | 6903 | 5564 | 1 | 1 | 0.01% | 0.02% | 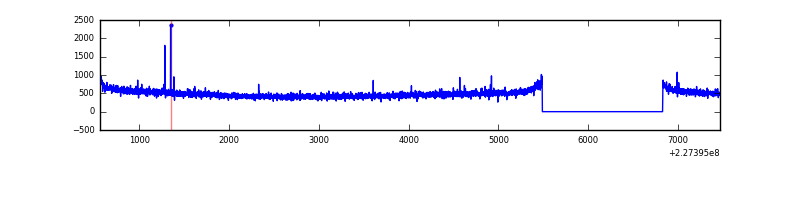 |
| B | 6903 | 5564 | 20 | 20 | 0.29% | 0.36% | 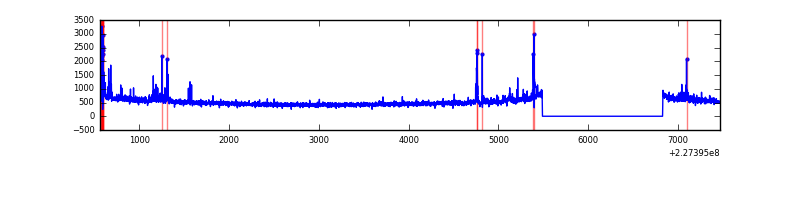 |
| C | 6903 | 5564 | 0 | 0 | 0.00% | 0.00% | 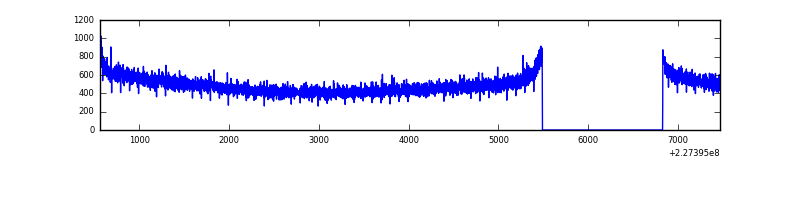 |
| D | 6903 | 5564 | 23 | 23 | 0.33% | 0.41% | 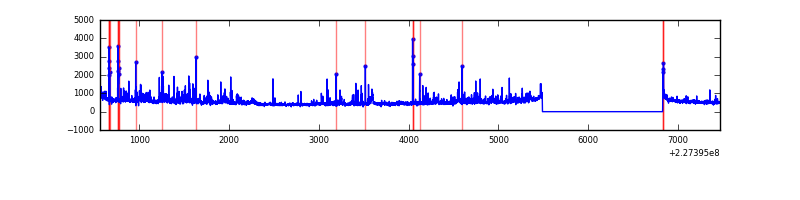 |
Top three noisy pixels from each quadrant. If the there are fewer than three noisy pixels in the level2.evt file, extra rows are filled as -1
| Pixel properties | Quadrant properties | ||||||
|---|---|---|---|---|---|---|---|
| Quadrant | DetID | PixID | Counts | Sigma | Mean | Median | Sigma |
| A | 15 | 223 | 10805 | 71.17 | 697 | 684 | 142.2 |
| A | 0 | 226 | 6536 | 41.15 | 697 | 684 | 142.2 |
| A | 12 | 194 | 6159 | 38.5 | 697 | 684 | 142.2 |
| B | 4 | 239 | 123915 | 934.16 | 706 | 690 | 131.9 |
| B | 11 | 51 | 27051 | 199.84 | 706 | 690 | 131.9 |
| B | 0 | 214 | 20896 | 153.18 | 706 | 690 | 131.9 |
| C | 13 | 61 | 5262 | 28.51 | 694 | 699 | 160.1 |
| C | 1 | 16 | 4731 | 25.19 | 694 | 699 | 160.1 |
| C | 14 | 67 | 1803 | 6.9 | 694 | 699 | 160.1 |
| D | 5 | 233 | 178140 | 1064.53 | 682 | 662 | 166.7 |
| D | 1 | 52 | 127595 | 761.35 | 682 | 662 | 166.7 |
| D | 2 | 152 | 61520 | 365.03 | 682 | 662 | 166.7 |
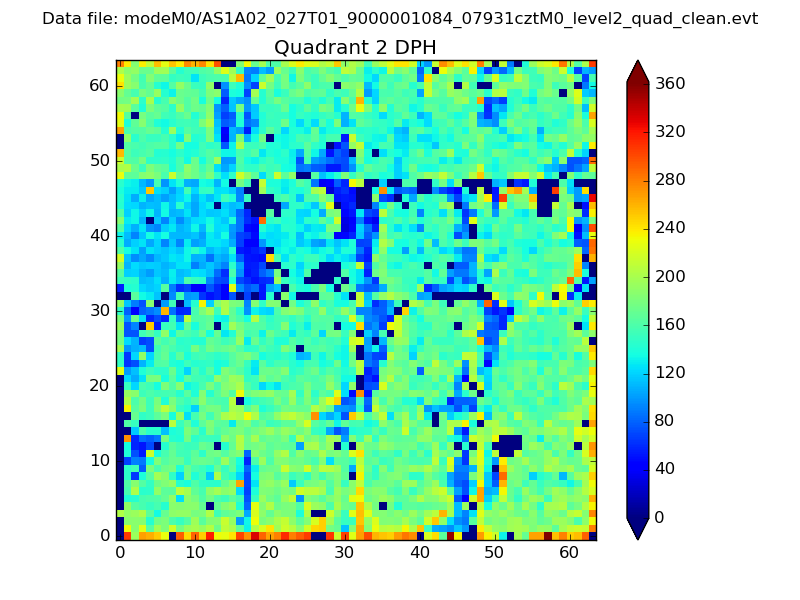
Histogram calculated using DETX and DETY for each event in the final _common_clean file
| Quadrant A | 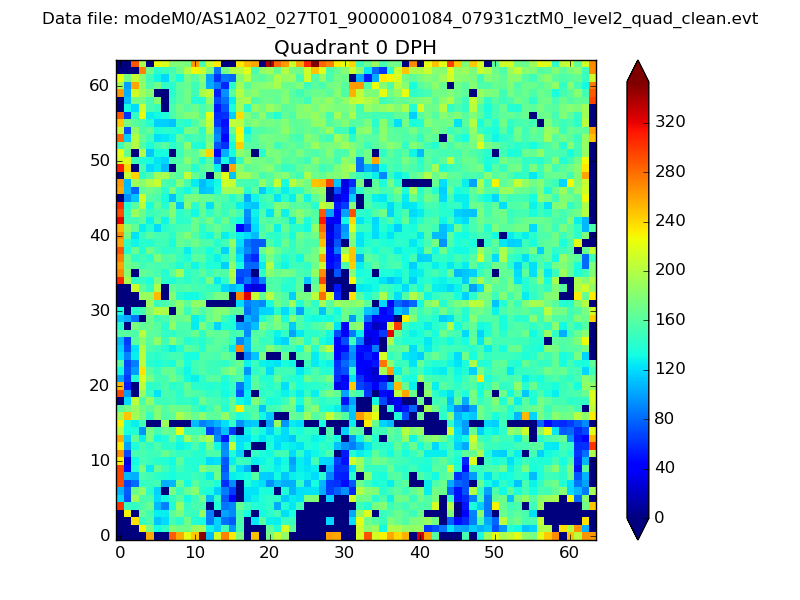 |
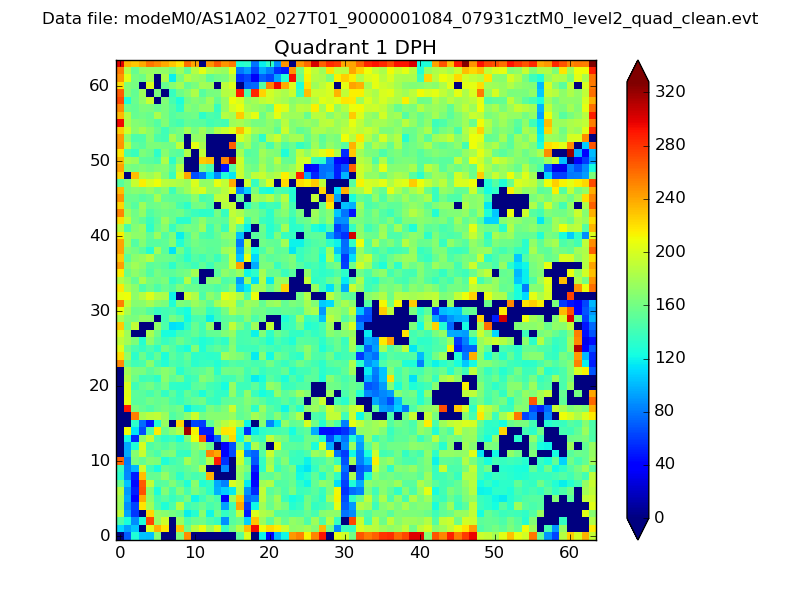 |
Quadrant B |
|---|---|---|---|
| Quadrant D | 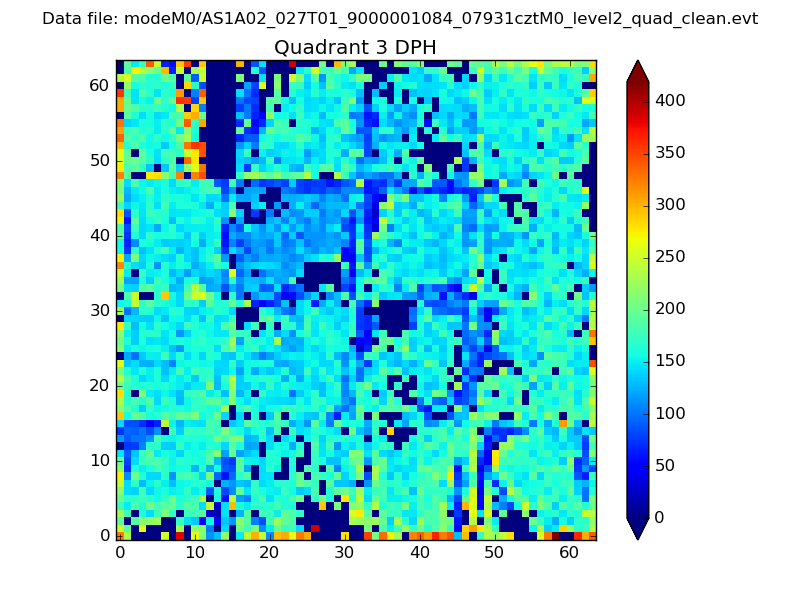 |
 |
Quadrant C |
| Plot type | Count rate plots | Images |
|---|---|---|
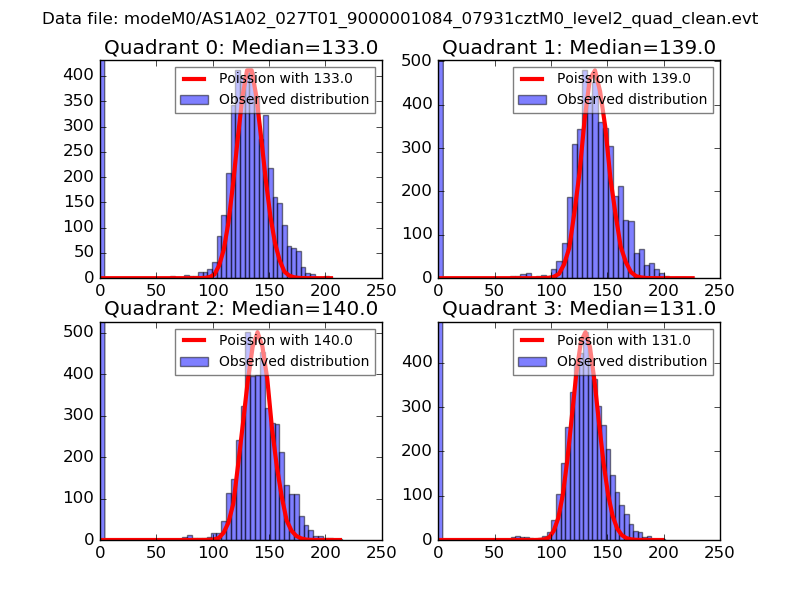
| Comparison with Poisson distribution Blue bars denote a histogram of data divided into 1 sec bins. Red curve is a Poisson curve with rate = median count rate of data. |
 |
 |
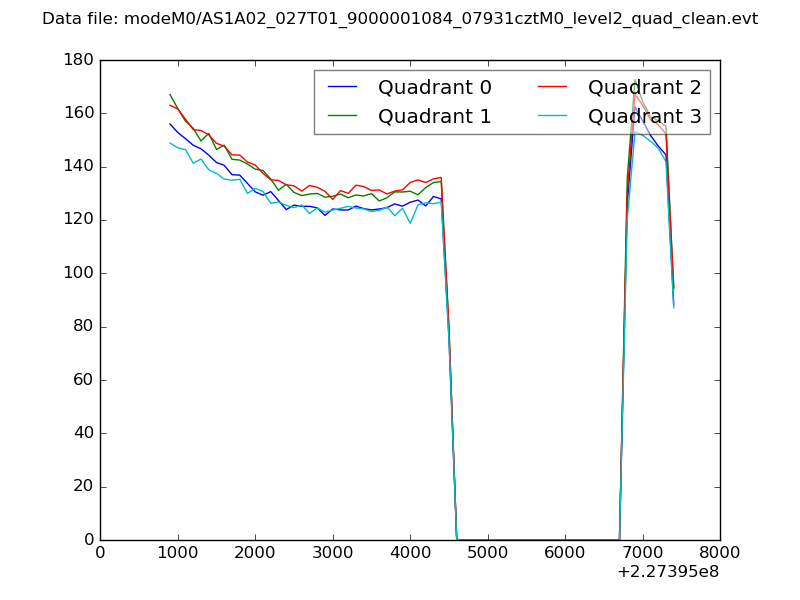
| Quadrant-wise count rates Data is divided into 100 sec bins |
 |
|
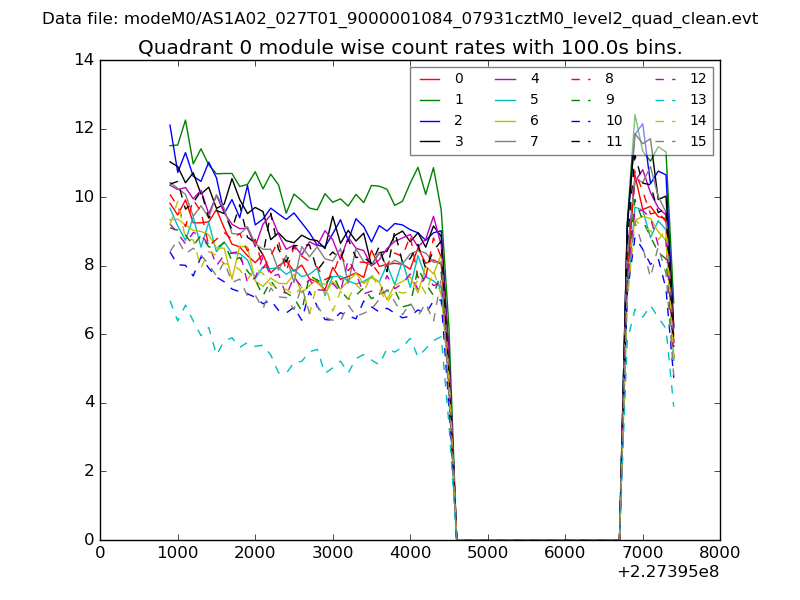
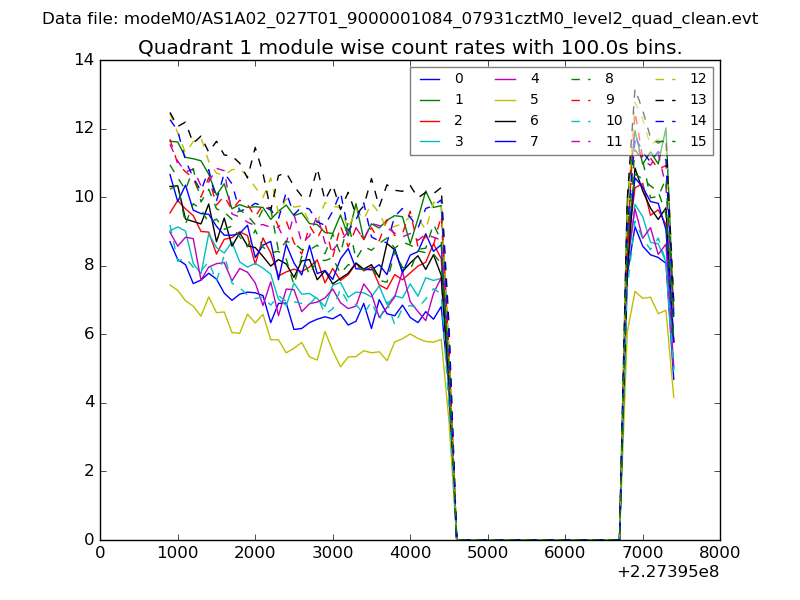
| Module-wise count rates for Quadrant A Data is divided into 100 sec bins |
 |
 |
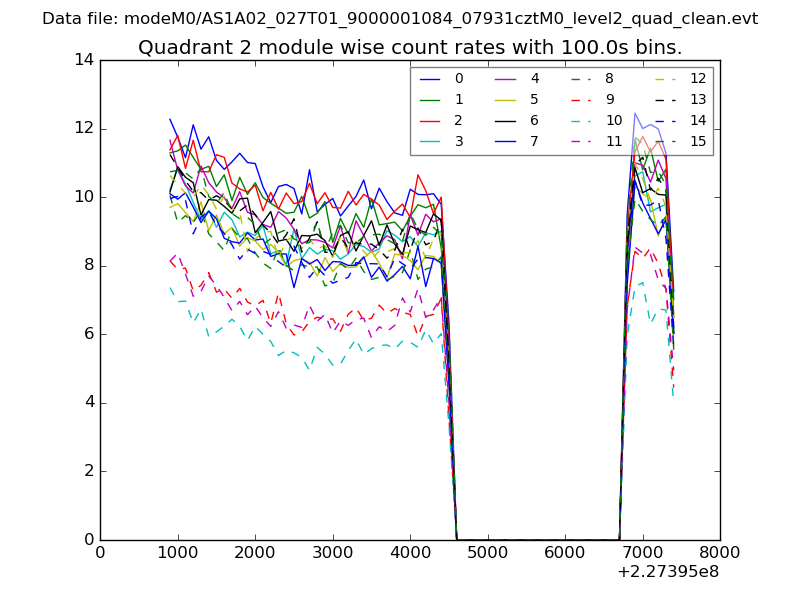
| Module-wise count rates for Quadrant B Data is divided into 100 sec bins |
 |
 |
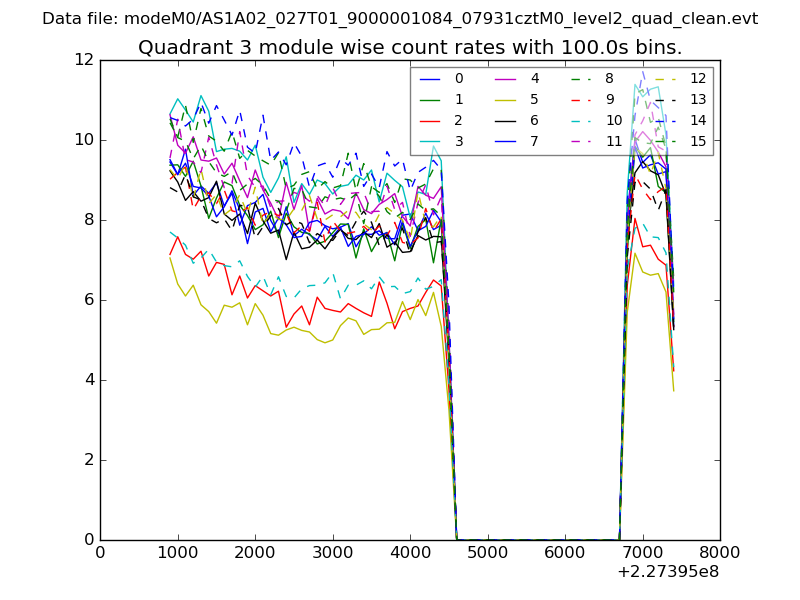
| Module-wise count rates for Quadrant C Data is divided into 100 sec bins |
 |
 |
| Module-wise count rates for Quadrant D Data is divided into 100 sec bins |
 |
 |
| Parameter | Plot |
|---|---|
| CZT HV Monitor | 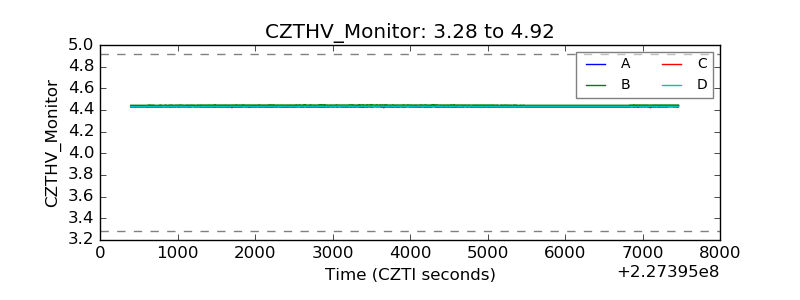 |
| D_VDD | 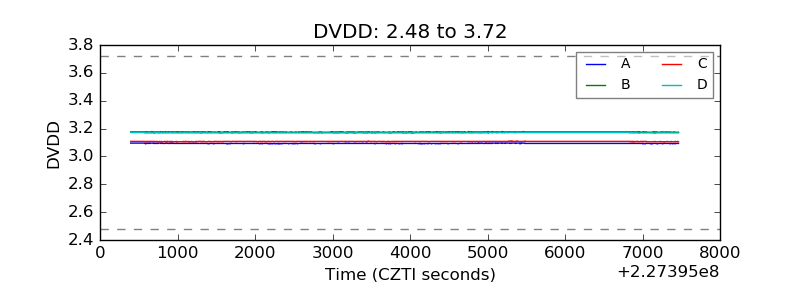 |
| Temperature 1 | 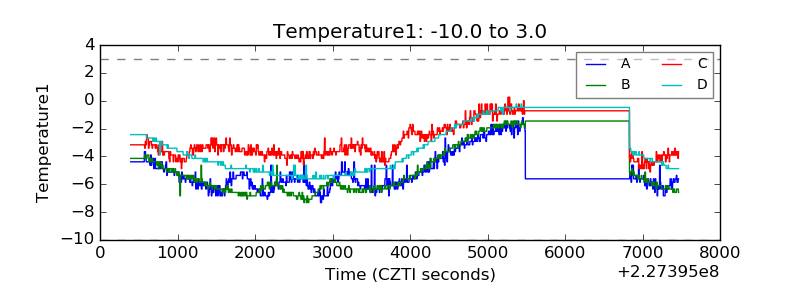 |
| Veto HV Monitor | 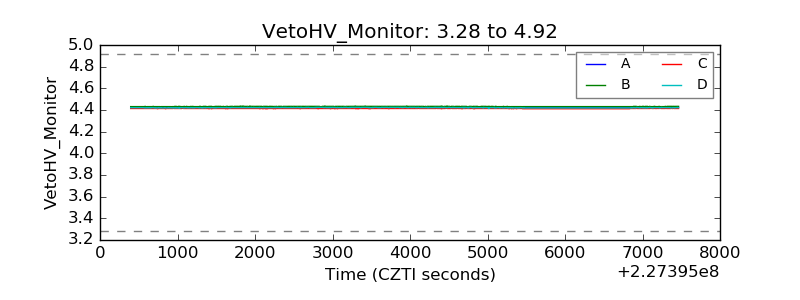 |
| Veto LLD | 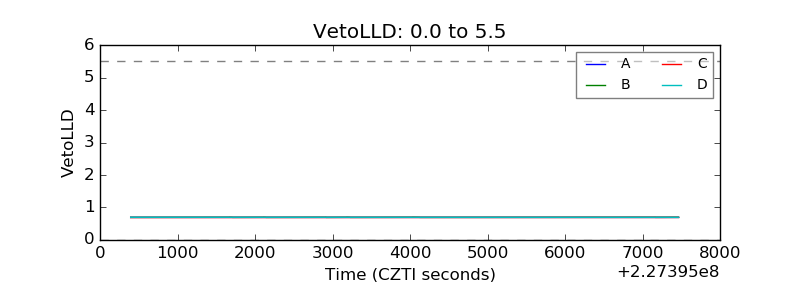 |
| Alpha Counter | 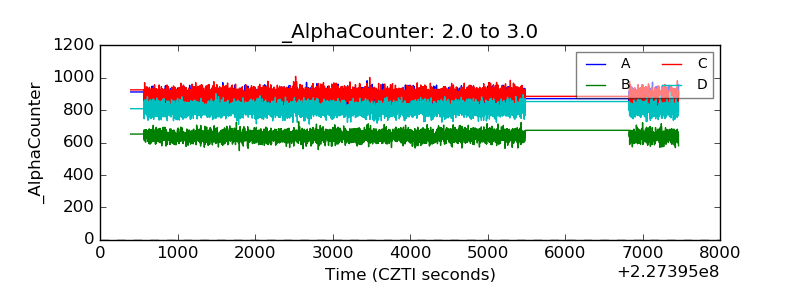 |
| _CPM_Rate | 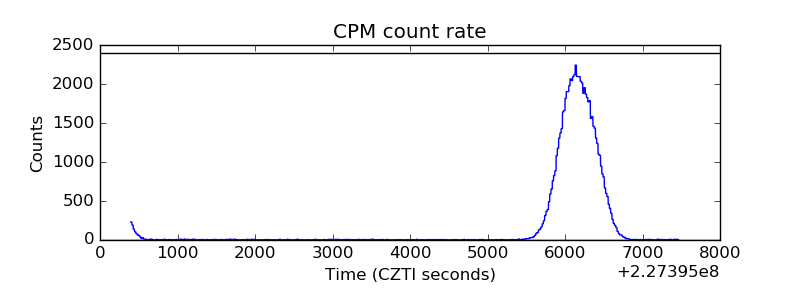 |
| CZT Counter | 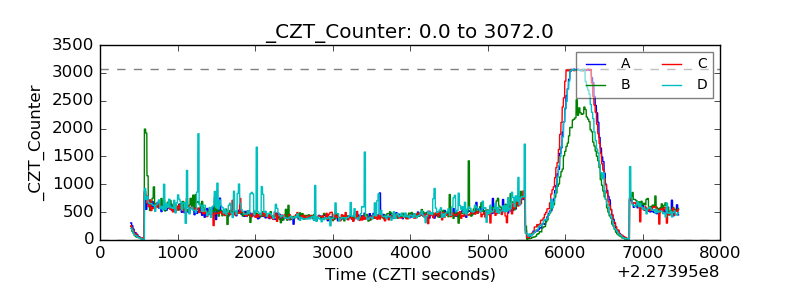 |
| +2.5 Volts monitor |  |
| +5 Volts monitor |  |
| _ROLL_ROT | 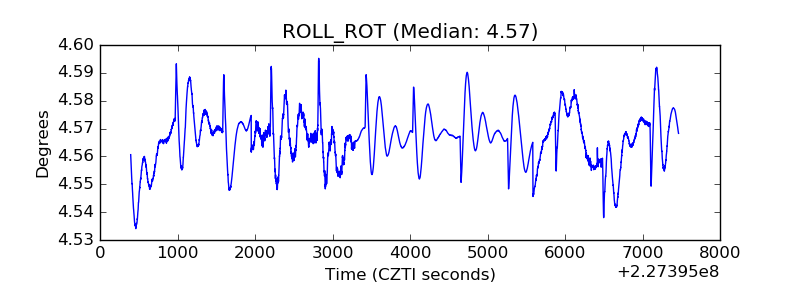 |
| _Roll_DEC | 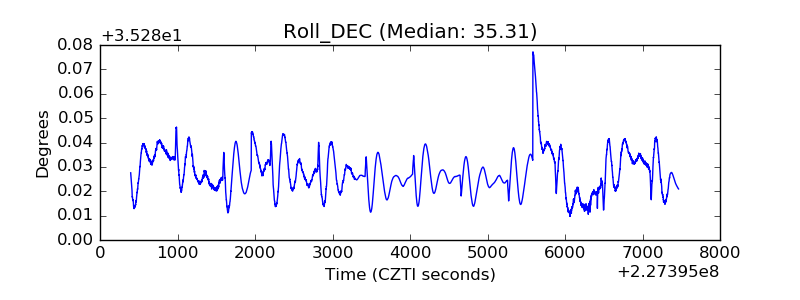 |
| _Roll_RA | 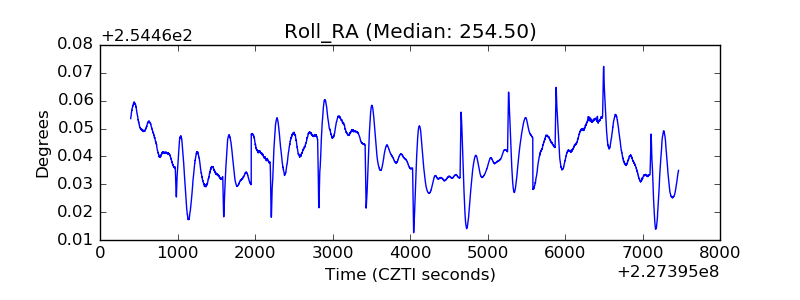 |
| Veto Counter | 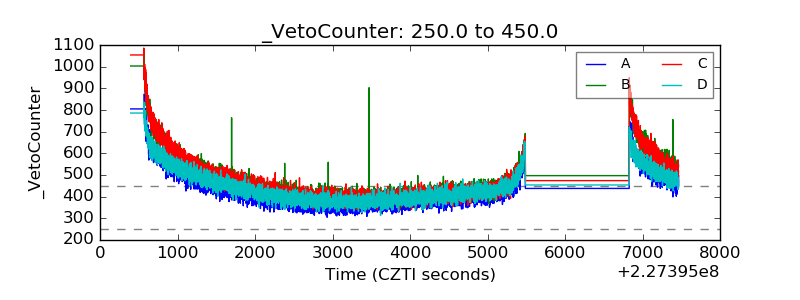 |