| Param | Original file | Final file |
|---|---|---|
| Filename | modeM0/AS1A02_027T01_9000001084_07932cztM0_level2.evt | modeM0/AS1A02_027T01_9000001084_07932cztM0_level2_quad_clean.evt |
| Size (bytes) | 50,155,200 | 14,915,520 |
| Size | 47.8 MB | 14.2 MB |
| Events in quadrant A | 348,738 | 98,061 |
| Events in quadrant B | 394,141 | 103,805 |
| Events in quadrant C | 357,607 | 102,060 |
| Events in quadrant D | 371,890 | 95,194 |
| Mode SS | |||
|---|---|---|---|
| Quadrant | BADHDUFLAG | Total packets | Discarded packets |
| A | 0 | 12 | 0 |
| B | 0 | 12 | 0 |
| C | 0 | 12 | 0 |
| D | 0 | 12 | 0 |
| Mode M0 | |||
|---|---|---|---|
| Quadrant | BADHDUFLAG | Total packets | Discarded packets |
| A | 0 | 1408 | 1 |
| B | 0 | 1610 | 1 |
| C | 0 | 1432 | 1 |
| D | 0 | 1490 | 1 |
| Mode M9 | |||
|---|---|---|---|
| Quadrant | BADHDUFLAG | Total packets | Discarded packets |
| A | 0 | 4 | 0 |
| B | 0 | 4 | 0 |
| C | 0 | 4 | 0 |
| D | 0 | 5 | 0 |
| Quadrant | Total seconds | Saturated seconds | Saturation percentage |
|---|---|---|---|
| A | 638 | 2 | 0.313480% |
| B | 638 | 3 | 0.470219% |
| C | 638 | 1 | 0.156740% |
| D | 638 | 6 | 0.940439% |
Noise dominated data is calculated using 1-second bins in cleaned event files. If a bin has >2000 counts, and if more than 50% of those come from <1% of pixels, then it is considered to be noise-dominated and hence unusable.
| Quadrant | # 1 sec bins | Bins with >0 counts | Bins with >2000 counts | High rate bins dominated by noise | Noise dominated (total time) | Noise dominated (detector-on time) | Marked lightcurve |
|---|---|---|---|---|---|---|---|
| A | 638 | 638 | 0 | 0 | 0.00% | 0.00% | 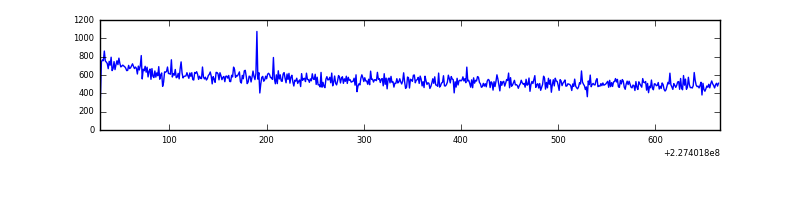 |
| B | 638 | 638 | 1 | 1 | 0.16% | 0.16% | 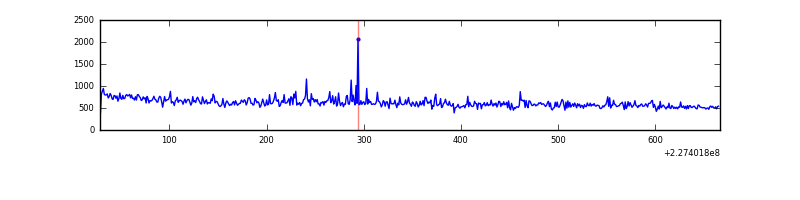 |
| C | 638 | 638 | 0 | 0 | 0.00% | 0.00% | 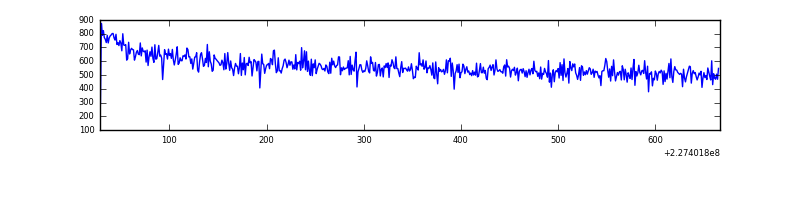 |
| D | 638 | 638 | 3 | 3 | 0.47% | 0.47% | 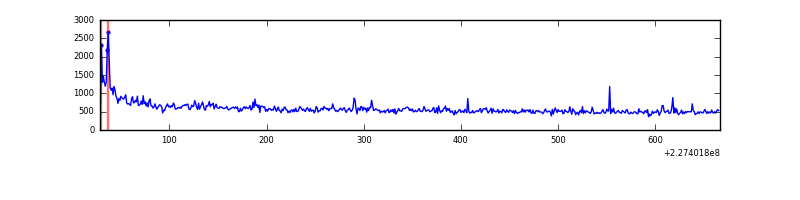 |
Top three noisy pixels from each quadrant. If the there are fewer than three noisy pixels in the level2.evt file, extra rows are filled as -1
| Pixel properties | Quadrant properties | ||||||
|---|---|---|---|---|---|---|---|
| Quadrant | DetID | PixID | Counts | Sigma | Mean | Median | Sigma |
| A | 0 | 226 | 838 | 36.64 | 90 | 88 | 20.5 |
| A | 12 | 194 | 814 | 35.47 | 90 | 88 | 20.5 |
| A | 15 | 223 | 549 | 22.52 | 90 | 88 | 20.5 |
| B | 11 | 51 | 15801 | 792.96 | 93 | 91 | 19.8 |
| B | 5 | 255 | 5244 | 260.1 | 93 | 91 | 19.8 |
| B | 4 | 239 | 5236 | 259.69 | 93 | 91 | 19.8 |
| C | 1 | 16 | 922 | 36.28 | 91 | 91 | 22.9 |
| C | 13 | 61 | 667 | 25.14 | 91 | 91 | 22.9 |
| C | 8 | 222 | 260 | 7.38 | 91 | 91 | 22.9 |
| D | 12 | 233 | 12666 | 524.67 | 89 | 86 | 24.0 |
| D | 5 | 233 | 6730 | 277.1 | 89 | 86 | 24.0 |
| D | 13 | 104 | 2754 | 111.27 | 89 | 86 | 24.0 |
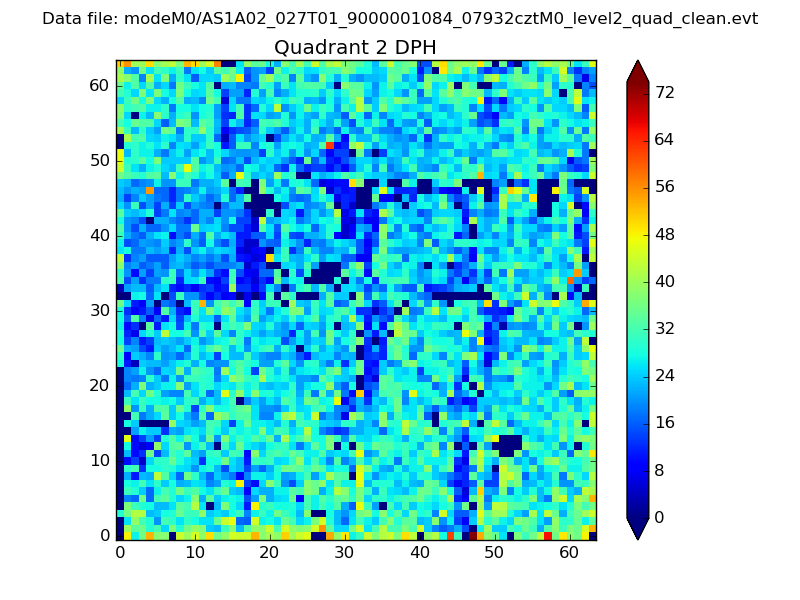
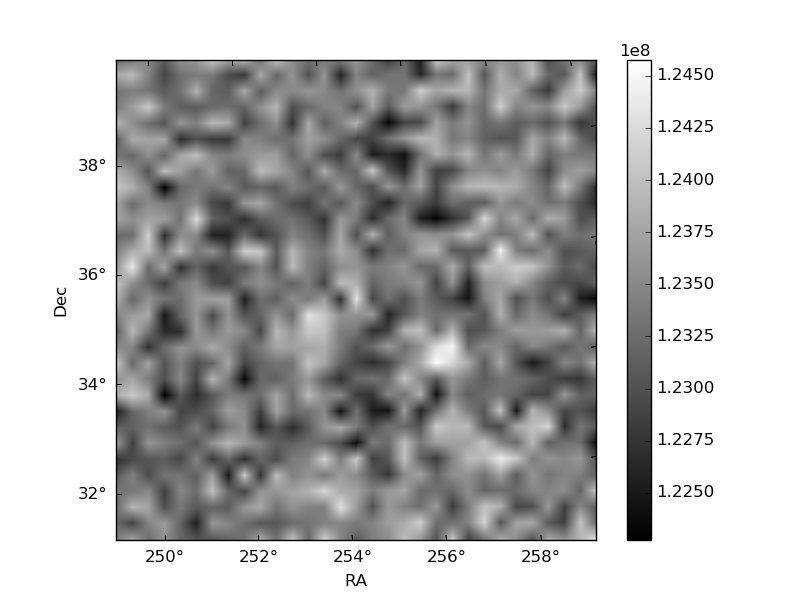
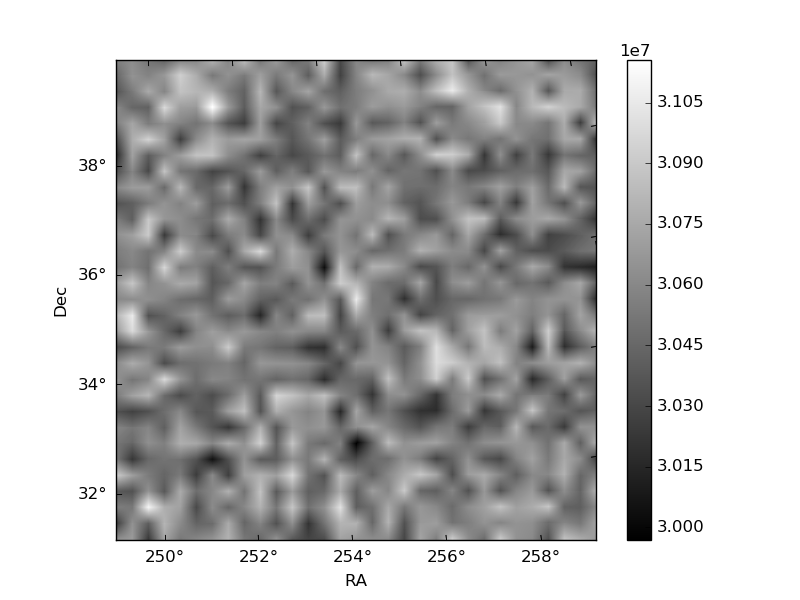
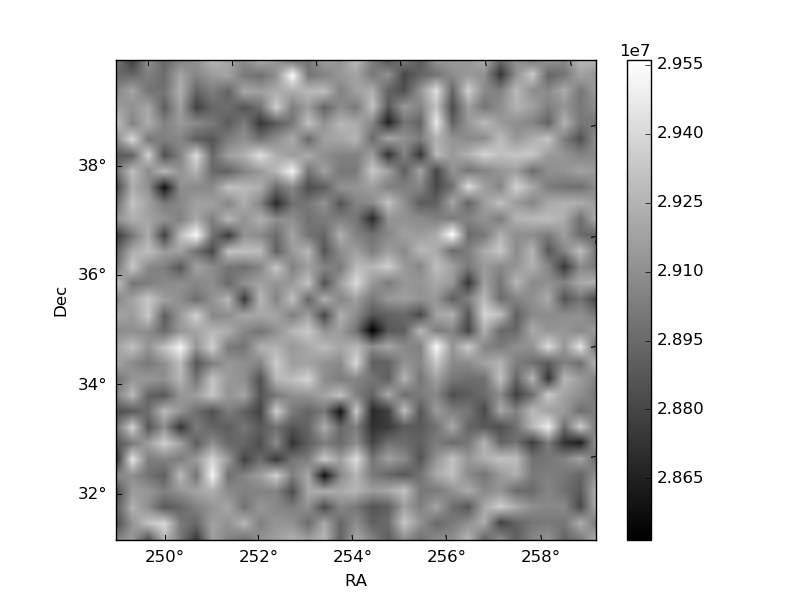
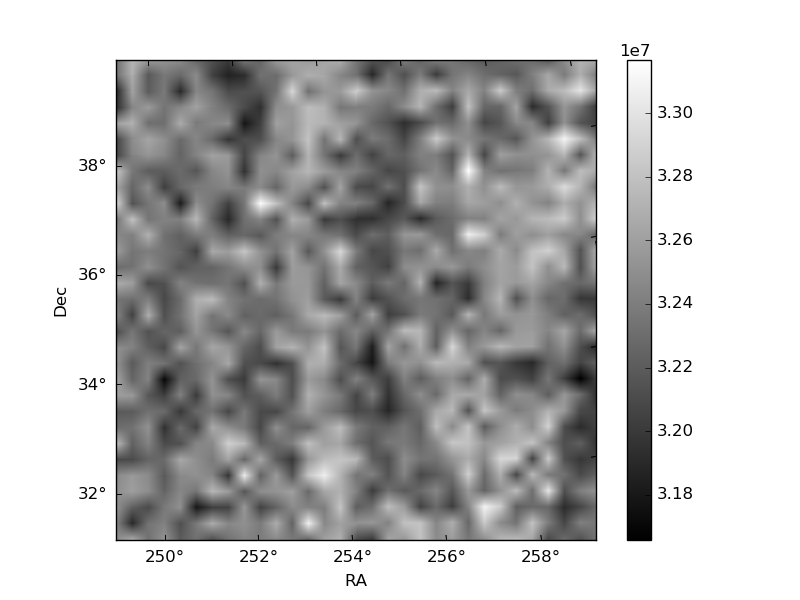
Histogram calculated using DETX and DETY for each event in the final _common_clean file
| Quadrant A | 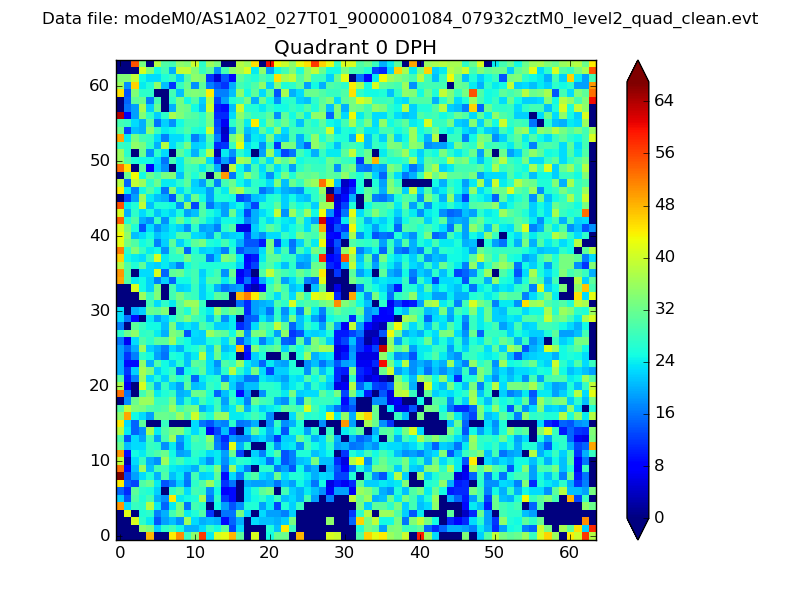 |
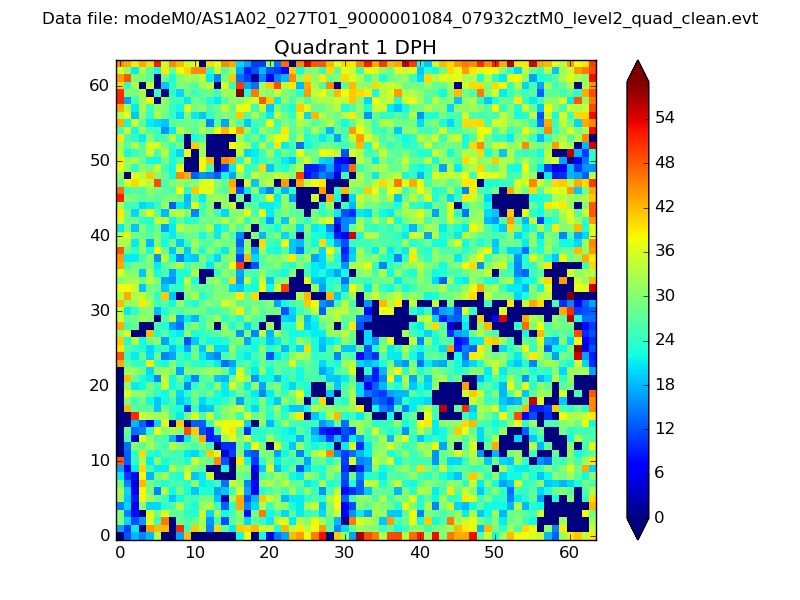 |
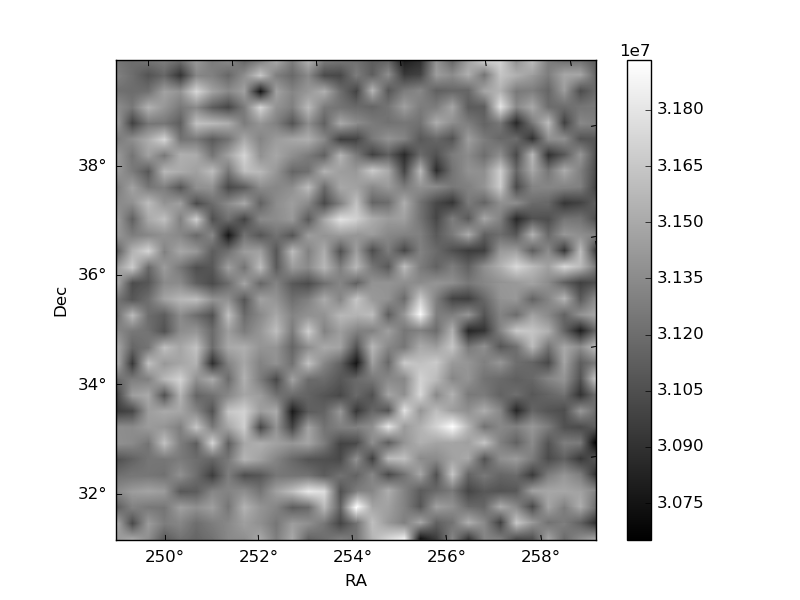
Quadrant B |
|---|---|---|---|
| Quadrant D | 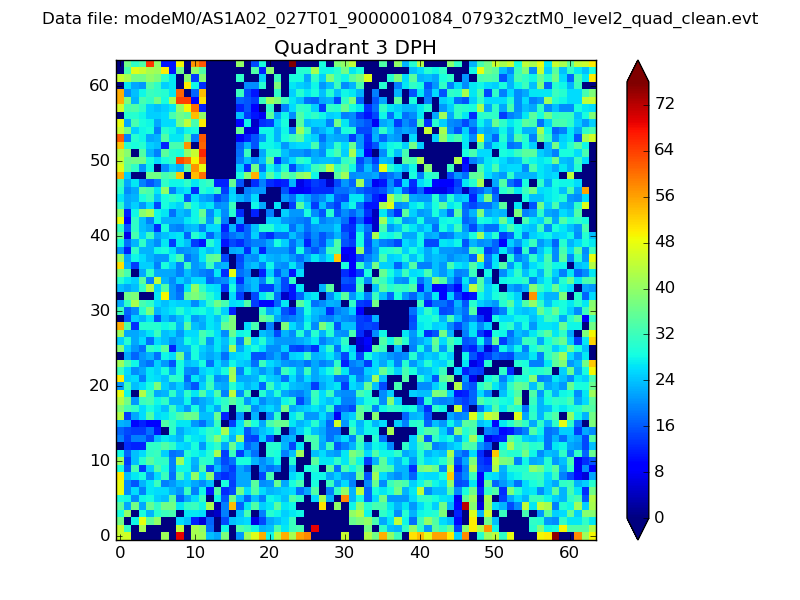 |
 |
Quadrant C |
| Plot type | Count rate plots | Images |
|---|---|---|
| Comparison with Poisson distribution Blue bars denote a histogram of data divided into 1 sec bins. Red curve is a Poisson curve with rate = median count rate of data. |
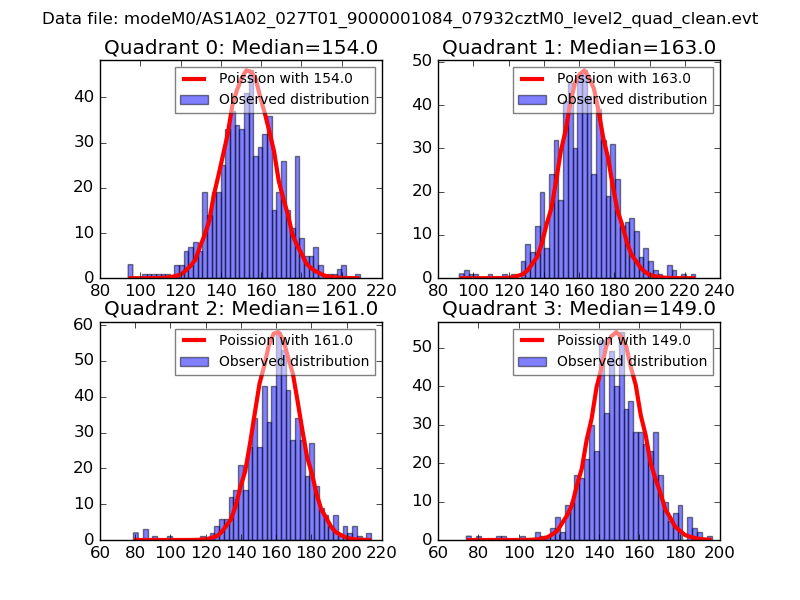 |
 |
| Quadrant-wise count rates Data is divided into 100 sec bins |
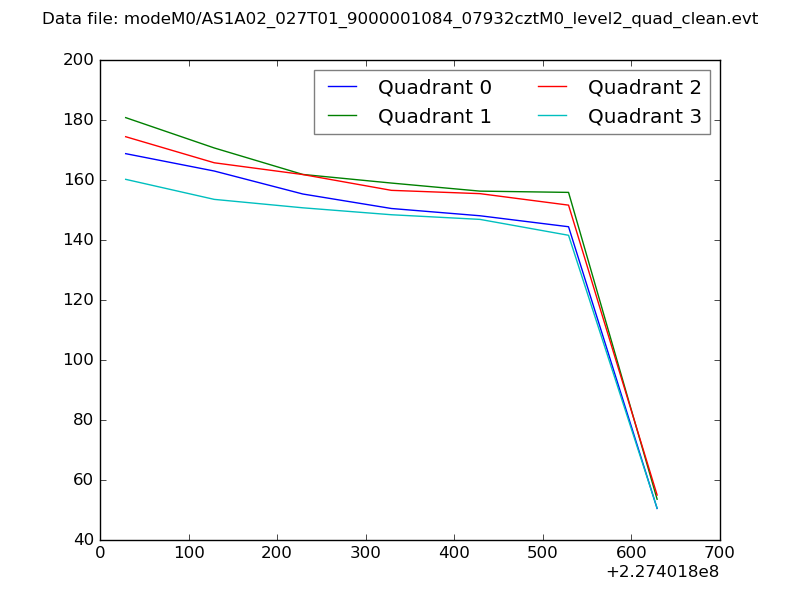 |
|
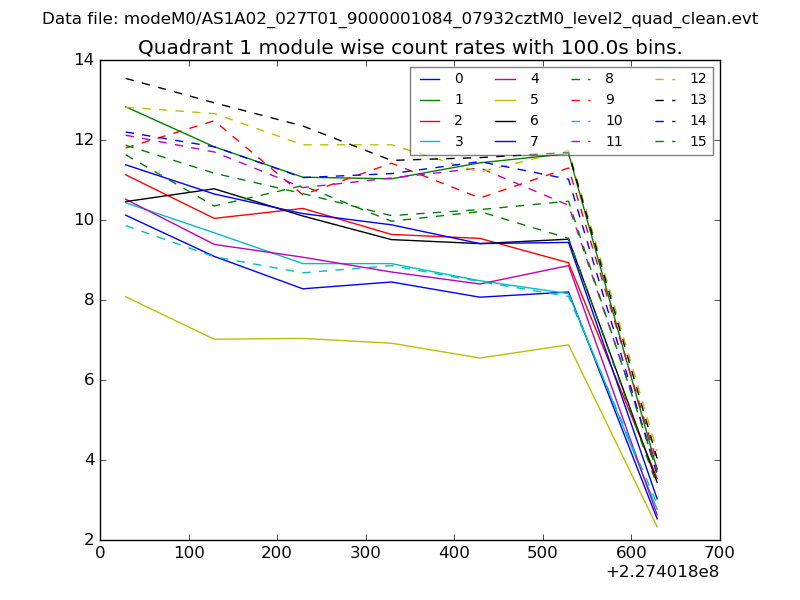
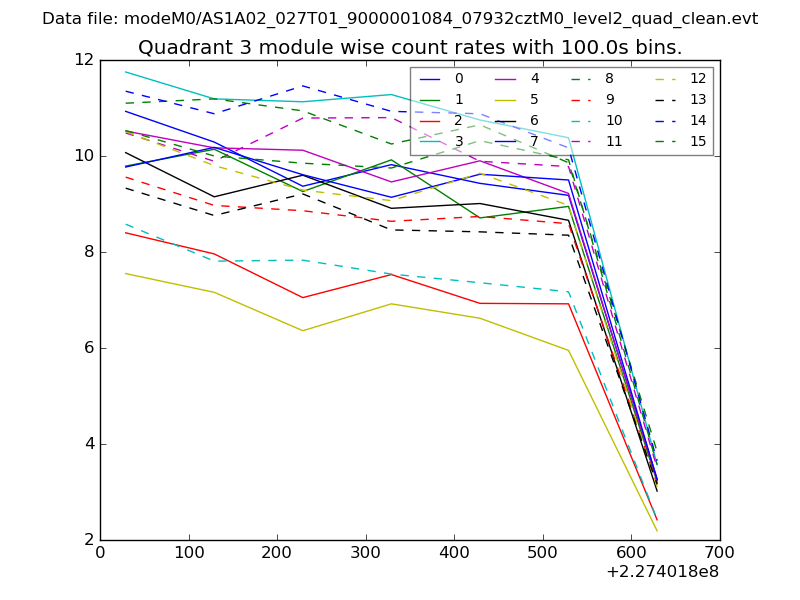
| Module-wise count rates for Quadrant A Data is divided into 100 sec bins |
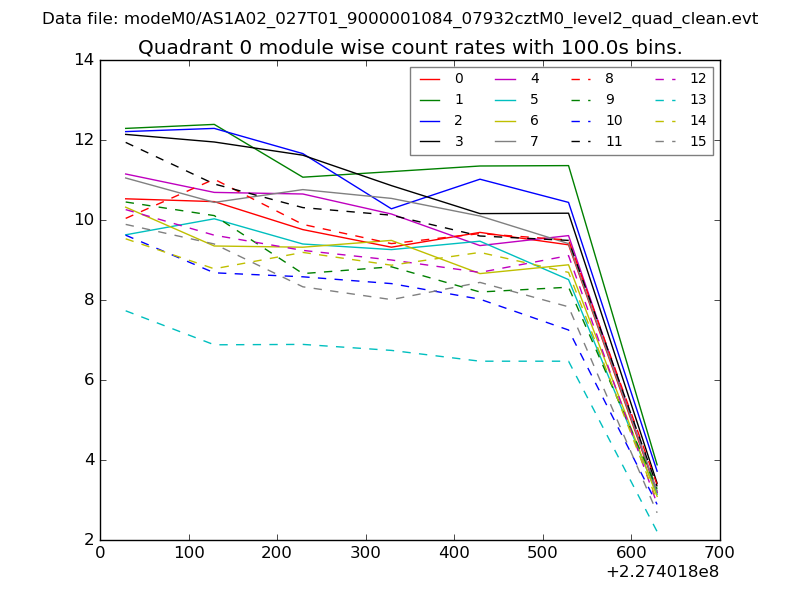 |
 |
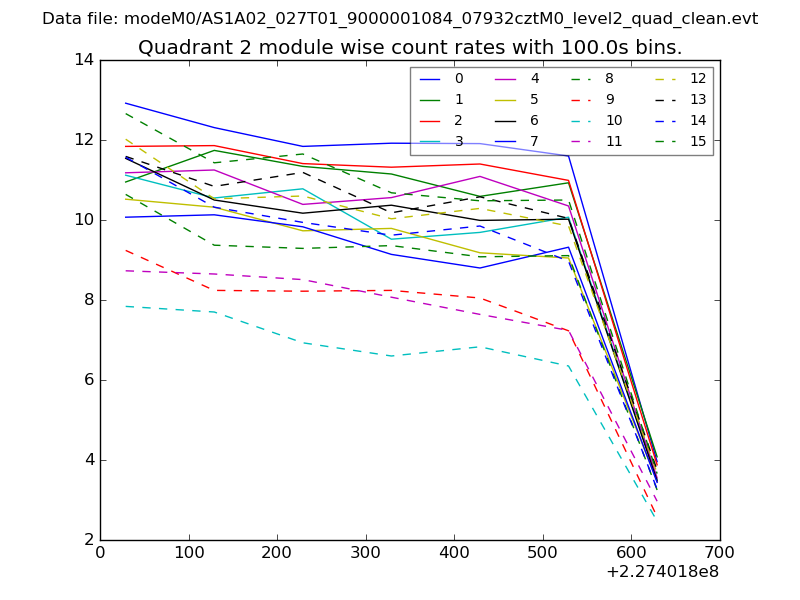
| Module-wise count rates for Quadrant B Data is divided into 100 sec bins |
 |
 |
| Module-wise count rates for Quadrant C Data is divided into 100 sec bins |
 |
 |
| Module-wise count rates for Quadrant D Data is divided into 100 sec bins |
 |
 |
| Parameter | Plot |
|---|---|
| CZT HV Monitor | 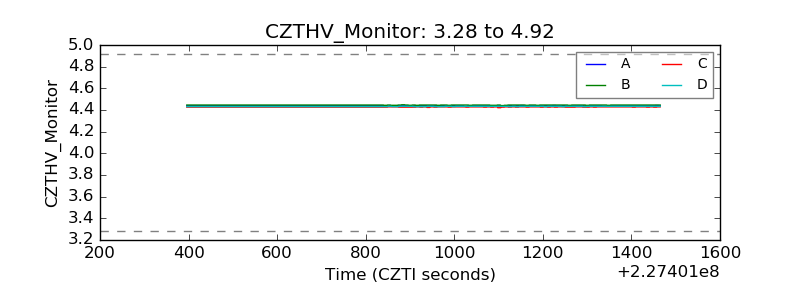 |
| D_VDD | 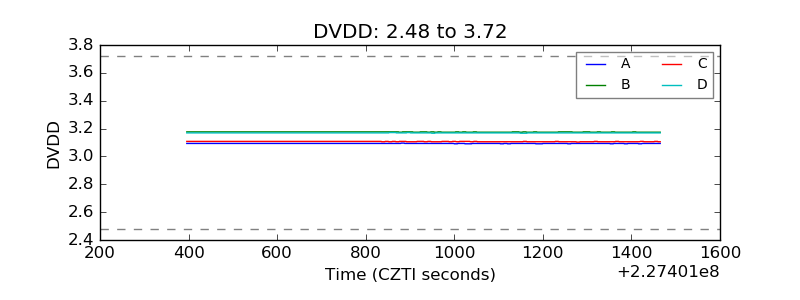 |
| Temperature 1 | 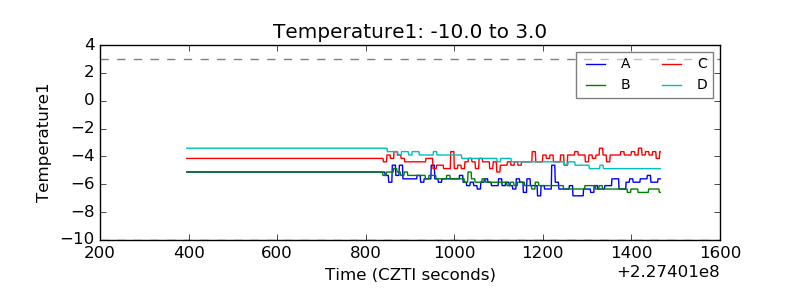 |
| Veto HV Monitor | 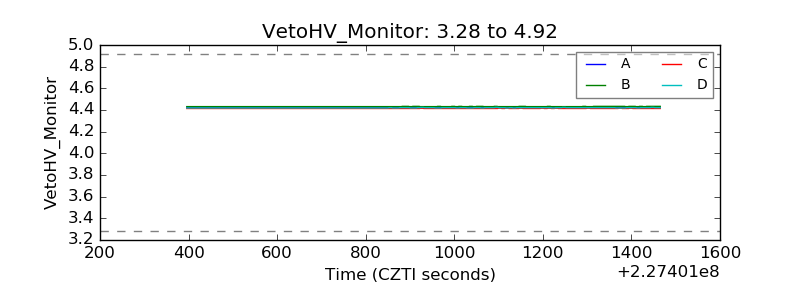 |
| Veto LLD | 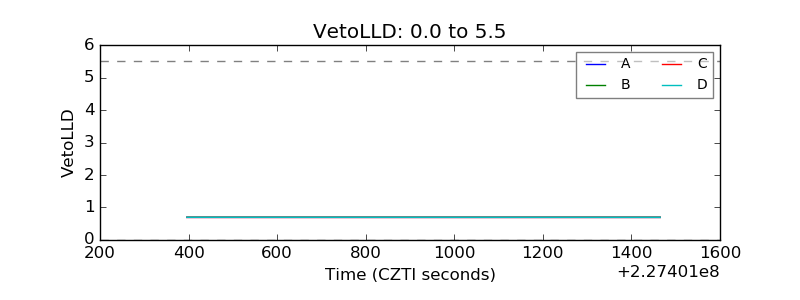 |
| Alpha Counter | 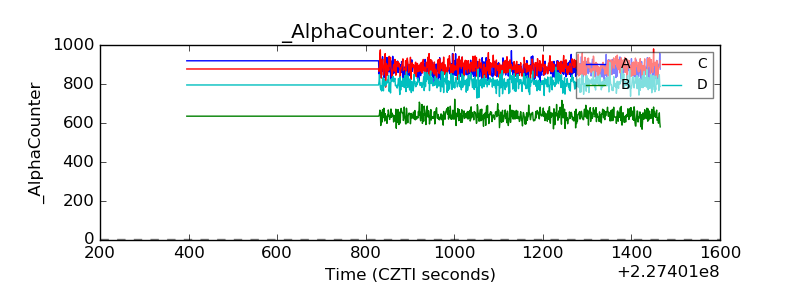 |
| _CPM_Rate | 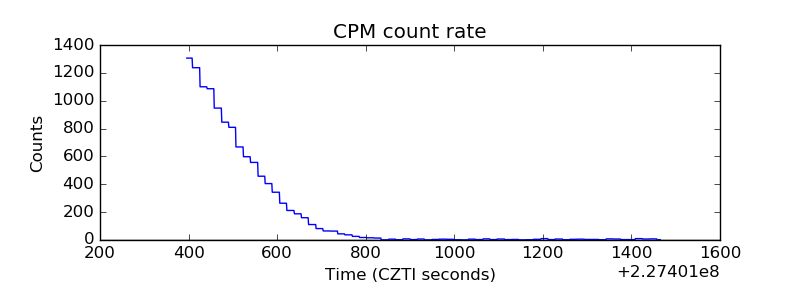 |
| CZT Counter | 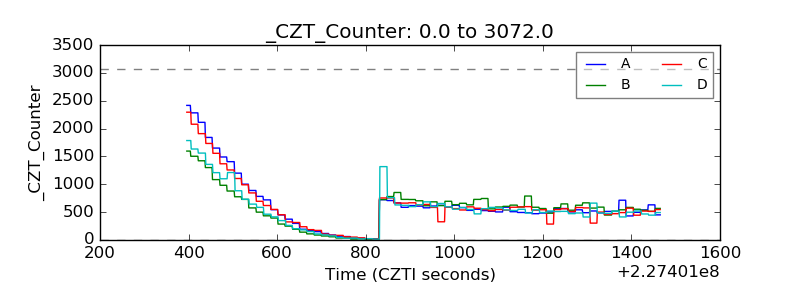 |
| +2.5 Volts monitor |  |
| +5 Volts monitor |  |
| _ROLL_ROT | 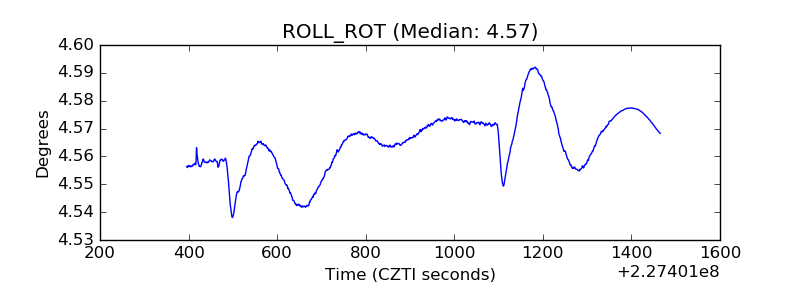 |
| _Roll_DEC | 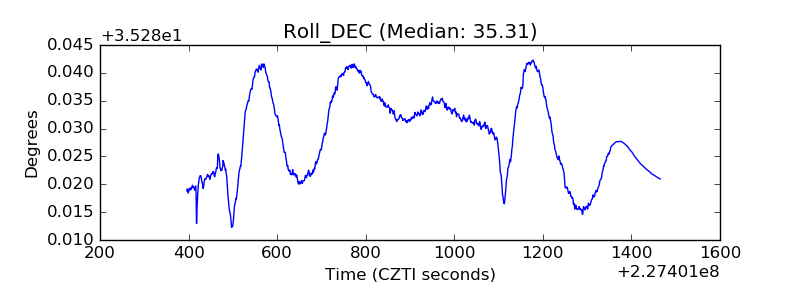 |
| _Roll_RA | 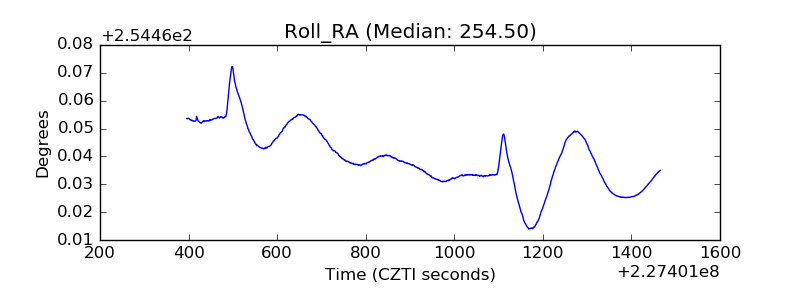 |
| Veto Counter | 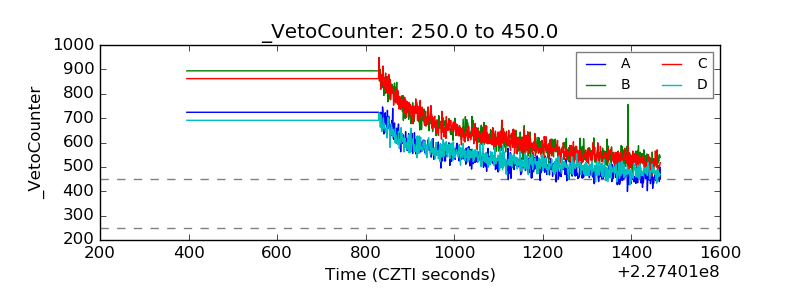 |