| Param | Original file | Final file |
|---|---|---|
| Filename | modeM0/AS1G06_117T01_9000001086cztM0_level2.fits | modeM0/AS1G06_117T01_9000001086cztM0_level2_quad_clean.evt |
| Size (bytes) | 977,967,360 | 912,320,640 |
| Size | 932.7 MB | 870.1 MB |
| Events in quadrant A | 5,820,516 | 5,251,524 |
| Events in quadrant B | 5,687,950 | 5,296,906 |
| Events in quadrant C | 5,840,856 | 5,149,284 |
| Events in quadrant D | 4,998,022 | 4,662,882 |
| Mode M9 | |||
|---|---|---|---|
| Quadrant | BADHDUFLAG | Total packets | Discarded packets |
| A | 0 | 149 | 0 |
| B | 0 | 149 | 0 |
| C | 0 | 149 | 0 |
| D | 0 | 149 | 0 |
| Mode SS | |||
|---|---|---|---|
| Quadrant | BADHDUFLAG | Total packets | Discarded packets |
| A | 0 | 2162 | 0 |
| B | 0 | 2162 | 0 |
| C | 0 | 2162 | 0 |
| D | 0 | 2162 | 0 |
| Mode M0 | |||
|---|---|---|---|
| Quadrant | BADHDUFLAG | Total packets | Discarded packets |
| A | 0 | 221589 | 0 |
| B | 0 | 223841 | 0 |
| C | 0 | 218852 | 0 |
| D | 0 | 245585 | 0 |
| Quadrant | Total seconds | Saturated seconds | Saturation percentage |
|---|---|---|---|
| A | 106065 | 1705 | 1.607505% |
| B | 106064 | 1952 | 1.840398% |
| C | 106073 | 1113 | 1.049277% |
| D | 106064 | 2357 | 2.222243% |
Noise dominated data is calculated using 1-second bins in cleaned event files. If a bin has >2000 counts, and if more than 50% of those come from <1% of pixels, then it is considered to be noise-dominated and hence unusable.
| Quadrant | # 1 sec bins | Bins with >0 counts | Bins with >2000 counts | High rate bins dominated by noise | Noise dominated (total time) | Noise dominated (detector-on time) | Marked lightcurve |
|---|---|---|---|---|---|---|---|
| A | 120935 | 106122 | 0 | 0 | 0.00% | 0.00% | 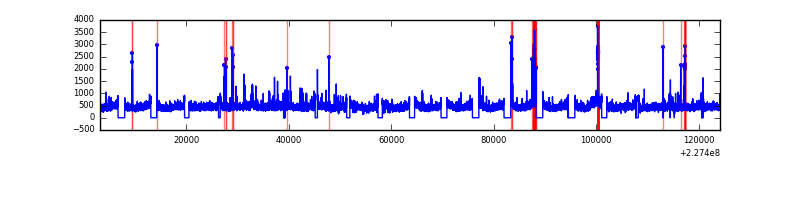 |
| B | 120935 | 106119 | 0 | 0 | 0.00% | 0.00% |  |
| C | 120935 | 106124 | 0 | 0 | 0.00% | 0.00% |  |
| D | 120935 | 106115 | 0 | 0 | 0.00% | 0.00% |  |
Top three noisy pixels from each quadrant. If the there are fewer than three noisy pixels in the level2.evt file, extra rows are filled as -1
| Pixel properties | Quadrant properties | ||||||
|---|---|---|---|---|---|---|---|
| Quadrant | DetID | PixID | Counts | Sigma | Mean | Median | Sigma |
| A | 0 | 29 | 5621 | 10.98 | 1512 | 1409 | 383.4 |
| A | 7 | 110 | 4950 | 9.23 | 1512 | 1409 | 383.4 |
| A | 0 | 30 | 4407 | 7.82 | 1512 | 1409 | 383.4 |
| B | 2 | 9 | 4953 | 11.86 | 1498 | 1423 | 297.6 |
| B | 2 | 8 | 3797 | 7.98 | 1498 | 1423 | 297.6 |
| B | 12 | 226 | 3791 | 7.96 | 1498 | 1423 | 297.6 |
| C | 1 | 81 | 4290 | 7.0 | 1543 | 1426 | 409.4 |
| C | 1 | 80 | 4222 | 6.83 | 1543 | 1426 | 409.4 |
| C | 12 | 241 | 4080 | 6.48 | 1543 | 1426 | 409.4 |
| D | 3 | 14 | 3817 | 6.58 | 1427 | 1293 | 383.7 |
| D | 3 | 31 | 3594 | 6.0 | 1427 | 1293 | 383.7 |
| D | 6 | 231 | 3588 | 5.98 | 1427 | 1293 | 383.7 |
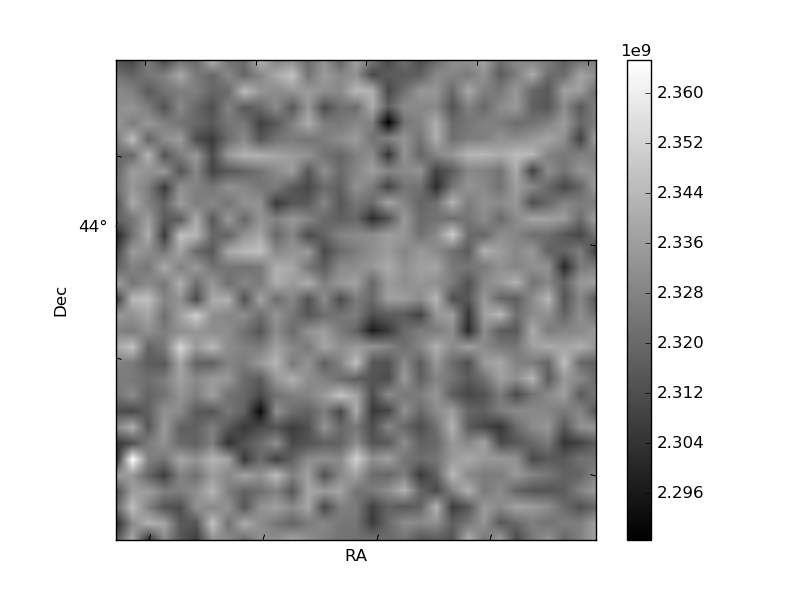
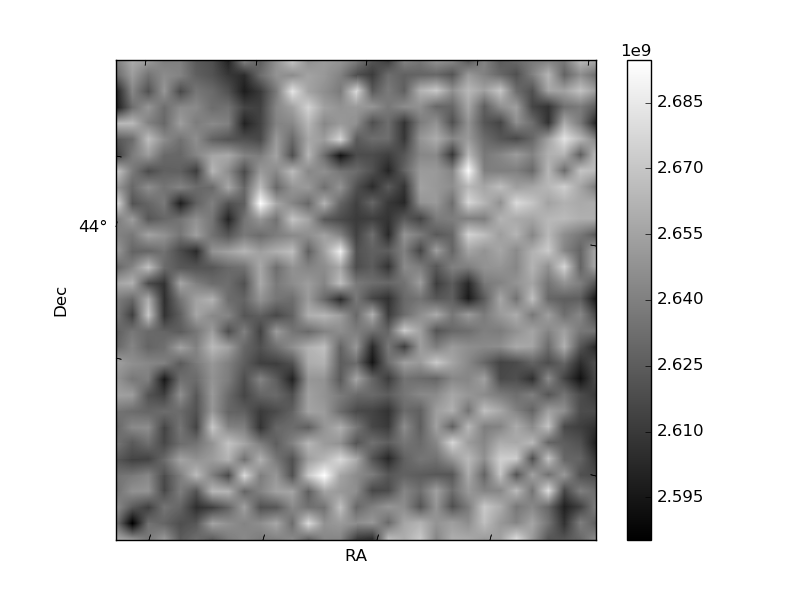
Histogram calculated using DETX and DETY for each event in the final _common_clean file
| Quadrant A | 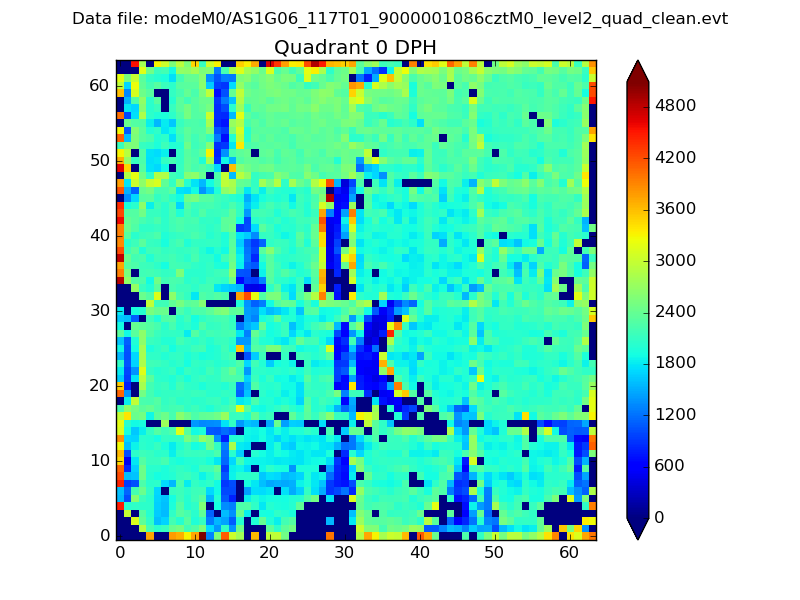 |
 |
Quadrant B |
|---|---|---|---|
| Quadrant D |  |
 |
Quadrant C |
| Plot type | Count rate plots | Images |
|---|---|---|
| Comparison with Poisson distribution Blue bars denote a histogram of data divided into 1 sec bins. Red curve is a Poisson curve with rate = median count rate of data. |
 |
 |
| Quadrant-wise count rates Data is divided into 100 sec bins |
 |
|
| Module-wise count rates for Quadrant A Data is divided into 100 sec bins |
 |
 |
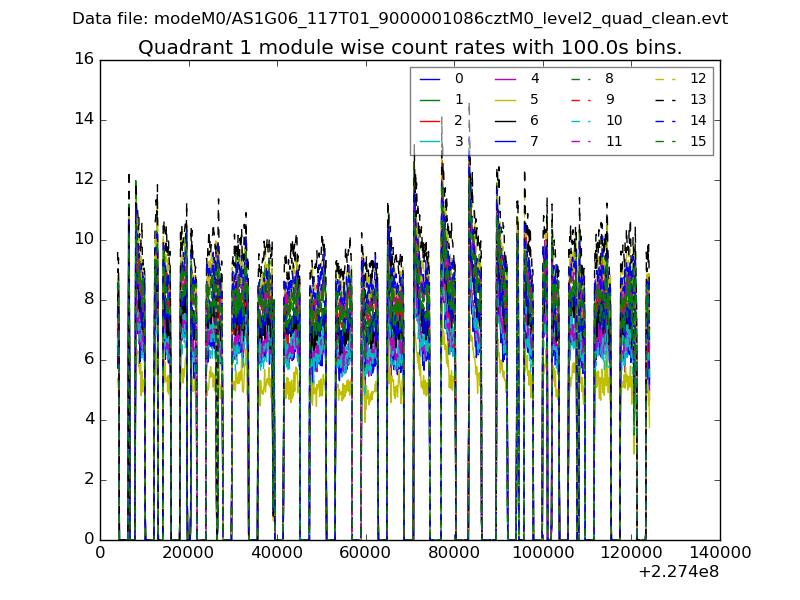
| Module-wise count rates for Quadrant B Data is divided into 100 sec bins |
 |
 |
| Module-wise count rates for Quadrant C Data is divided into 100 sec bins |
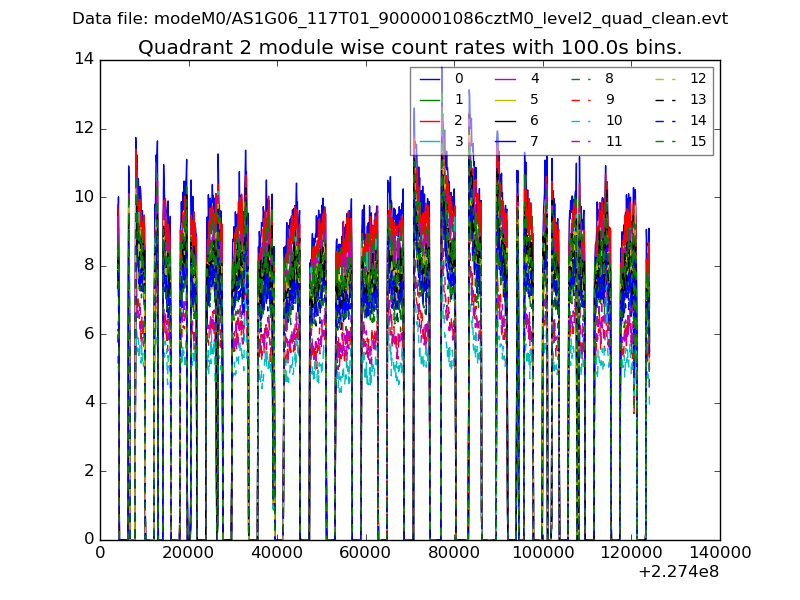 |
 |
| Module-wise count rates for Quadrant D Data is divided into 100 sec bins |
 |
 |
| Parameter | Plot |
|---|---|
| CZT HV Monitor |  |
| D_VDD | 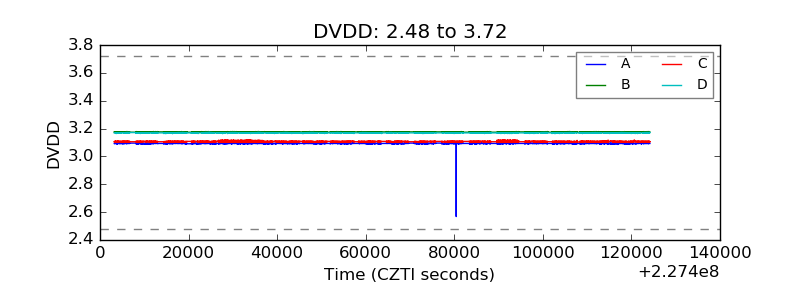 |
| Temperature 1 |  |
| Veto HV Monitor |  |
| Veto LLD |  |
| Alpha Counter |  |
| _CPM_Rate |  |
| CZT Counter |  |
| +2.5 Volts monitor |  |
| +5 Volts monitor |  |
| _ROLL_ROT |  |
| _Roll_DEC | 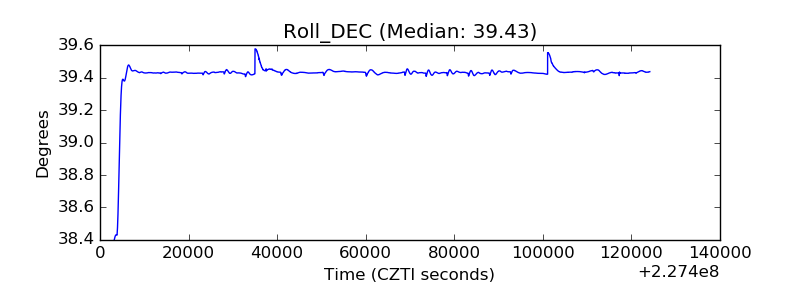 |
| _Roll_RA |  |
| Veto Counter |  |