| Param | Original file | Final file |
|---|---|---|
| Filename | modeM0/AS1G06_117T01_9000001086_07932cztM0_level2.evt | modeM0/AS1G06_117T01_9000001086_07932cztM0_level2_quad_clean.evt |
| Size (bytes) | 314,622,720 | 56,496,960 |
| Size | 300.0 MB | 53.9 MB |
| Events in quadrant A | 2,201,550 | 338,683 |
| Events in quadrant B | 2,372,969 | 351,478 |
| Events in quadrant C | 2,183,016 | 350,815 |
| Events in quadrant D | 2,441,970 | 331,184 |
| Mode M9 | |||
|---|---|---|---|
| Quadrant | BADHDUFLAG | Total packets | Discarded packets |
| A | 0 | 13 | 0 |
| B | 0 | 13 | 0 |
| C | 0 | 13 | 0 |
| D | 0 | 13 | 0 |
| Mode SS | |||
|---|---|---|---|
| Quadrant | BADHDUFLAG | Total packets | Discarded packets |
| A | 0 | 98 | 0 |
| B | 0 | 98 | 0 |
| C | 0 | 98 | 0 |
| D | 0 | 98 | 0 |
| Mode M0 | |||
|---|---|---|---|
| Quadrant | BADHDUFLAG | Total packets | Discarded packets |
| A | 0 | 9906 | 2 |
| B | 0 | 10300 | 1 |
| C | 0 | 9899 | 1 |
| D | 0 | 10865 | 1 |
| Quadrant | Total seconds | Saturated seconds | Saturation percentage |
|---|---|---|---|
| A | 4821 | 16 | 0.331881% |
| B | 4821 | 24 | 0.497822% |
| C | 4821 | 7 | 0.145198% |
| D | 4821 | 49 | 1.016387% |
Noise dominated data is calculated using 1-second bins in cleaned event files. If a bin has >2000 counts, and if more than 50% of those come from <1% of pixels, then it is considered to be noise-dominated and hence unusable.
| Quadrant | # 1 sec bins | Bins with >0 counts | Bins with >2000 counts | High rate bins dominated by noise | Noise dominated (total time) | Noise dominated (detector-on time) | Marked lightcurve |
|---|---|---|---|---|---|---|---|
| A | 6136 | 4822 | 0 | 0 | 0.00% | 0.00% | 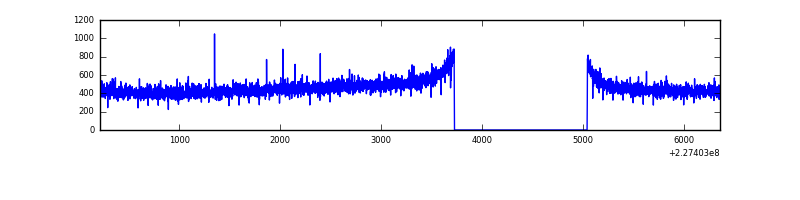 |
| B | 6136 | 4822 | 2 | 2 | 0.03% | 0.04% | 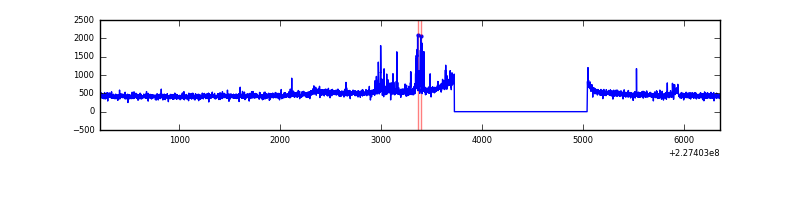 |
| C | 6136 | 4822 | 0 | 0 | 0.00% | 0.00% | 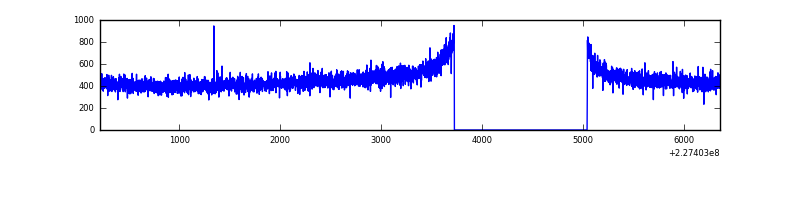 |
| D | 6136 | 4822 | 44 | 44 | 0.72% | 0.91% | 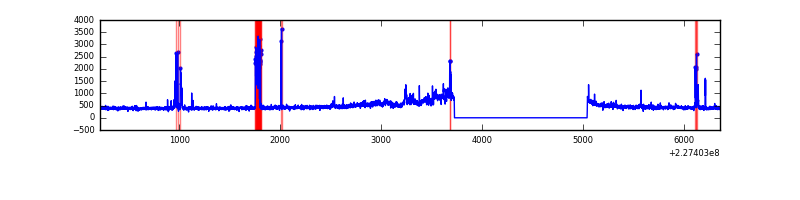 |
Top three noisy pixels from each quadrant. If the there are fewer than three noisy pixels in the level2.evt file, extra rows are filled as -1
| Pixel properties | Quadrant properties | ||||||
|---|---|---|---|---|---|---|---|
| Quadrant | DetID | PixID | Counts | Sigma | Mean | Median | Sigma |
| A | 0 | 226 | 5299 | 40.99 | 569 | 557 | 115.7 |
| A | 13 | 251 | 5280 | 40.82 | 569 | 557 | 115.7 |
| A | 12 | 194 | 4846 | 37.07 | 569 | 557 | 115.7 |
| B | 0 | 219 | 41251 | 368.92 | 577 | 563 | 110.3 |
| B | 11 | 51 | 35559 | 317.31 | 577 | 563 | 110.3 |
| B | 4 | 239 | 33926 | 302.51 | 577 | 563 | 110.3 |
| C | 13 | 61 | 4295 | 28.94 | 558 | 561 | 129.0 |
| C | 1 | 16 | 2624 | 15.99 | 558 | 561 | 129.0 |
| C | 14 | 205 | 1719 | 8.97 | 558 | 561 | 129.0 |
| D | 1 | 52 | 288357 | 2131.6 | 548 | 531 | 135.0 |
| D | 14 | 52 | 38669 | 282.44 | 548 | 531 | 135.0 |
| D | 5 | 233 | 23565 | 170.59 | 548 | 531 | 135.0 |
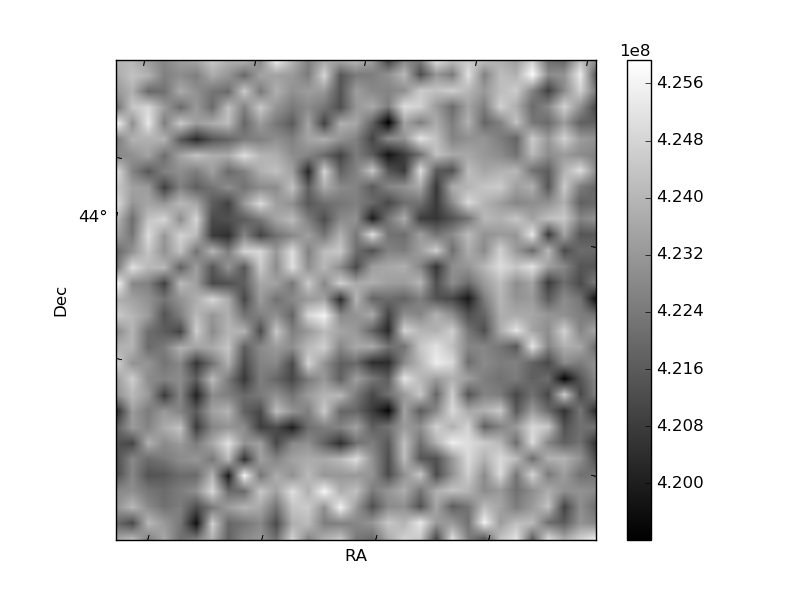
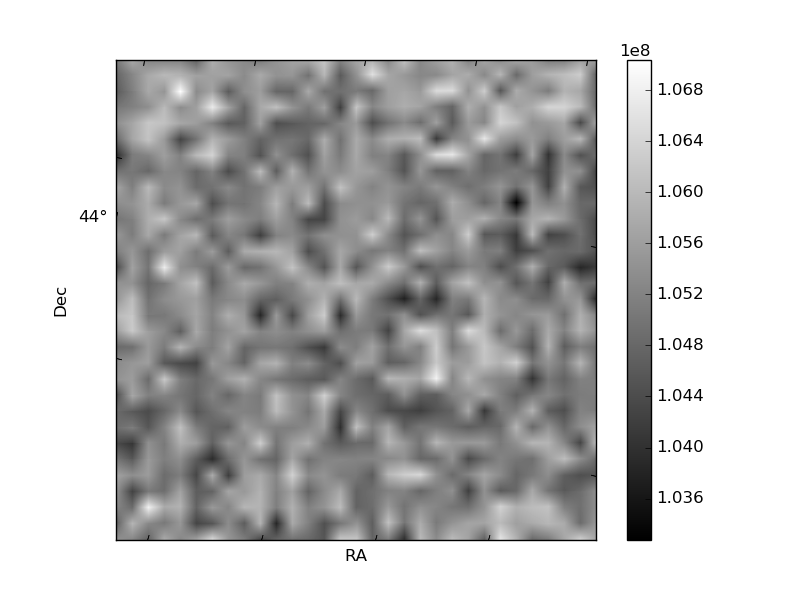
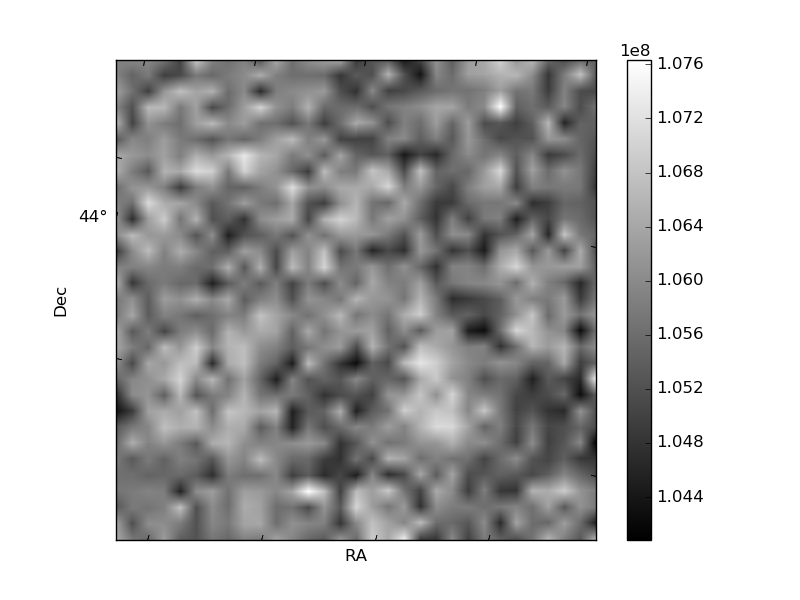
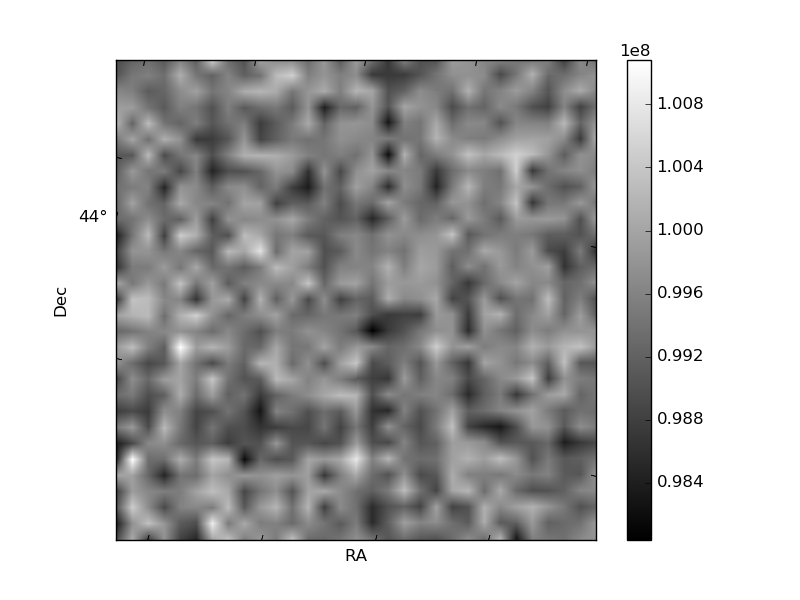
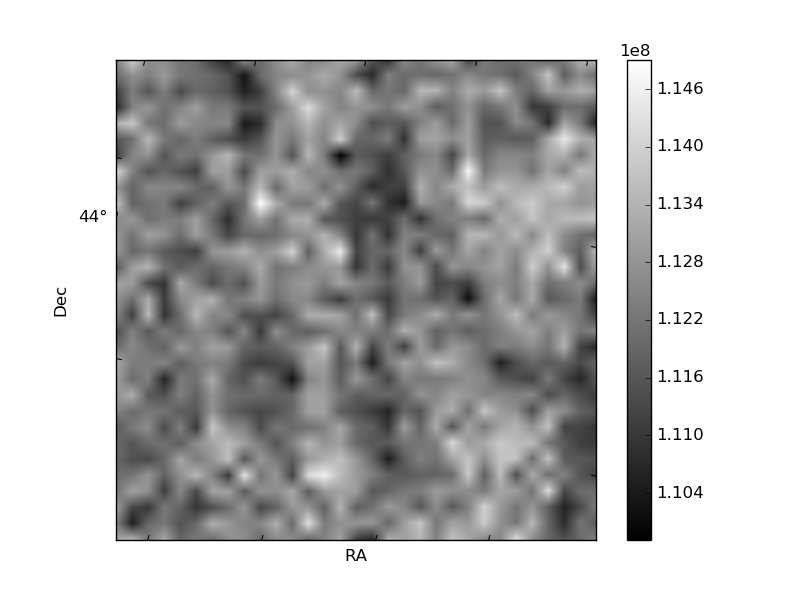
Histogram calculated using DETX and DETY for each event in the final _common_clean file
| Quadrant A | 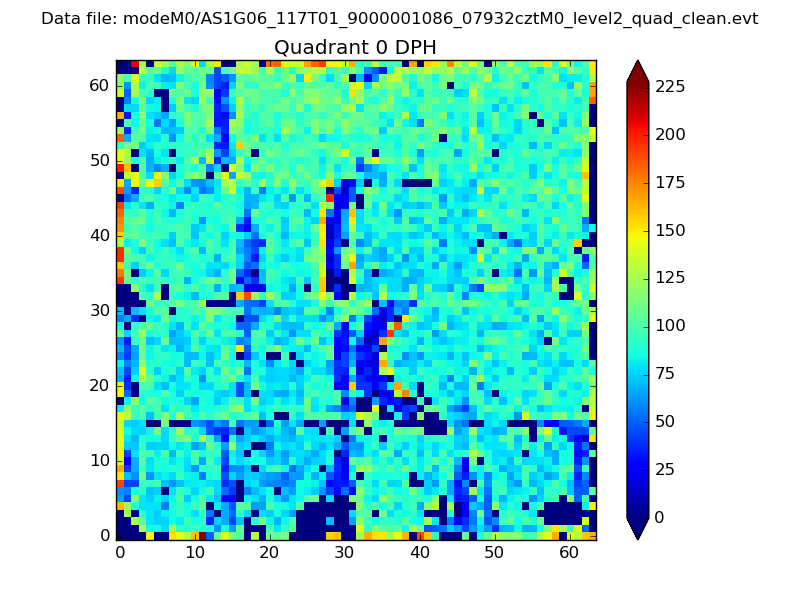 |
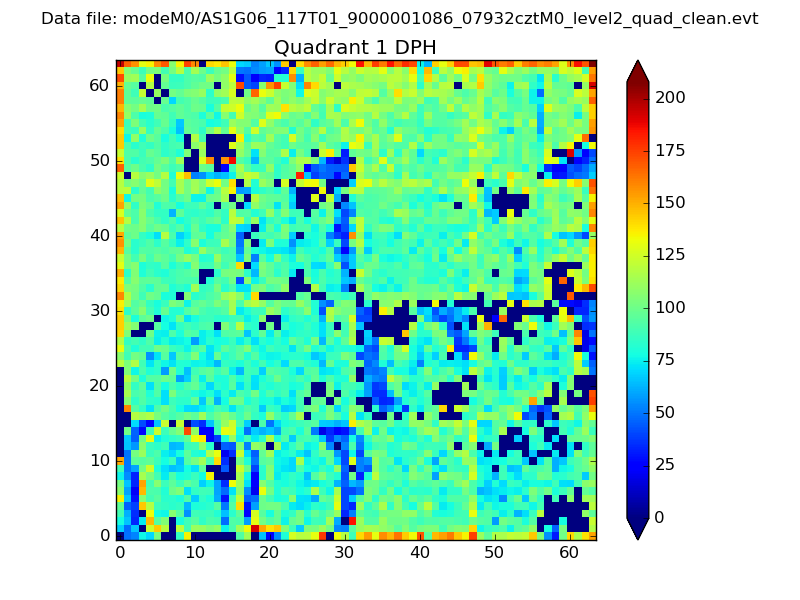 |
Quadrant B |
|---|---|---|---|
| Quadrant D | 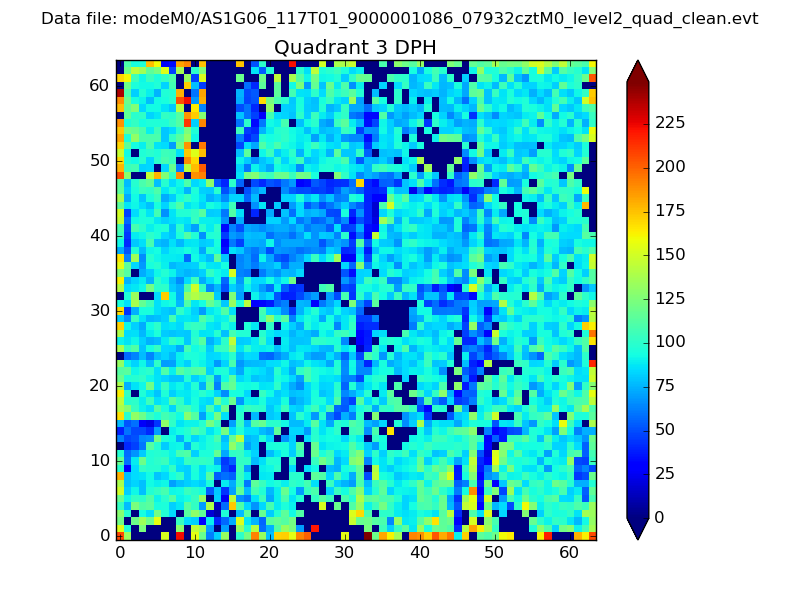 |
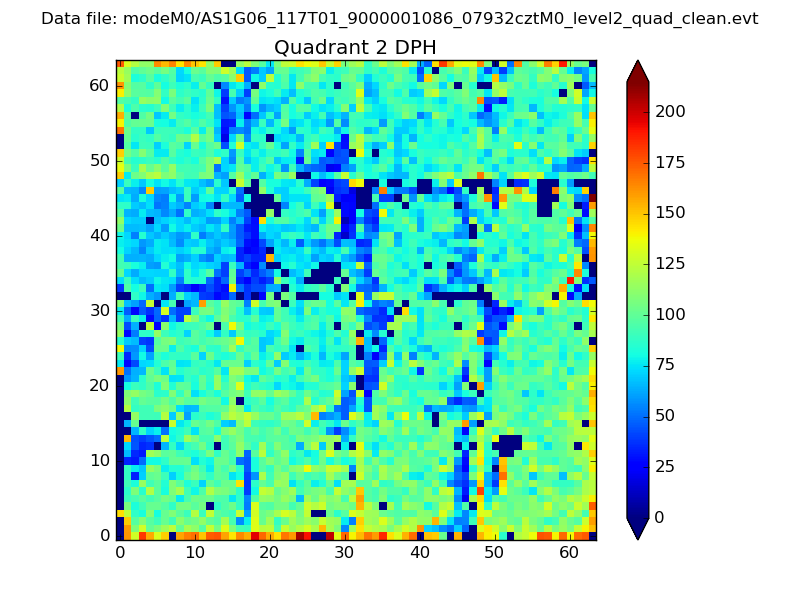 |
Quadrant C |
| Plot type | Count rate plots | Images |
|---|---|---|
| Comparison with Poisson distribution Blue bars denote a histogram of data divided into 1 sec bins. Red curve is a Poisson curve with rate = median count rate of data. |
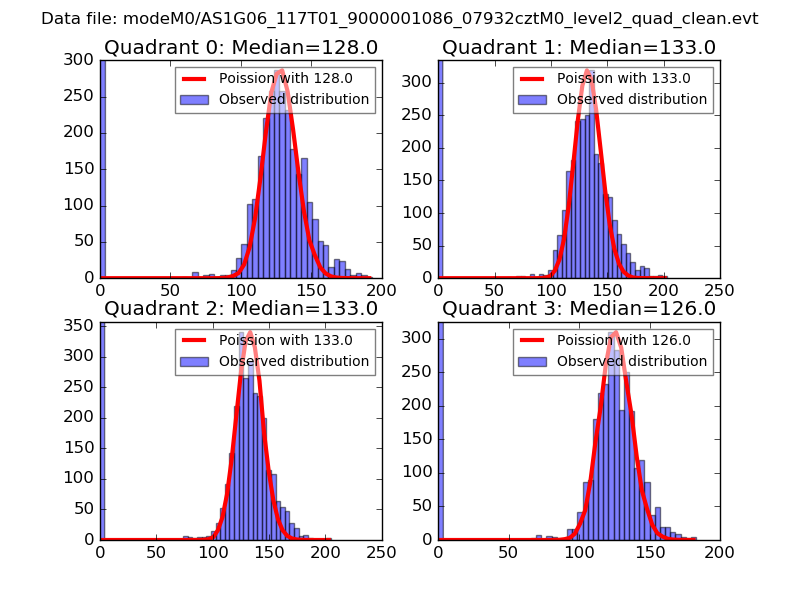 |
 |
| Quadrant-wise count rates Data is divided into 100 sec bins |
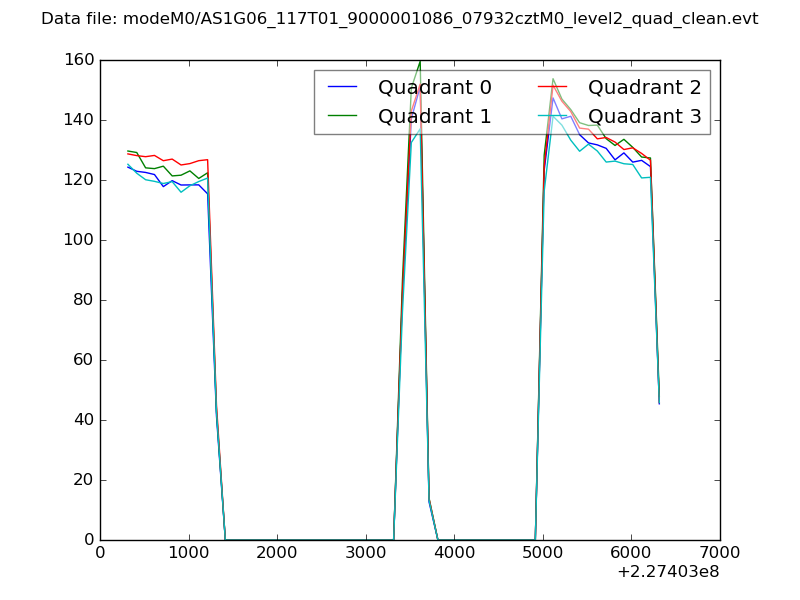 |
|
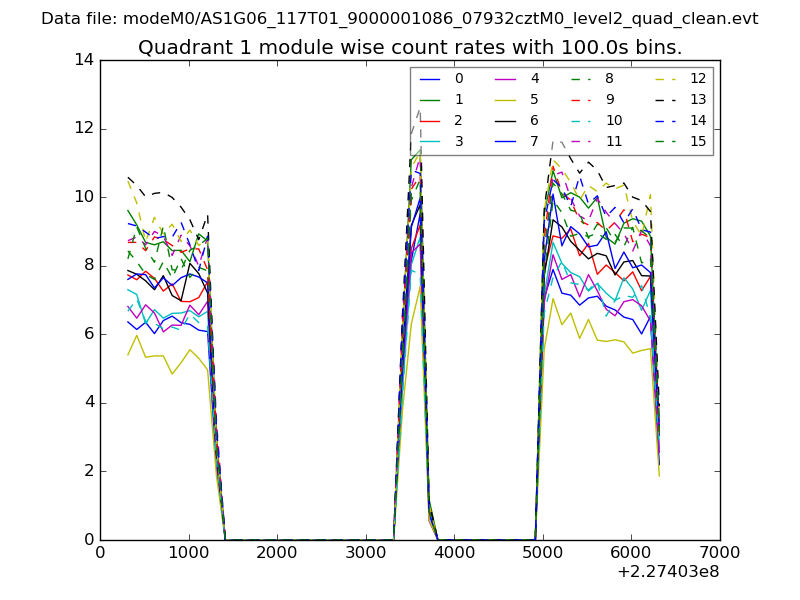
| Module-wise count rates for Quadrant A Data is divided into 100 sec bins |
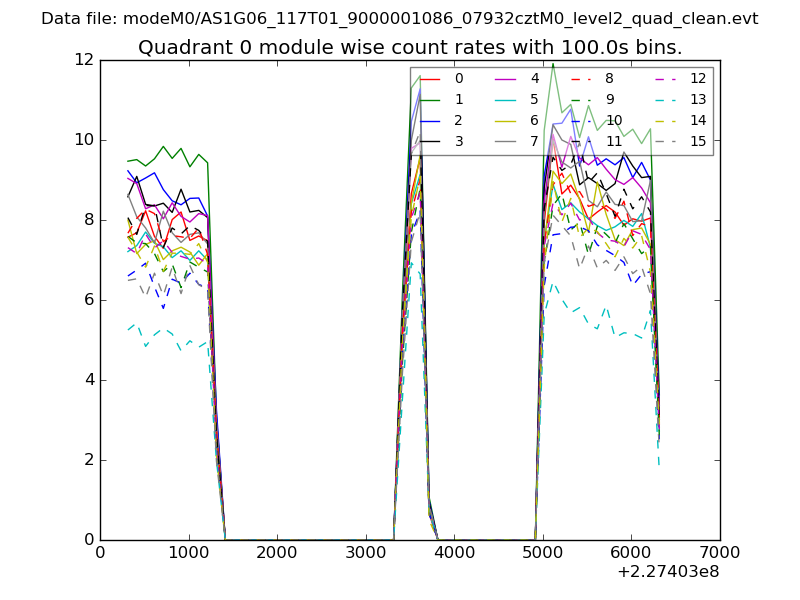 |
 |
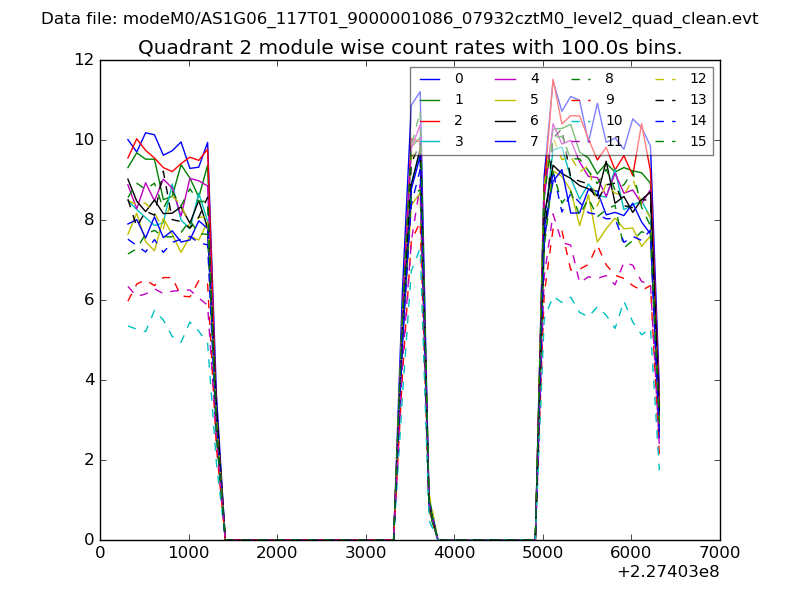
| Module-wise count rates for Quadrant B Data is divided into 100 sec bins |
 |
 |
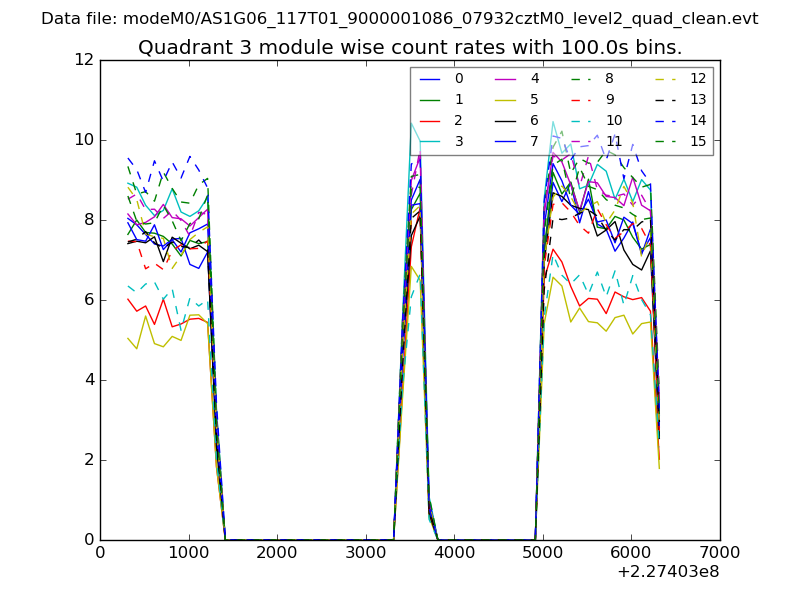
| Module-wise count rates for Quadrant C Data is divided into 100 sec bins |
 |
 |
| Module-wise count rates for Quadrant D Data is divided into 100 sec bins |
 |
 |
| Parameter | Plot |
|---|---|
| CZT HV Monitor | 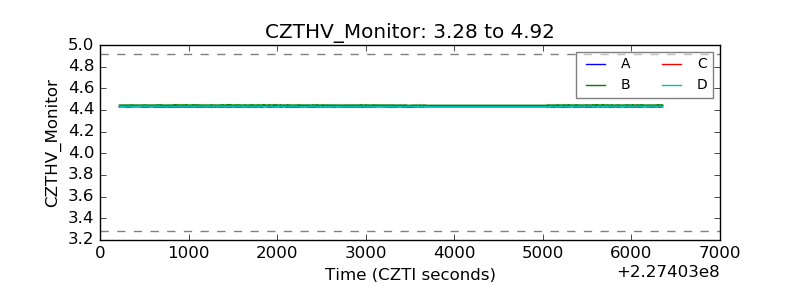 |
| D_VDD |  |
| Temperature 1 | 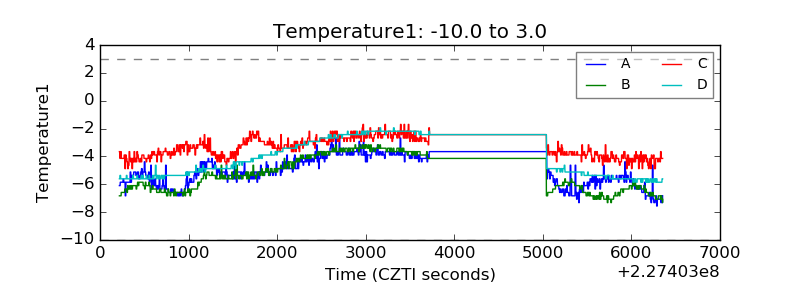 |
| Veto HV Monitor | 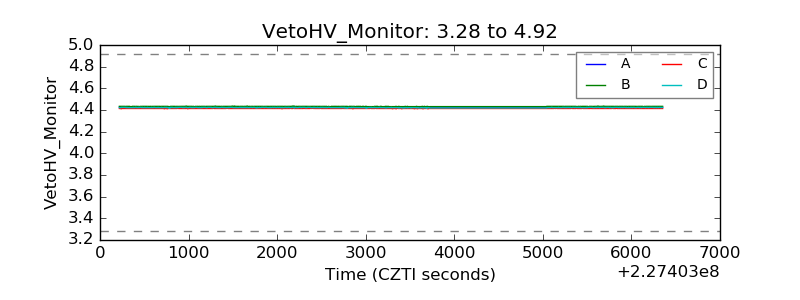 |
| Veto LLD |  |
| Alpha Counter | 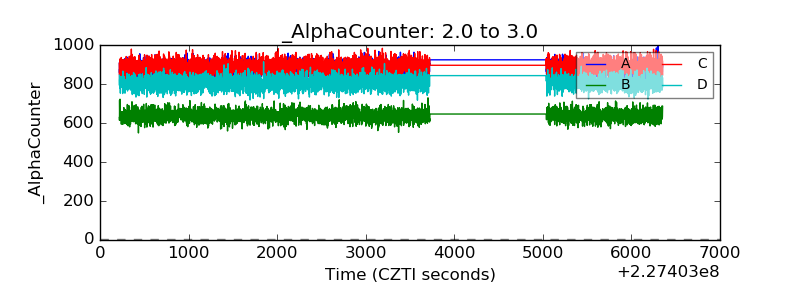 |
| _CPM_Rate | 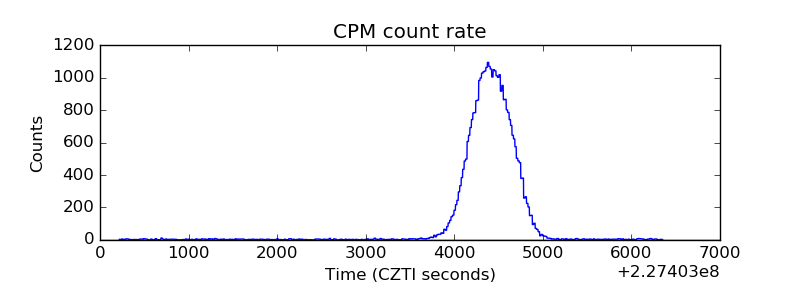 |
| CZT Counter | 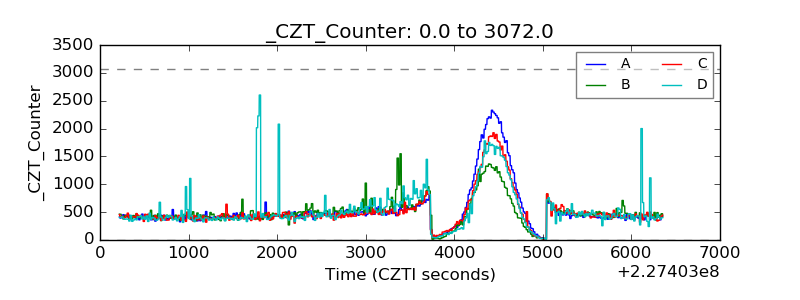 |
| +2.5 Volts monitor |  |
| +5 Volts monitor |  |
| _ROLL_ROT | 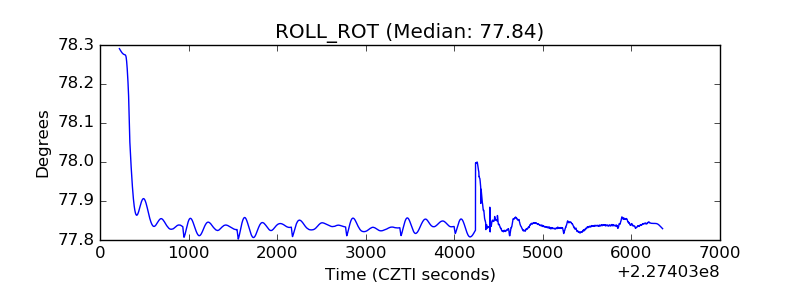 |
| _Roll_DEC | 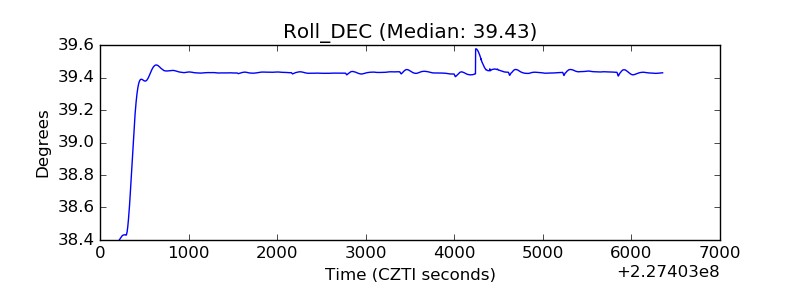 |
| _Roll_RA | 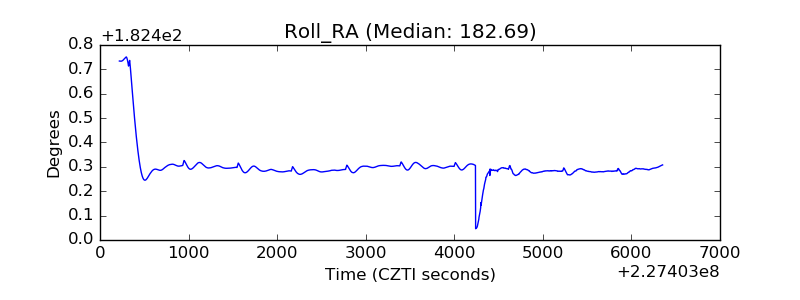 |
| Veto Counter | 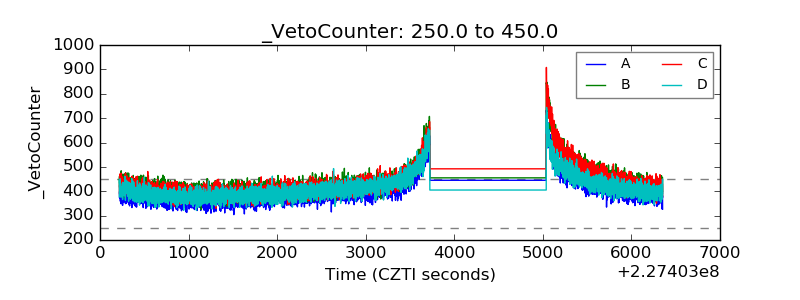 |