| Param | Original file | Final file |
|---|---|---|
| Filename | modeM0/AS1G06_117T01_9000001086_07933cztM0_level2.evt | modeM0/AS1G06_117T01_9000001086_07933cztM0_level2_quad_clean.evt |
| Size (bytes) | 414,866,880 | 87,649,920 |
| Size | 395.6 MB | 83.6 MB |
| Events in quadrant A | 2,928,358 | 548,284 |
| Events in quadrant B | 3,036,639 | 568,419 |
| Events in quadrant C | 2,877,259 | 563,172 |
| Events in quadrant D | 3,285,401 | 526,716 |
| Mode M9 | |||
|---|---|---|---|
| Quadrant | BADHDUFLAG | Total packets | Discarded packets |
| A | 0 | 19 | 0 |
| B | 0 | 19 | 0 |
| C | 0 | 19 | 0 |
| D | 0 | 20 | 0 |
| Mode SS | |||
|---|---|---|---|
| Quadrant | BADHDUFLAG | Total packets | Discarded packets |
| A | 0 | 132 | 0 |
| B | 0 | 132 | 0 |
| C | 0 | 132 | 0 |
| D | 0 | 132 | 0 |
| Mode M0 | |||
|---|---|---|---|
| Quadrant | BADHDUFLAG | Total packets | Discarded packets |
| A | 0 | 13236 | 3 |
| B | 0 | 13464 | 2 |
| C | 0 | 13140 | 2 |
| D | 0 | 14610 | 2 |
| Quadrant | Total seconds | Saturated seconds | Saturation percentage |
|---|---|---|---|
| A | 6408 | 23 | 0.358926% |
| B | 6408 | 28 | 0.436954% |
| C | 6408 | 14 | 0.218477% |
| D | 6408 | 187 | 2.918227% |
Noise dominated data is calculated using 1-second bins in cleaned event files. If a bin has >2000 counts, and if more than 50% of those come from <1% of pixels, then it is considered to be noise-dominated and hence unusable.
| Quadrant | # 1 sec bins | Bins with >0 counts | Bins with >2000 counts | High rate bins dominated by noise | Noise dominated (total time) | Noise dominated (detector-on time) | Marked lightcurve |
|---|---|---|---|---|---|---|---|
| A | 7573 | 6409 | 3 | 3 | 0.04% | 0.05% | 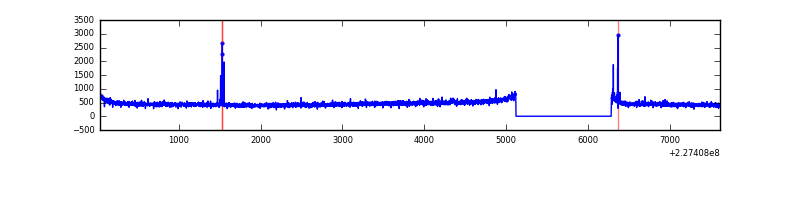 |
| B | 7573 | 6409 | 0 | 0 | 0.00% | 0.00% | 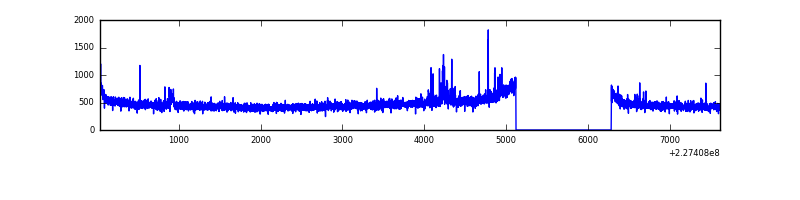 |
| C | 7573 | 6409 | 0 | 0 | 0.00% | 0.00% | 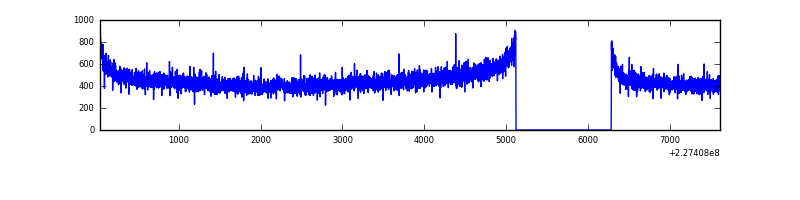 |
| D | 7573 | 6409 | 163 | 163 | 2.15% | 2.54% | 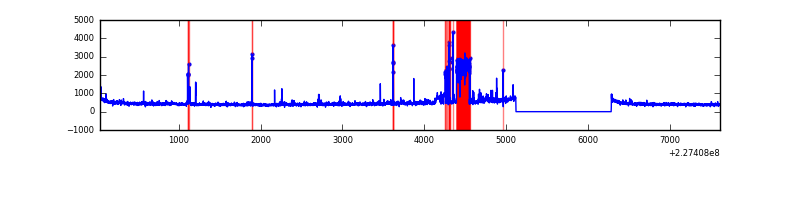 |
Top three noisy pixels from each quadrant. If the there are fewer than three noisy pixels in the level2.evt file, extra rows are filled as -1
| Pixel properties | Quadrant properties | ||||||
|---|---|---|---|---|---|---|---|
| Quadrant | DetID | PixID | Counts | Sigma | Mean | Median | Sigma |
| A | 13 | 251 | 27489 | 175.9 | 749 | 732 | 152.1 |
| A | 13 | 248 | 14594 | 91.13 | 749 | 732 | 152.1 |
| A | 0 | 226 | 6916 | 40.65 | 749 | 732 | 152.1 |
| B | 0 | 197 | 29960 | 202.79 | 761 | 741 | 144.1 |
| B | 11 | 51 | 17347 | 115.25 | 761 | 741 | 144.1 |
| B | 12 | 111 | 15722 | 103.97 | 761 | 741 | 144.1 |
| C | 13 | 61 | 5453 | 27.69 | 735 | 737 | 170.3 |
| C | 1 | 16 | 3960 | 18.92 | 735 | 737 | 170.3 |
| C | 14 | 205 | 3749 | 17.68 | 735 | 737 | 170.3 |
| D | 1 | 52 | 474791 | 2723.95 | 717 | 695 | 174.0 |
| D | 5 | 233 | 46080 | 260.76 | 717 | 695 | 174.0 |
| D | 13 | 104 | 24316 | 135.72 | 717 | 695 | 174.0 |
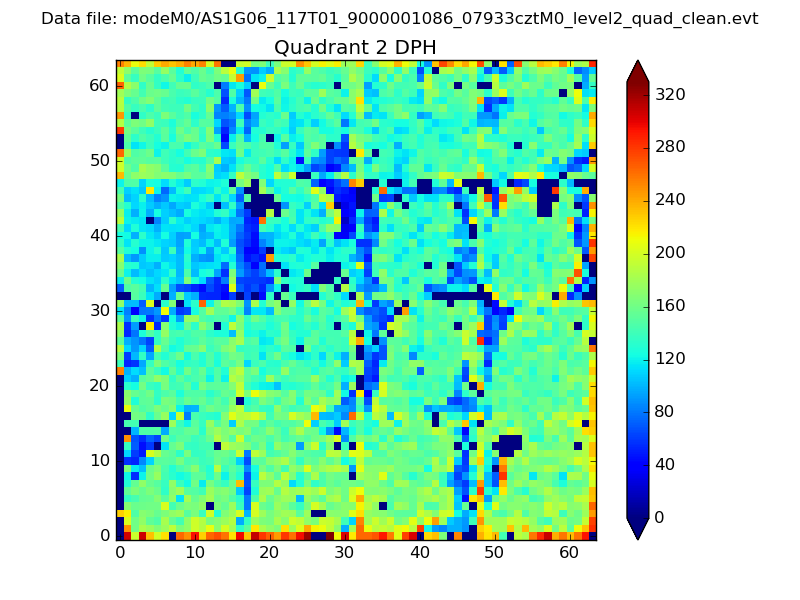
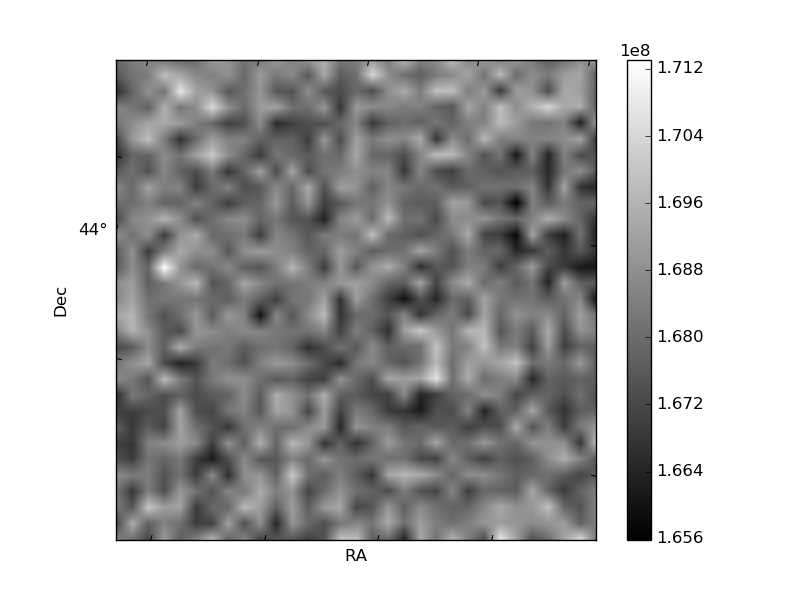
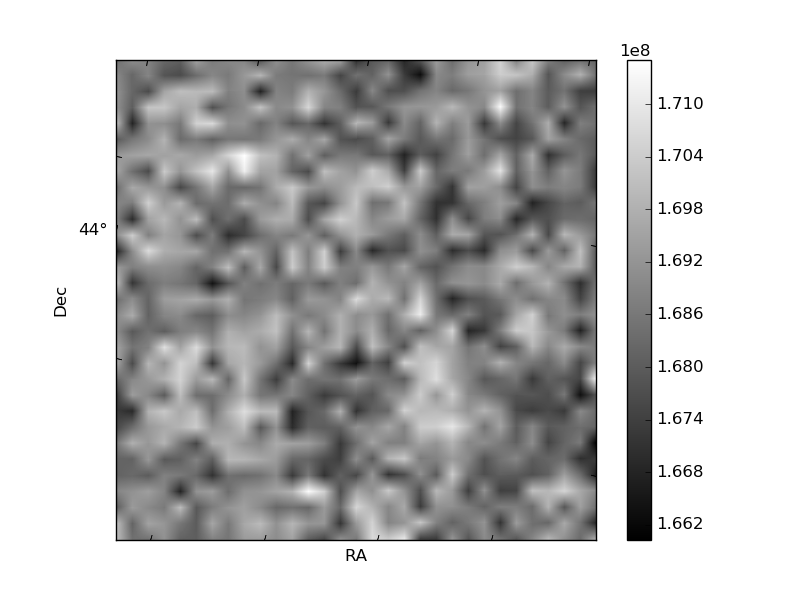
Histogram calculated using DETX and DETY for each event in the final _common_clean file
| Quadrant A |  |
 |
Quadrant B |
|---|---|---|---|
| Quadrant D |  |
 |
Quadrant C |
| Plot type | Count rate plots | Images |
|---|---|---|
| Comparison with Poisson distribution Blue bars denote a histogram of data divided into 1 sec bins. Red curve is a Poisson curve with rate = median count rate of data. |
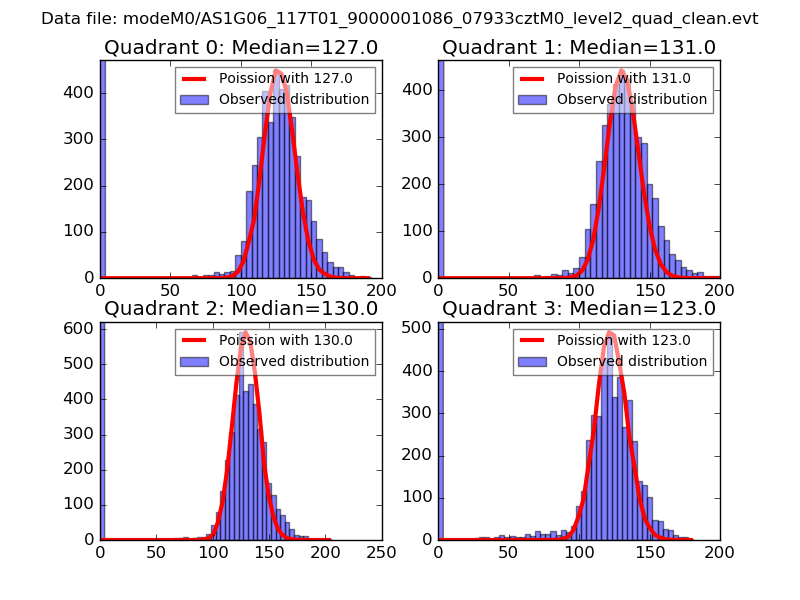 |
 |
| Quadrant-wise count rates Data is divided into 100 sec bins |
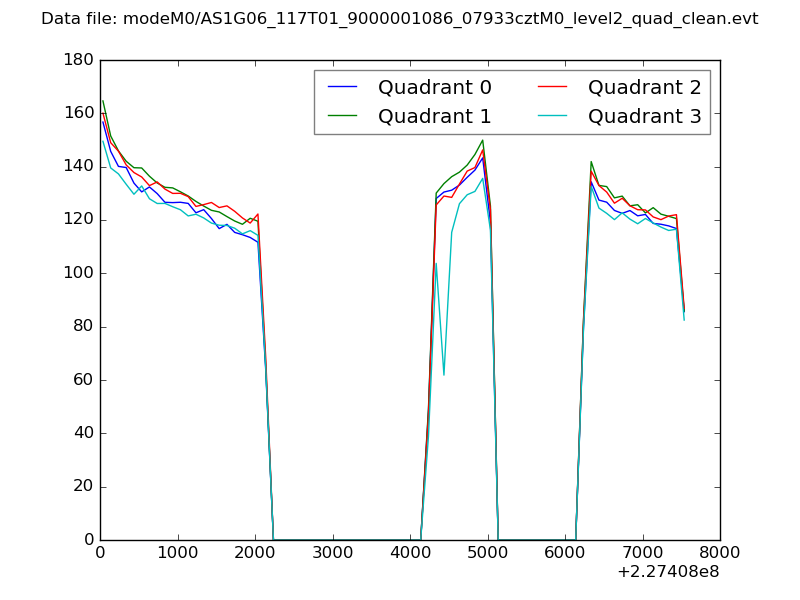 |
|
| Module-wise count rates for Quadrant A Data is divided into 100 sec bins |
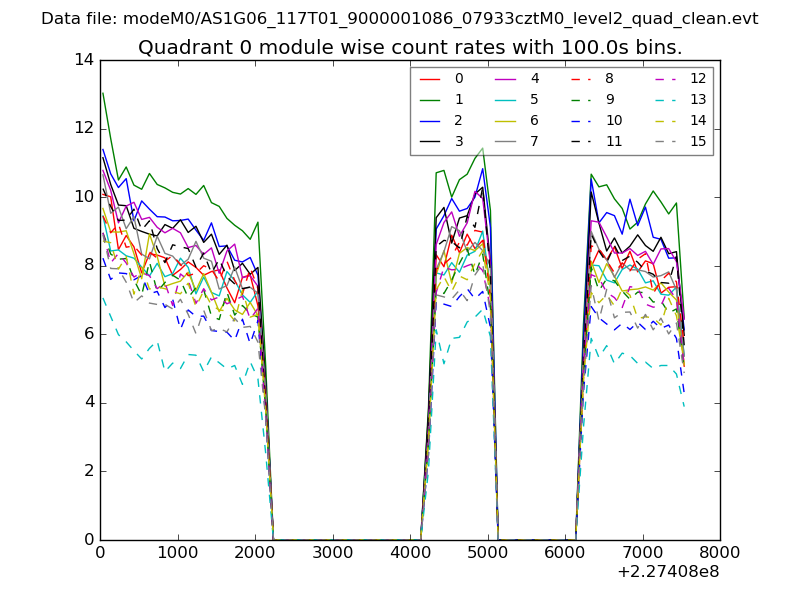 |
 |
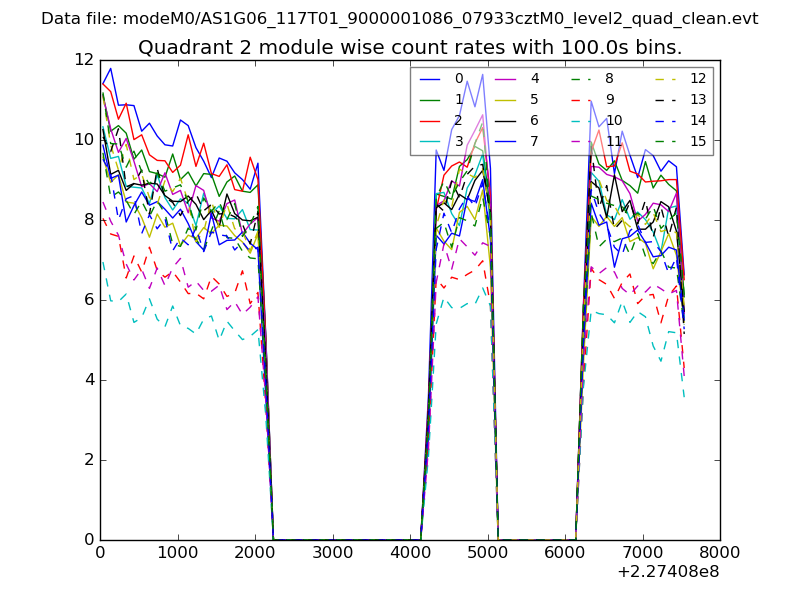
| Module-wise count rates for Quadrant B Data is divided into 100 sec bins |
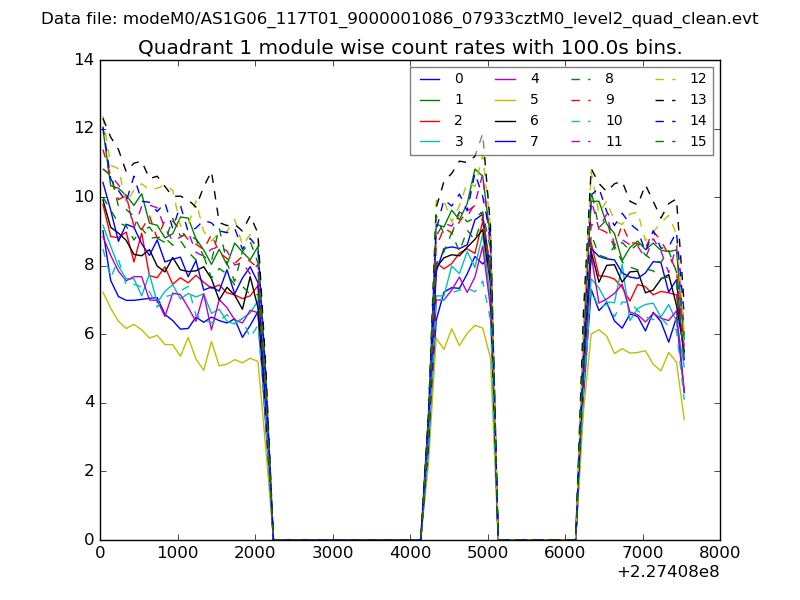 |
 |
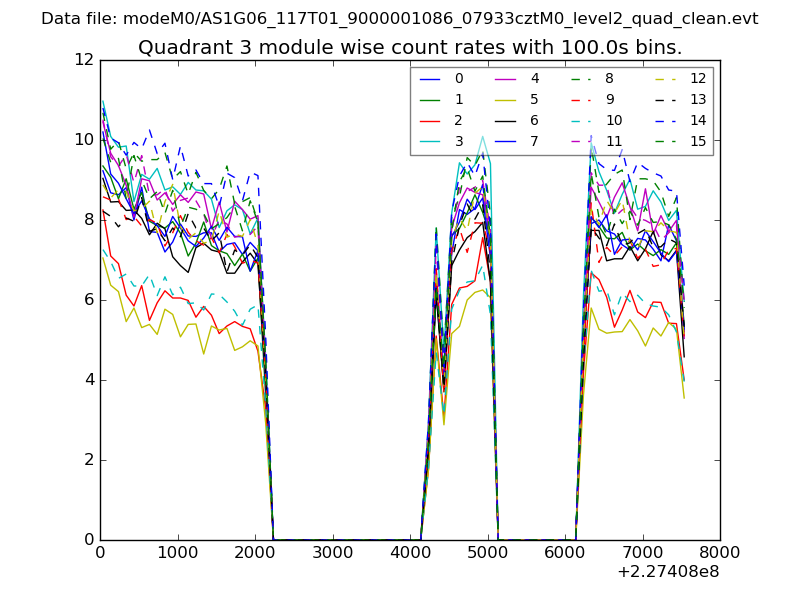
| Module-wise count rates for Quadrant C Data is divided into 100 sec bins |
 |
 |
| Module-wise count rates for Quadrant D Data is divided into 100 sec bins |
 |
 |
| Parameter | Plot |
|---|---|
| CZT HV Monitor | 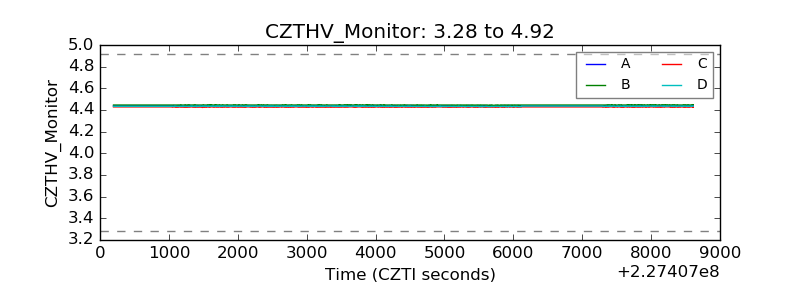 |
| D_VDD | 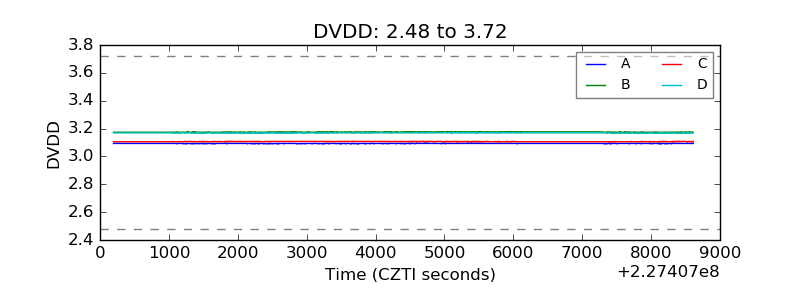 |
| Temperature 1 | 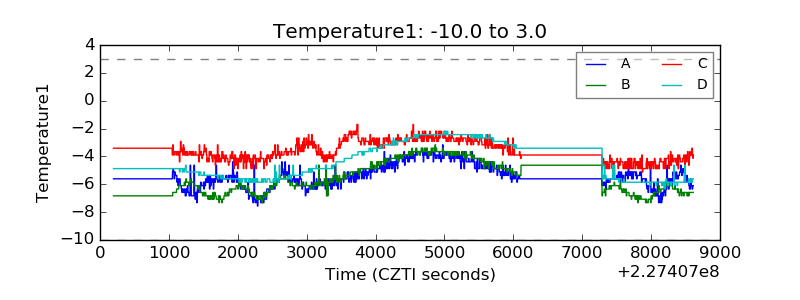 |
| Veto HV Monitor | 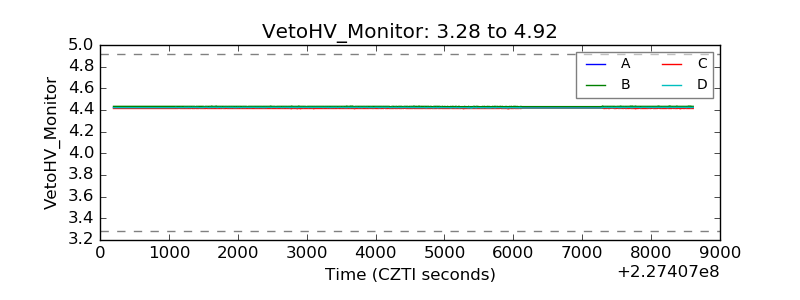 |
| Veto LLD | 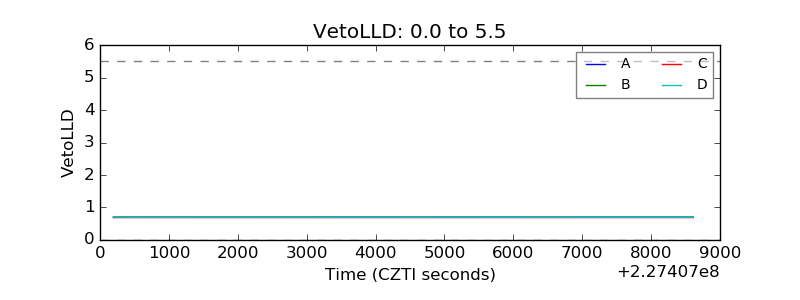 |
| Alpha Counter | 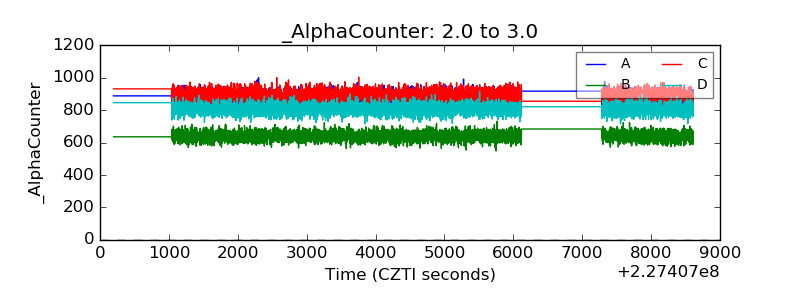 |
| _CPM_Rate | 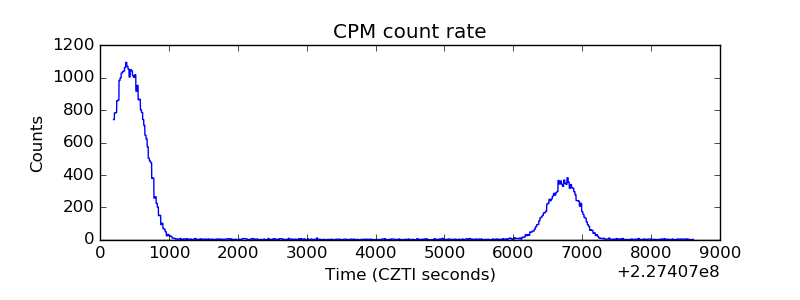 |
| CZT Counter | 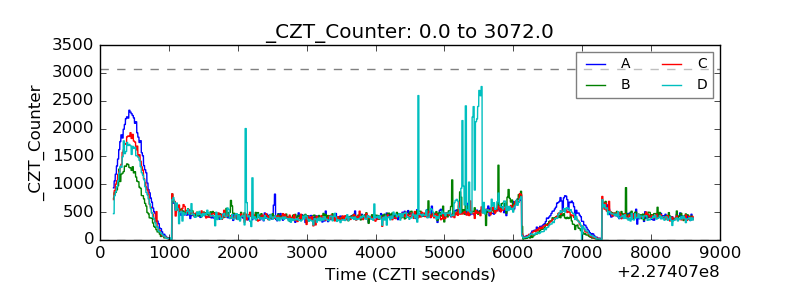 |
| +2.5 Volts monitor |  |
| +5 Volts monitor |  |
| _ROLL_ROT | 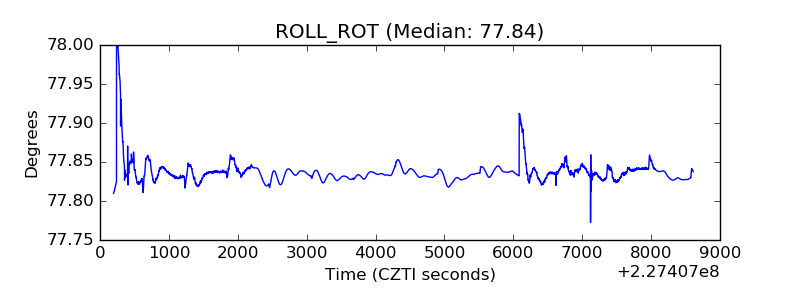 |
| _Roll_DEC | 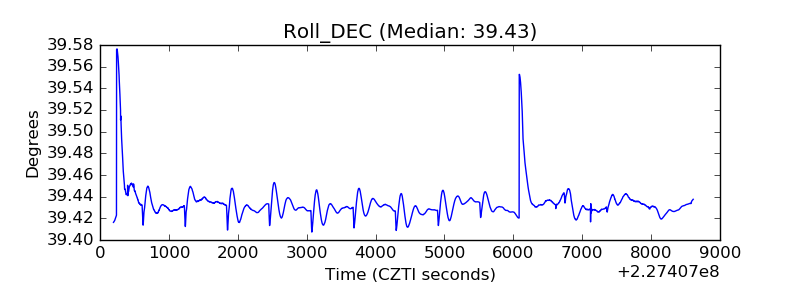 |
| _Roll_RA | 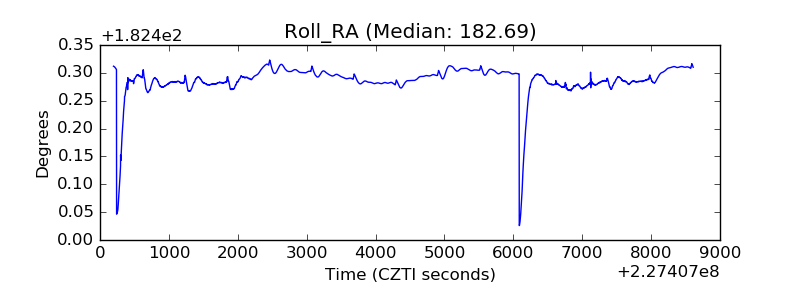 |
| Veto Counter | 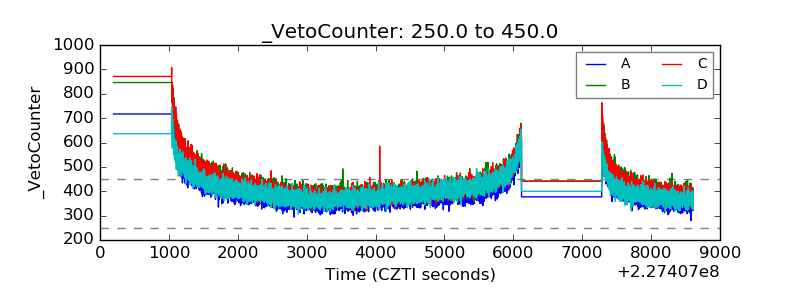 |