| Param | Original file | Final file |
|---|---|---|
| Filename | modeM0/AS1G06_117T01_9000001086_07934cztM0_level2.evt | modeM0/AS1G06_117T01_9000001086_07934cztM0_level2_quad_clean.evt |
| Size (bytes) | 465,946,560 | 101,560,320 |
| Size | 444.4 MB | 96.9 MB |
| Events in quadrant A | 3,312,987 | 638,990 |
| Events in quadrant B | 3,491,033 | 657,485 |
| Events in quadrant C | 3,276,932 | 652,962 |
| Events in quadrant D | 3,533,795 | 618,149 |
| Mode M9 | |||
|---|---|---|---|
| Quadrant | BADHDUFLAG | Total packets | Discarded packets |
| A | 0 | 20 | 0 |
| B | 0 | 20 | 0 |
| C | 0 | 20 | 0 |
| D | 0 | 20 | 0 |
| Mode SS | |||
|---|---|---|---|
| Quadrant | BADHDUFLAG | Total packets | Discarded packets |
| A | 0 | 152 | 0 |
| B | 0 | 152 | 0 |
| C | 0 | 152 | 0 |
| D | 0 | 152 | 0 |
| Mode M0 | |||
|---|---|---|---|
| Quadrant | BADHDUFLAG | Total packets | Discarded packets |
| A | 0 | 14994 | 3 |
| B | 0 | 15415 | 2 |
| C | 0 | 14968 | 2 |
| D | 0 | 15939 | 2 |
| Quadrant | Total seconds | Saturated seconds | Saturation percentage |
|---|---|---|---|
| A | 7294 | 41 | 0.562106% |
| B | 7294 | 70 | 0.959693% |
| C | 7294 | 21 | 0.287908% |
| D | 7294 | 77 | 1.055662% |
Noise dominated data is calculated using 1-second bins in cleaned event files. If a bin has >2000 counts, and if more than 50% of those come from <1% of pixels, then it is considered to be noise-dominated and hence unusable.
| Quadrant | # 1 sec bins | Bins with >0 counts | Bins with >2000 counts | High rate bins dominated by noise | Noise dominated (total time) | Noise dominated (detector-on time) | Marked lightcurve |
|---|---|---|---|---|---|---|---|
| A | 9329 | 7296 | 1 | 1 | 0.01% | 0.01% | 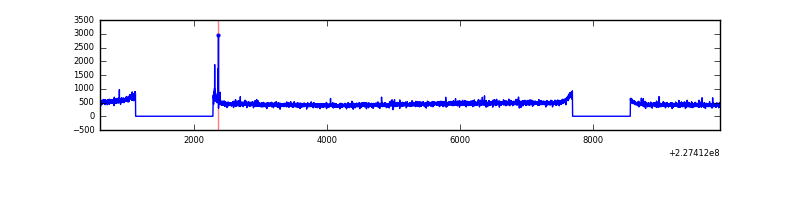 |
| B | 9329 | 7296 | 4 | 4 | 0.04% | 0.05% | 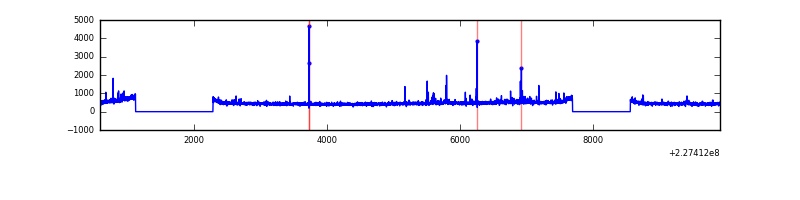 |
| C | 9329 | 7296 | 0 | 0 | 0.00% | 0.00% |  |
| D | 9329 | 7296 | 40 | 40 | 0.43% | 0.55% | 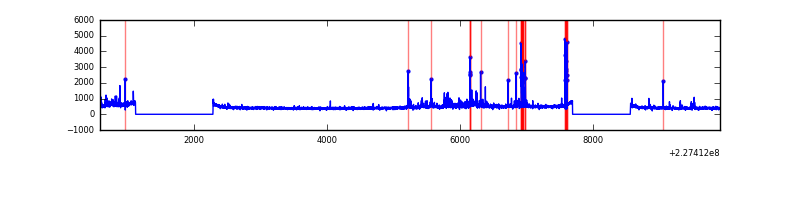 |
Top three noisy pixels from each quadrant. If the there are fewer than three noisy pixels in the level2.evt file, extra rows are filled as -1
| Pixel properties | Quadrant properties | ||||||
|---|---|---|---|---|---|---|---|
| Quadrant | DetID | PixID | Counts | Sigma | Mean | Median | Sigma |
| A | 13 | 251 | 21506 | 118.72 | 855 | 836 | 174.1 |
| A | 0 | 226 | 8026 | 41.3 | 855 | 836 | 174.1 |
| A | 12 | 194 | 7379 | 37.58 | 855 | 836 | 174.1 |
| B | 11 | 51 | 41283 | 242.77 | 866 | 844 | 166.6 |
| B | 4 | 239 | 30065 | 175.42 | 866 | 844 | 166.6 |
| B | 12 | 111 | 18339 | 105.03 | 866 | 844 | 166.6 |
| C | 13 | 61 | 6379 | 28.48 | 837 | 840 | 194.5 |
| C | 12 | 4 | 4664 | 19.66 | 837 | 840 | 194.5 |
| C | 1 | 16 | 4490 | 18.77 | 837 | 840 | 194.5 |
| D | 1 | 52 | 141505 | 694.02 | 828 | 802 | 202.7 |
| D | 5 | 233 | 129075 | 632.71 | 828 | 802 | 202.7 |
| D | 4 | 95 | 71688 | 349.65 | 828 | 802 | 202.7 |
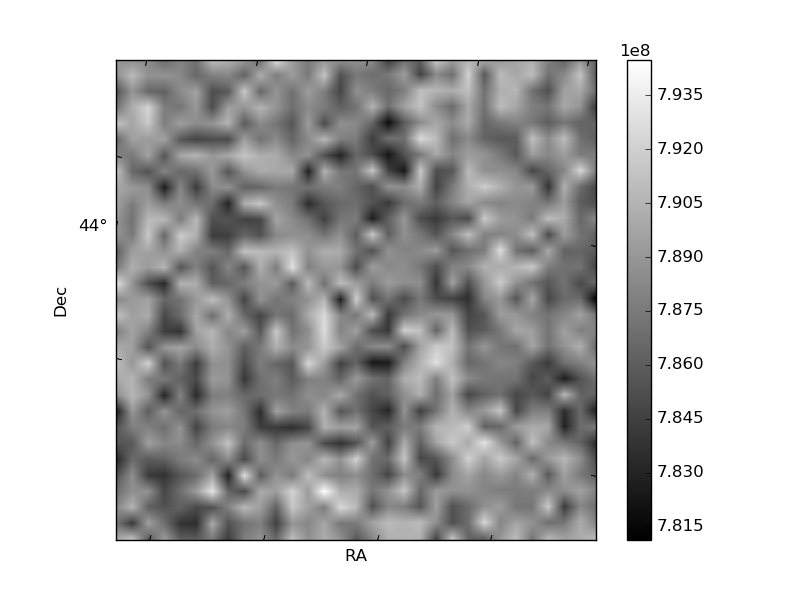
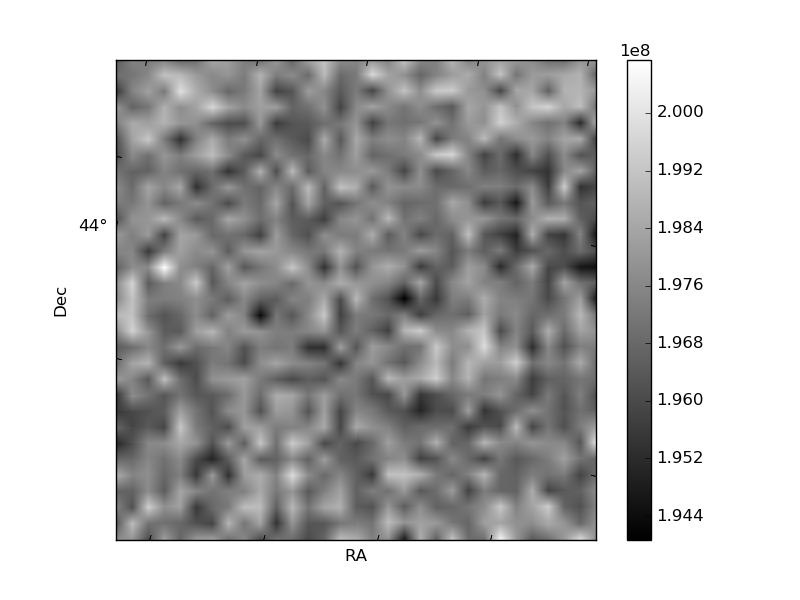
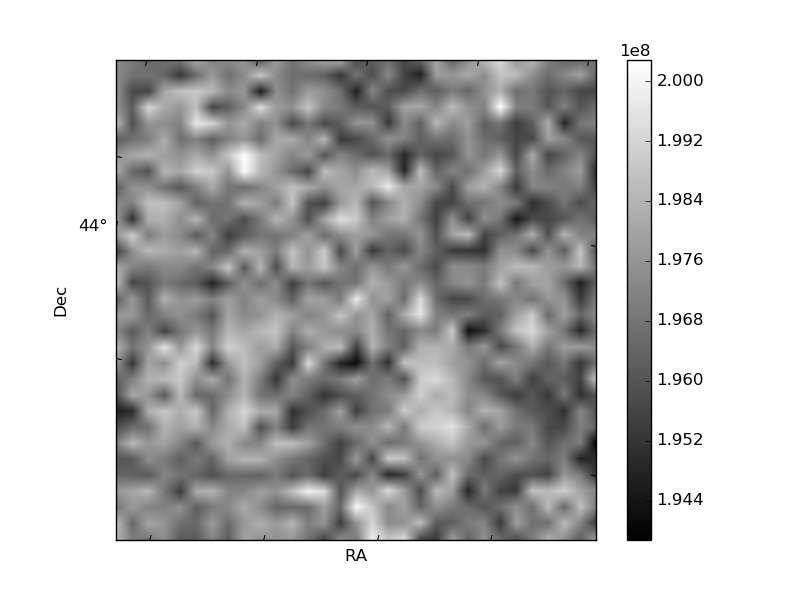
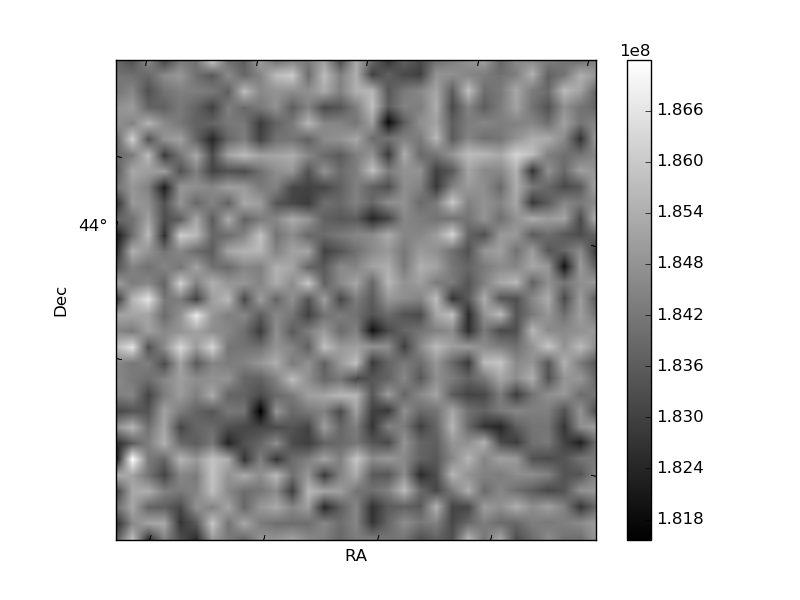
Histogram calculated using DETX and DETY for each event in the final _common_clean file
| Quadrant A | 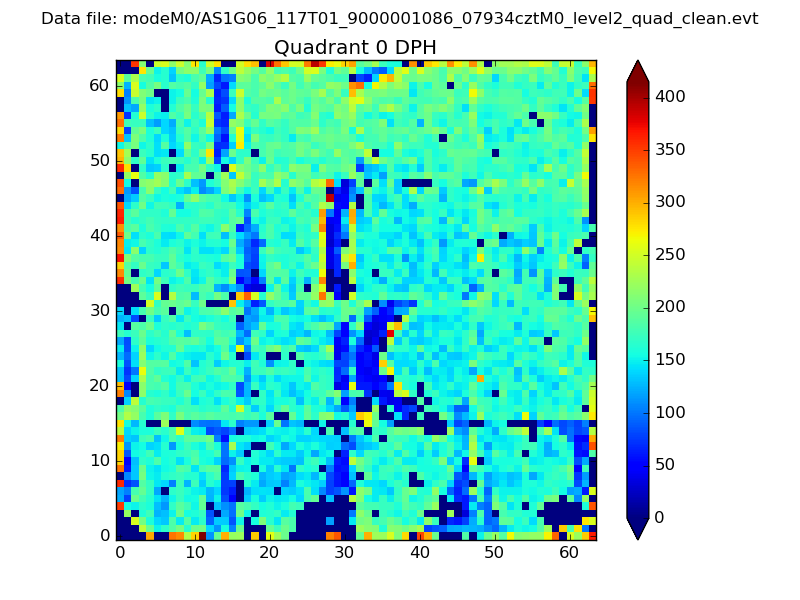 |
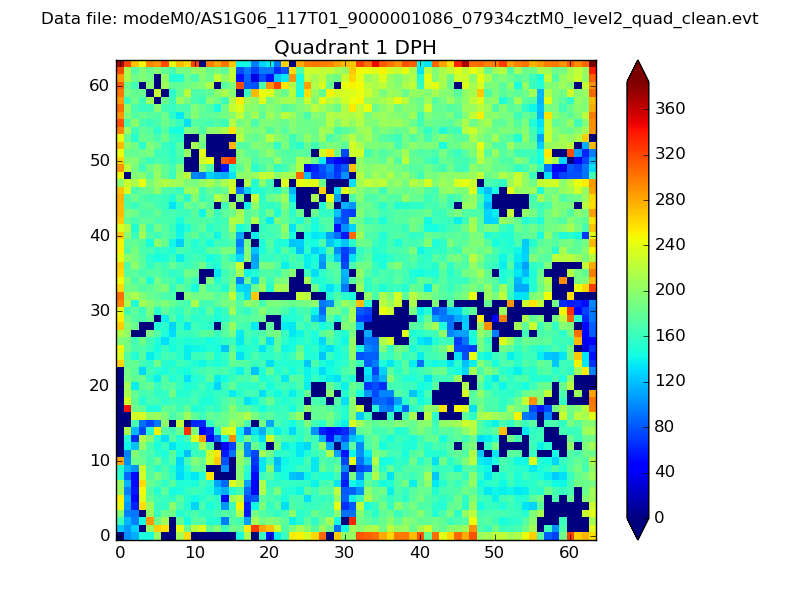 |
Quadrant B |
|---|---|---|---|
| Quadrant D | 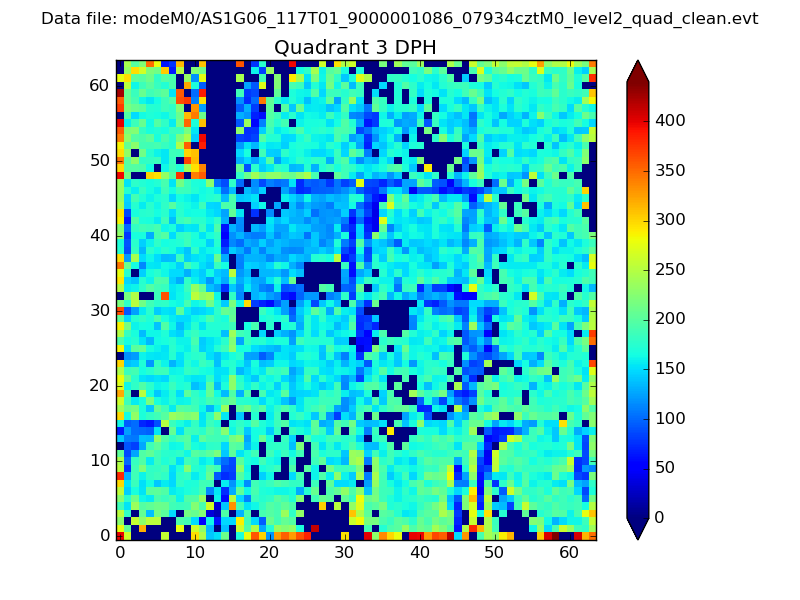 |
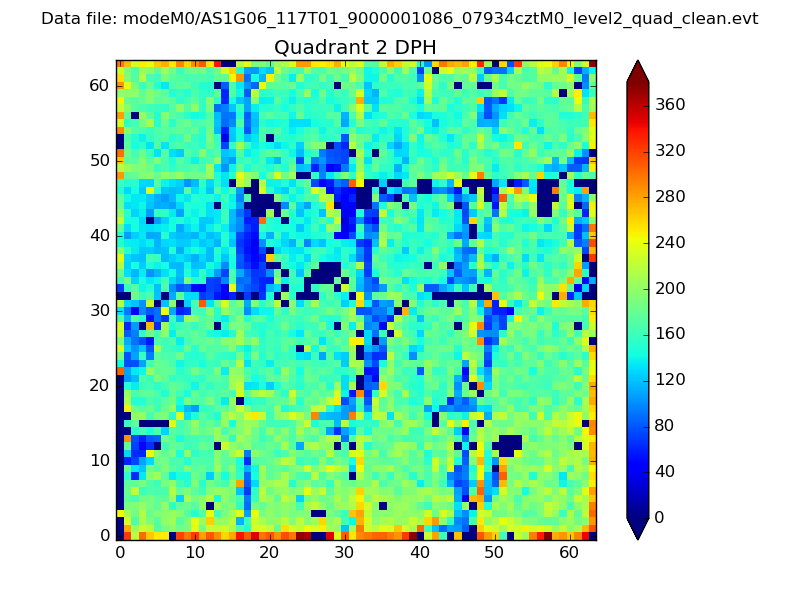 |
Quadrant C |
| Plot type | Count rate plots | Images |
|---|---|---|
| Comparison with Poisson distribution Blue bars denote a histogram of data divided into 1 sec bins. Red curve is a Poisson curve with rate = median count rate of data. |
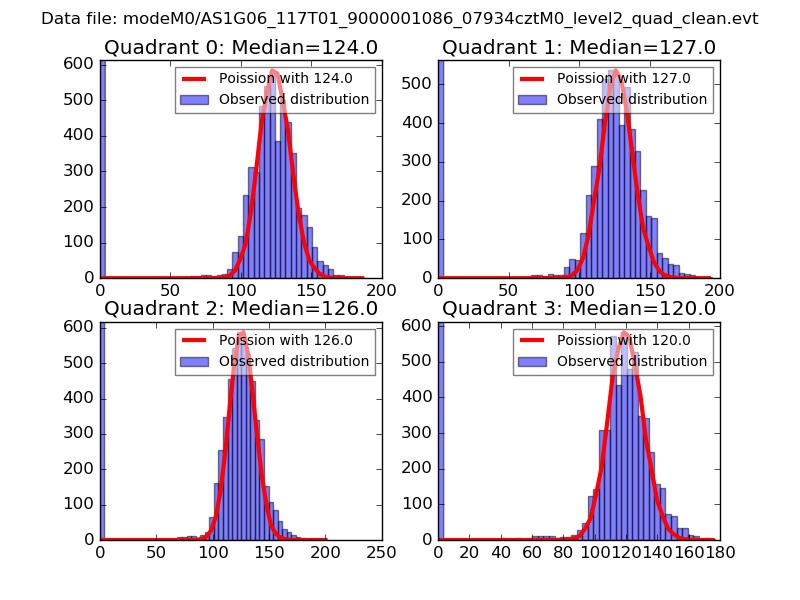 |
 |
| Quadrant-wise count rates Data is divided into 100 sec bins |
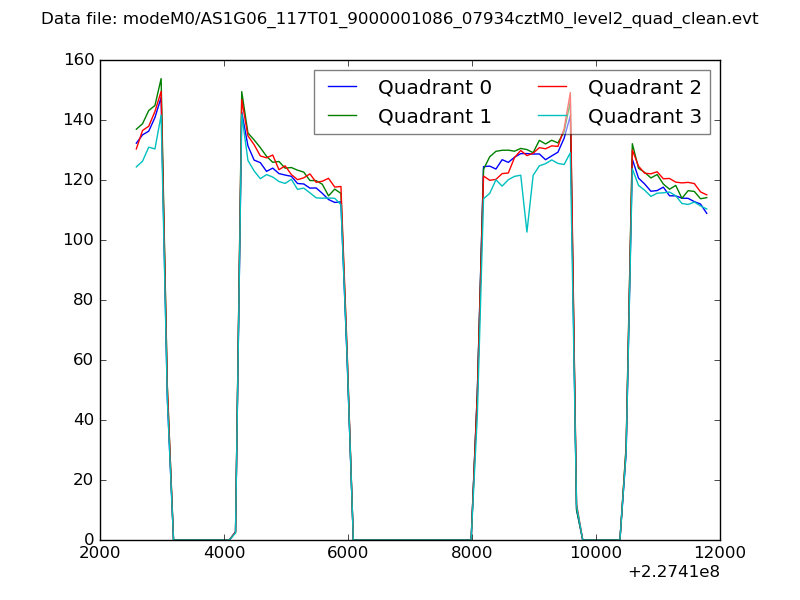 |
|
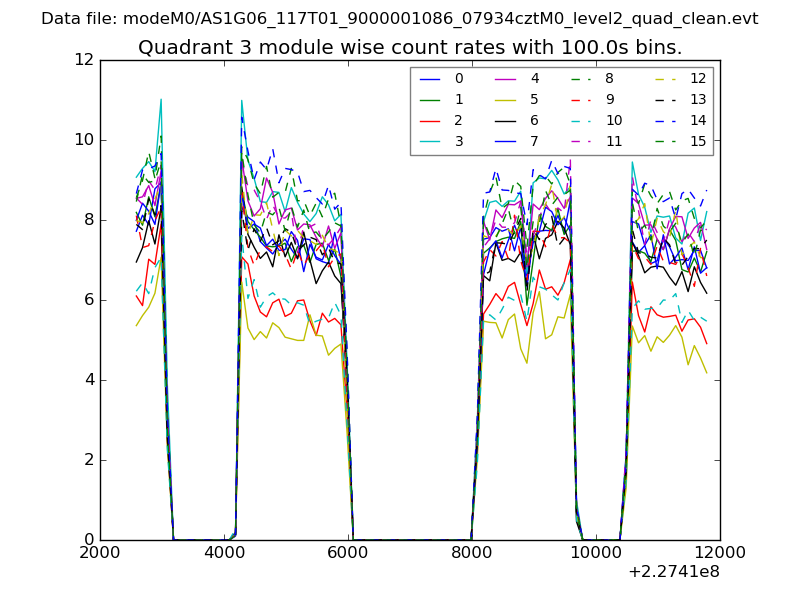
| Module-wise count rates for Quadrant A Data is divided into 100 sec bins |
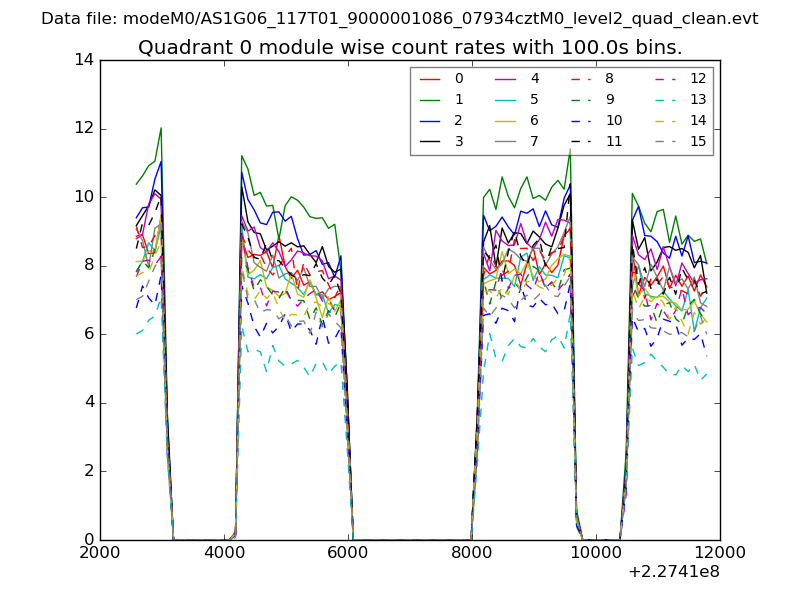 |
 |
| Module-wise count rates for Quadrant B Data is divided into 100 sec bins |
 |
 |
| Module-wise count rates for Quadrant C Data is divided into 100 sec bins |
 |
 |
| Module-wise count rates for Quadrant D Data is divided into 100 sec bins |
 |
 |
| Parameter | Plot |
|---|---|
| CZT HV Monitor |  |
| D_VDD | 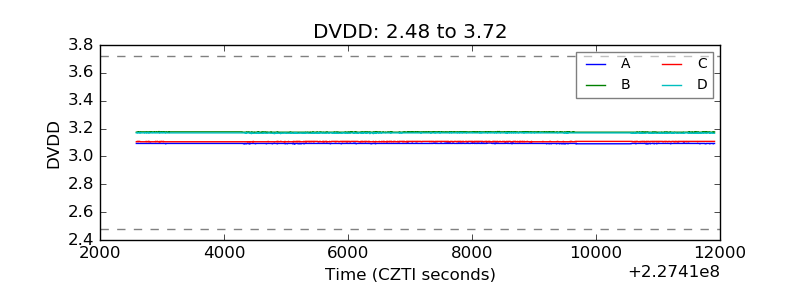 |
| Temperature 1 | 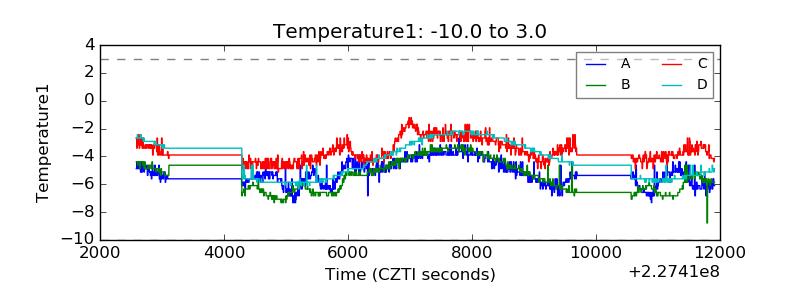 |
| Veto HV Monitor | 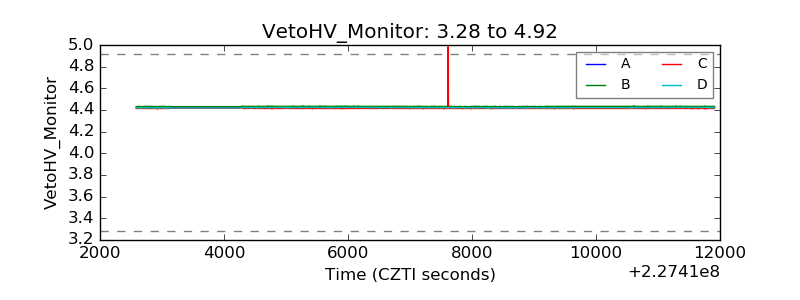 |
| Veto LLD | 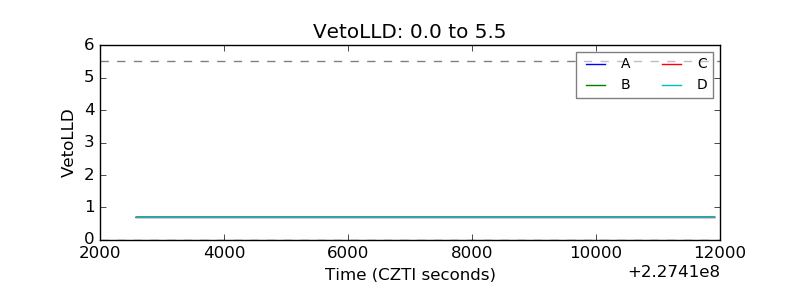 |
| Alpha Counter | 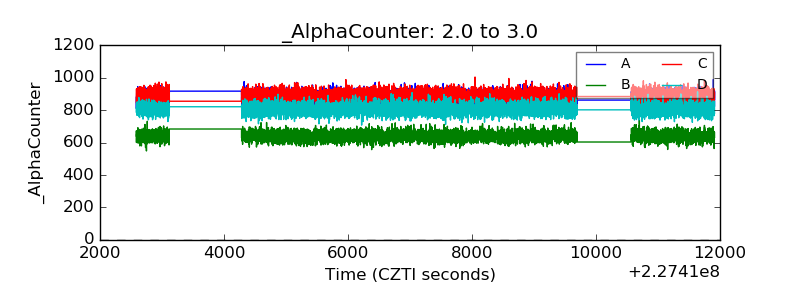 |
| _CPM_Rate | 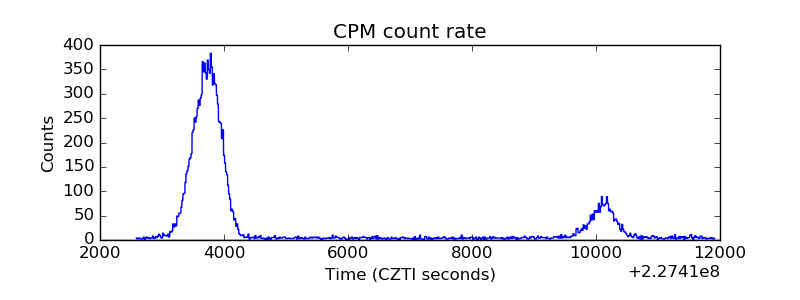 |
| CZT Counter | 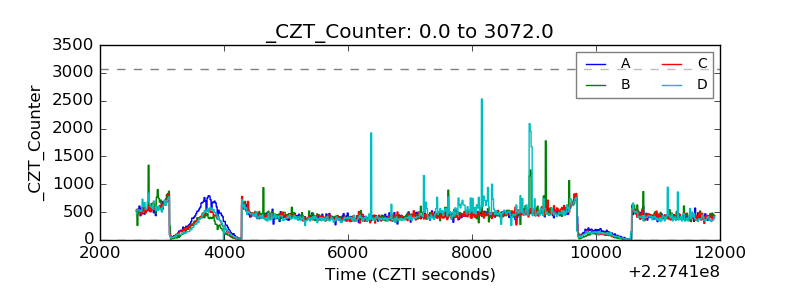 |
| +2.5 Volts monitor |  |
| +5 Volts monitor |  |
| _ROLL_ROT | 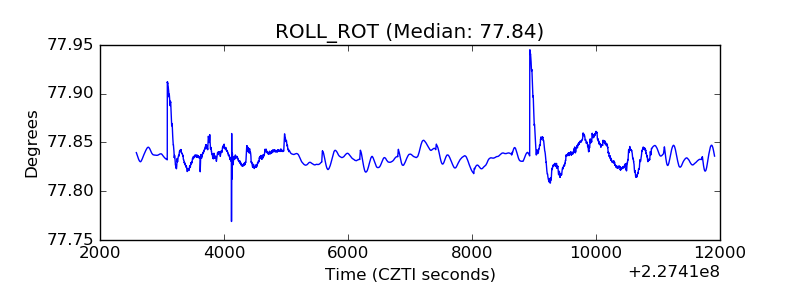 |
| _Roll_DEC | 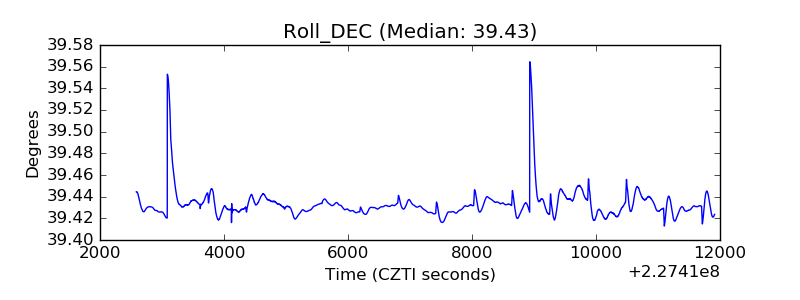 |
| _Roll_RA | 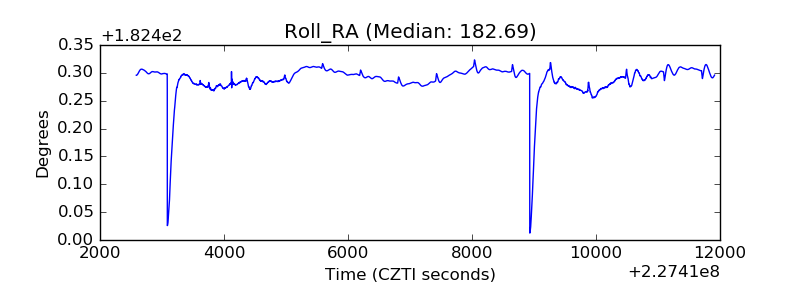 |
| Veto Counter | 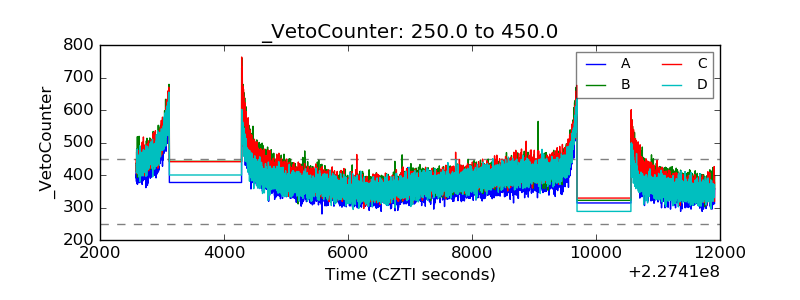 |