| Param | Original file | Final file |
|---|---|---|
| Filename | modeM0/AS1G06_117T01_9000001086_07935cztM0_level2.evt | modeM0/AS1G06_117T01_9000001086_07935cztM0_level2_quad_clean.evt |
| Size (bytes) | 462,248,640 | 92,160,000 |
| Size | 440.8 MB | 87.9 MB |
| Events in quadrant A | 3,368,201 | 566,078 |
| Events in quadrant B | 3,500,255 | 580,388 |
| Events in quadrant C | 3,254,417 | 579,771 |
| Events in quadrant D | 3,376,465 | 553,042 |
| Mode M9 | |||
|---|---|---|---|
| Quadrant | BADHDUFLAG | Total packets | Discarded packets |
| A | 0 | 7 | 0 |
| B | 0 | 7 | 0 |
| C | 0 | 7 | 0 |
| D | 0 | 8 | 0 |
| Mode SS | |||
|---|---|---|---|
| Quadrant | BADHDUFLAG | Total packets | Discarded packets |
| A | 0 | 150 | 0 |
| B | 0 | 150 | 0 |
| C | 0 | 150 | 0 |
| D | 0 | 150 | 0 |
| Mode M0 | |||
|---|---|---|---|
| Quadrant | BADHDUFLAG | Total packets | Discarded packets |
| A | 0 | 15199 | 3 |
| B | 0 | 15437 | 2 |
| C | 0 | 14969 | 4 |
| D | 0 | 15472 | 2 |
| Quadrant | Total seconds | Saturated seconds | Saturation percentage |
|---|---|---|---|
| A | 7347 | 105 | 1.429155% |
| B | 7347 | 132 | 1.796652% |
| C | 7346 | 59 | 0.803158% |
| D | 7347 | 64 | 0.871104% |
Noise dominated data is calculated using 1-second bins in cleaned event files. If a bin has >2000 counts, and if more than 50% of those come from <1% of pixels, then it is considered to be noise-dominated and hence unusable.
| Quadrant | # 1 sec bins | Bins with >0 counts | Bins with >2000 counts | High rate bins dominated by noise | Noise dominated (total time) | Noise dominated (detector-on time) | Marked lightcurve |
|---|---|---|---|---|---|---|---|
| A | 7692 | 7348 | 3 | 3 | 0.04% | 0.04% |  |
| B | 7692 | 7348 | 12 | 12 | 0.16% | 0.16% |  |
| C | 7692 | 7348 | 0 | 0 | 0.00% | 0.00% |  |
| D | 7692 | 7348 | 2 | 2 | 0.03% | 0.03% | 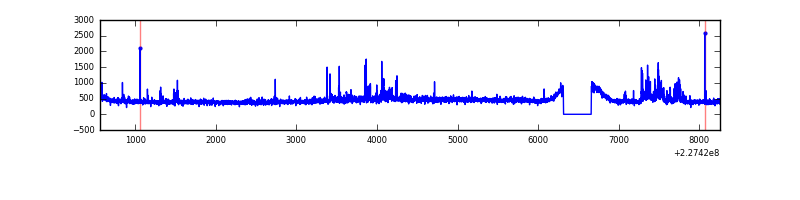 |
Top three noisy pixels from each quadrant. If the there are fewer than three noisy pixels in the level2.evt file, extra rows are filled as -1
| Pixel properties | Quadrant properties | ||||||
|---|---|---|---|---|---|---|---|
| Quadrant | DetID | PixID | Counts | Sigma | Mean | Median | Sigma |
| A | 0 | 128 | 80437 | 459.68 | 846 | 827 | 173.2 |
| A | 13 | 251 | 29294 | 164.37 | 846 | 827 | 173.2 |
| A | 0 | 226 | 7974 | 41.27 | 846 | 827 | 173.2 |
| B | 4 | 173 | 75112 | 450.74 | 856 | 835 | 164.8 |
| B | 11 | 51 | 37101 | 220.07 | 856 | 835 | 164.8 |
| B | 12 | 111 | 18486 | 107.11 | 856 | 835 | 164.8 |
| C | 13 | 61 | 6550 | 29.62 | 829 | 831 | 193.1 |
| C | 8 | 128 | 6159 | 27.6 | 829 | 831 | 193.1 |
| C | 1 | 16 | 4178 | 17.34 | 829 | 831 | 193.1 |
| D | 14 | 34 | 111504 | 548.31 | 822 | 795 | 201.9 |
| D | 5 | 233 | 97495 | 478.92 | 822 | 795 | 201.9 |
| D | 1 | 52 | 23681 | 113.35 | 822 | 795 | 201.9 |
Histogram calculated using DETX and DETY for each event in the final _common_clean file
| Quadrant A |  |
 |
Quadrant B |
|---|---|---|---|
| Quadrant D |  |
 |
Quadrant C |
| Plot type | Count rate plots | Images |
|---|---|---|
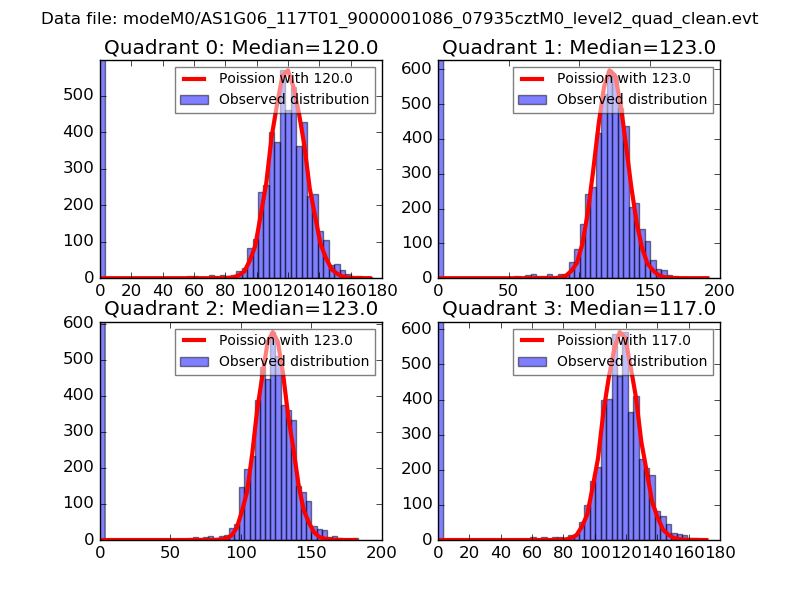
| Comparison with Poisson distribution Blue bars denote a histogram of data divided into 1 sec bins. Red curve is a Poisson curve with rate = median count rate of data. |
 |
 |
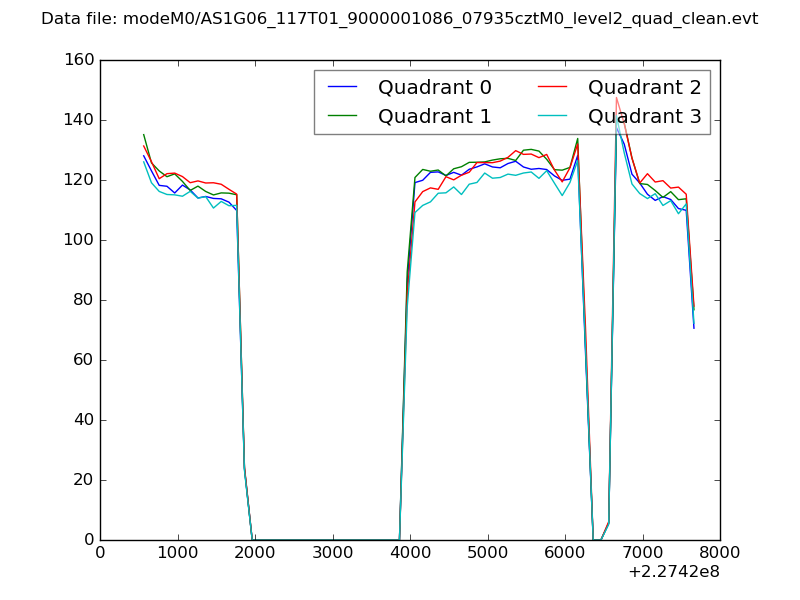
| Quadrant-wise count rates Data is divided into 100 sec bins |
 |
|
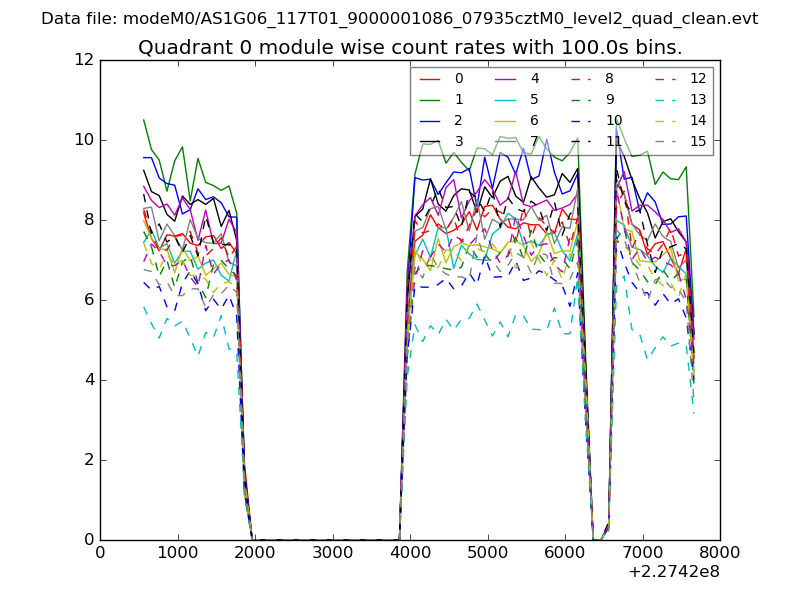
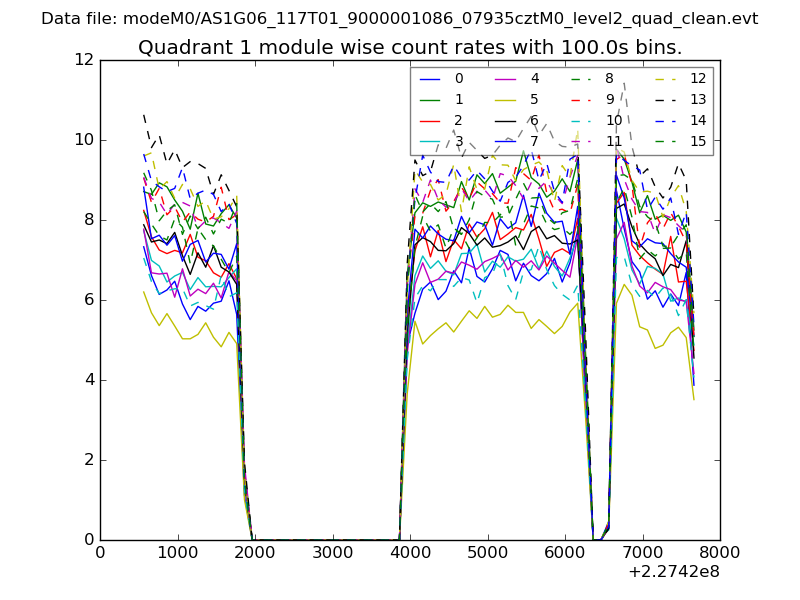
| Module-wise count rates for Quadrant A Data is divided into 100 sec bins |
 |
 |
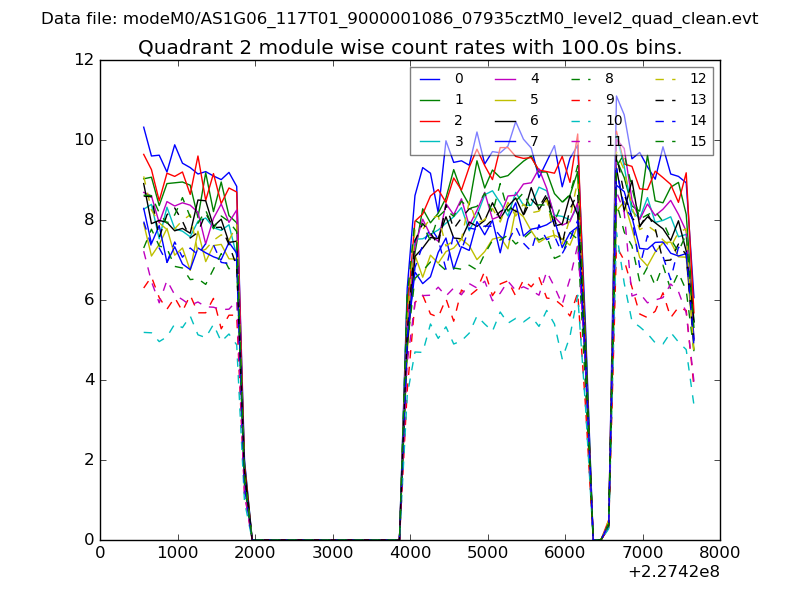
| Module-wise count rates for Quadrant B Data is divided into 100 sec bins |
 |
 |
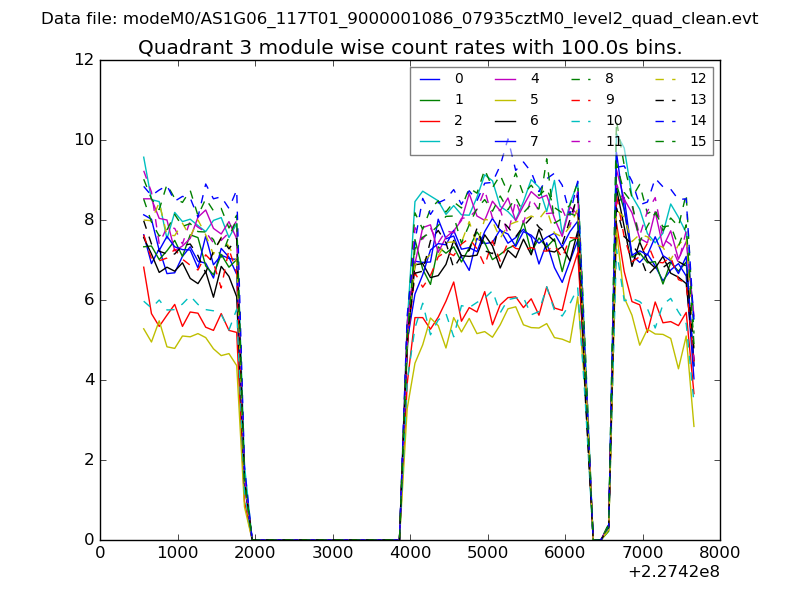
| Module-wise count rates for Quadrant C Data is divided into 100 sec bins |
 |
 |
| Module-wise count rates for Quadrant D Data is divided into 100 sec bins |
 |
 |
| Parameter | Plot |
|---|---|
| CZT HV Monitor | 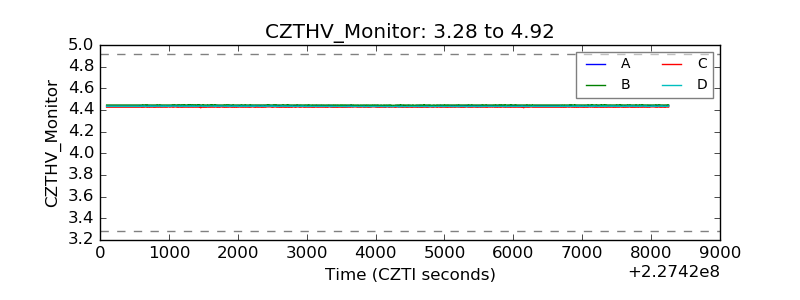 |
| D_VDD |  |
| Temperature 1 |  |
| Veto HV Monitor |  |
| Veto LLD |  |
| Alpha Counter | 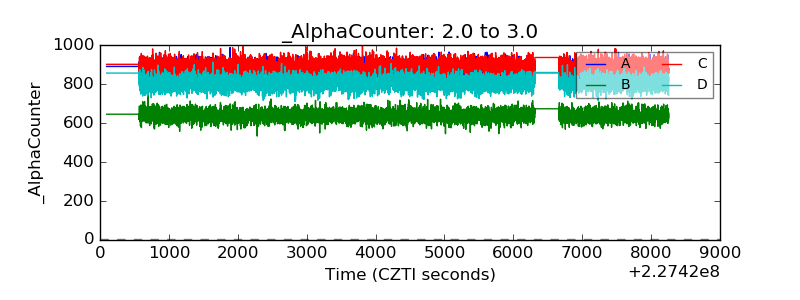 |
| _CPM_Rate | 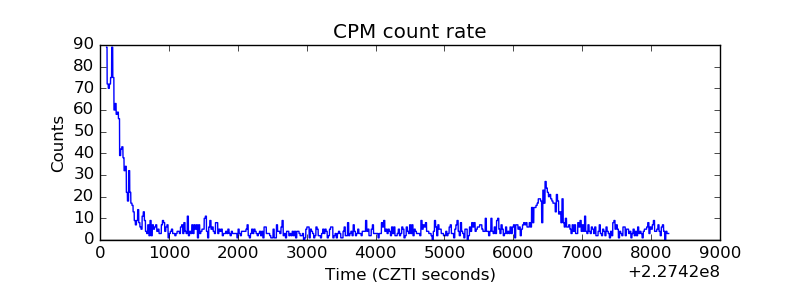 |
| CZT Counter |  |
| +2.5 Volts monitor |  |
| +5 Volts monitor |  |
| _ROLL_ROT | 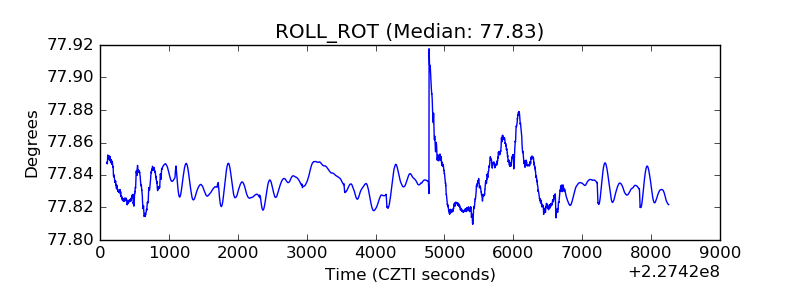 |
| _Roll_DEC |  |
| _Roll_RA |  |
| Veto Counter | 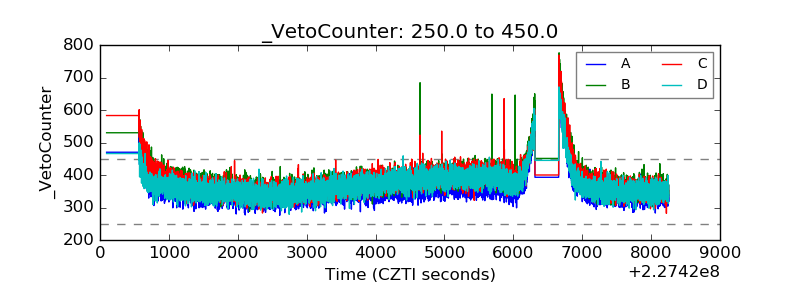 |