| Param | Original file | Final file |
|---|---|---|
| Filename | modeM0/AS1G06_117T01_9000001086_07940cztM0_level2.evt | modeM0/AS1G06_117T01_9000001086_07940cztM0_level2_quad_clean.evt |
| Size (bytes) | 1,283,103,360 | 226,512,000 |
| Size | 1.2 GB | 216.0 MB |
| Events in quadrant A | 8,562,691 | 1,399,544 |
| Events in quadrant B | 8,923,243 | 1,421,665 |
| Events in quadrant C | 8,365,032 | 1,414,966 |
| Events in quadrant D | 11,745,970 | 1,338,618 |
| Mode M9 | |||
|---|---|---|---|
| Quadrant | BADHDUFLAG | Total packets | Discarded packets |
| A | 0 | 22 | 0 |
| B | 0 | 22 | 0 |
| C | 0 | 22 | 0 |
| D | 0 | 22 | 0 |
| Mode SS | |||
|---|---|---|---|
| Quadrant | BADHDUFLAG | Total packets | Discarded packets |
| A | 0 | 386 | 0 |
| B | 0 | 386 | 0 |
| C | 0 | 386 | 0 |
| D | 0 | 386 | 0 |
| Mode M0 | |||
|---|---|---|---|
| Quadrant | BADHDUFLAG | Total packets | Discarded packets |
| A | 0 | 38432 | 78 |
| B | 0 | 39069 | 97 |
| C | 0 | 38181 | 75 |
| D | 0 | 47809 | 102 |
| Quadrant | Total seconds | Saturated seconds | Saturation percentage |
|---|---|---|---|
| A | 18652 | 358 | 1.919365% |
| B | 18644 | 399 | 2.140099% |
| C | 18652 | 279 | 1.495818% |
| D | 18652 | 707 | 3.790478% |
Noise dominated data is calculated using 1-second bins in cleaned event files. If a bin has >2000 counts, and if more than 50% of those come from <1% of pixels, then it is considered to be noise-dominated and hence unusable.
| Quadrant | # 1 sec bins | Bins with >0 counts | Bins with >2000 counts | High rate bins dominated by noise | Noise dominated (total time) | Noise dominated (detector-on time) | Marked lightcurve |
|---|---|---|---|---|---|---|---|
| A | 20843 | 18693 | 2 | 2 | 0.01% | 0.01% | 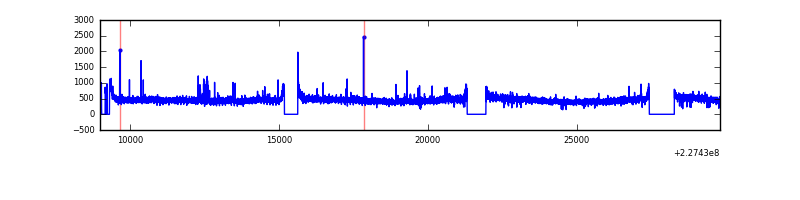 |
| B | 20843 | 18692 | 23 | 23 | 0.11% | 0.12% | 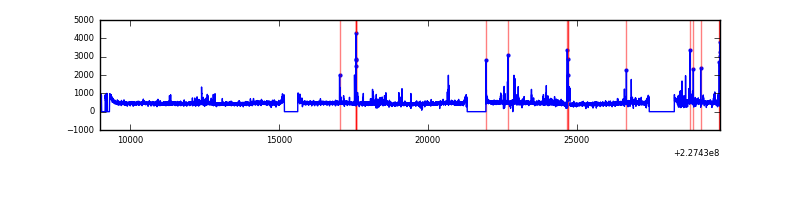 |
| C | 20843 | 18692 | 0 | 0 | 0.00% | 0.00% | 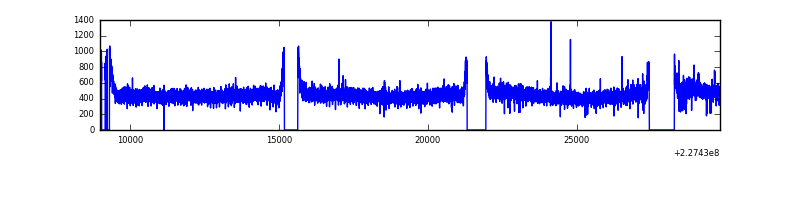 |
| D | 20843 | 18693 | 388 | 388 | 1.86% | 2.08% | 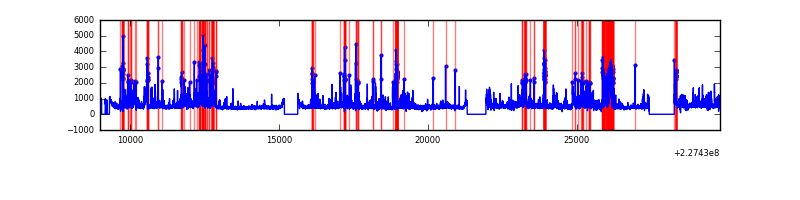 |
Top three noisy pixels from each quadrant. If the there are fewer than three noisy pixels in the level2.evt file, extra rows are filled as -1
| Pixel properties | Quadrant properties | ||||||
|---|---|---|---|---|---|---|---|
| Quadrant | DetID | PixID | Counts | Sigma | Mean | Median | Sigma |
| A | 0 | 128 | 83553 | 185.38 | 2176 | 2126 | 439.2 |
| A | 15 | 234 | 47993 | 104.42 | 2176 | 2126 | 439.2 |
| A | 0 | 226 | 20144 | 41.02 | 2176 | 2126 | 439.2 |
| B | 10 | 16 | 125053 | 293.14 | 2190 | 2139 | 419.3 |
| B | 11 | 51 | 124266 | 291.27 | 2190 | 2139 | 419.3 |
| B | 10 | 245 | 74347 | 172.21 | 2190 | 2139 | 419.3 |
| C | 1 | 16 | 41082 | 78.78 | 2130 | 2135 | 494.4 |
| C | 13 | 61 | 16249 | 28.55 | 2130 | 2135 | 494.4 |
| C | 9 | 236 | 8636 | 13.15 | 2130 | 2135 | 494.4 |
| D | 1 | 52 | 2812241 | 5420.92 | 2108 | 2039 | 518.4 |
| D | 5 | 233 | 442429 | 849.52 | 2108 | 2039 | 518.4 |
| D | 2 | 152 | 364894 | 699.95 | 2108 | 2039 | 518.4 |
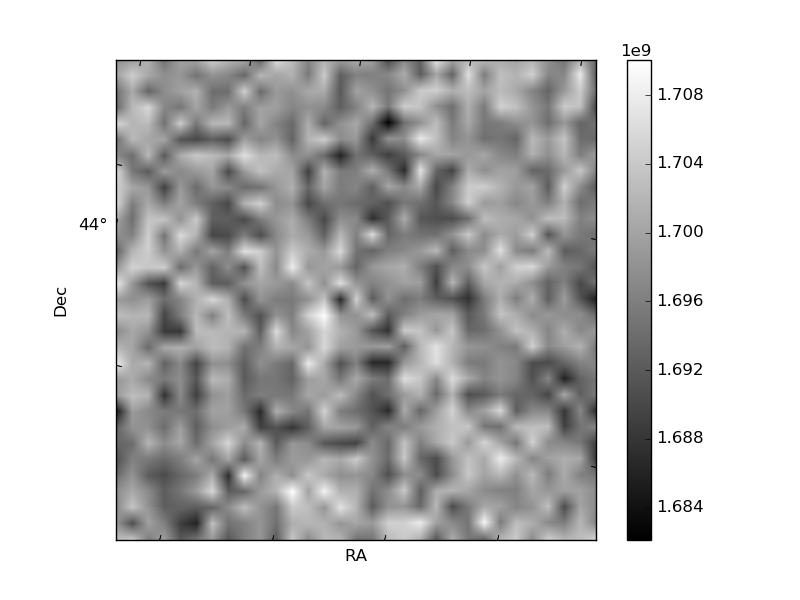
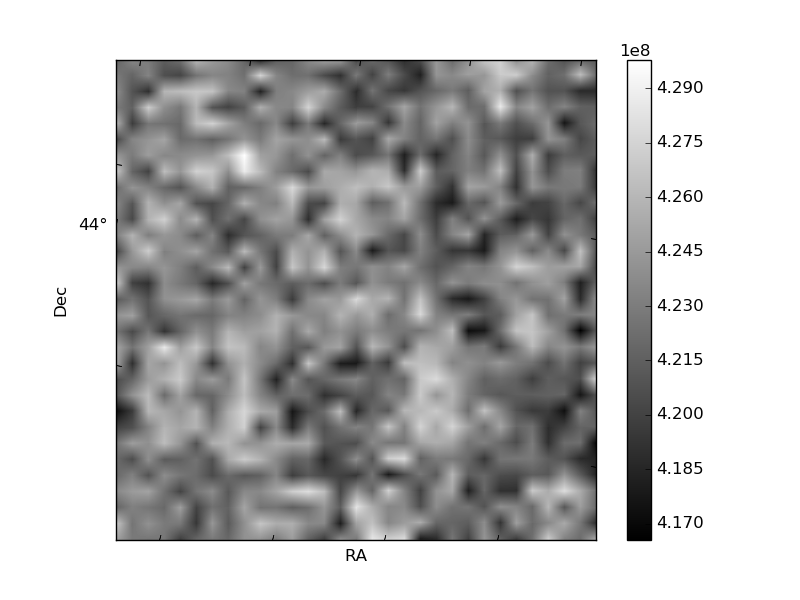
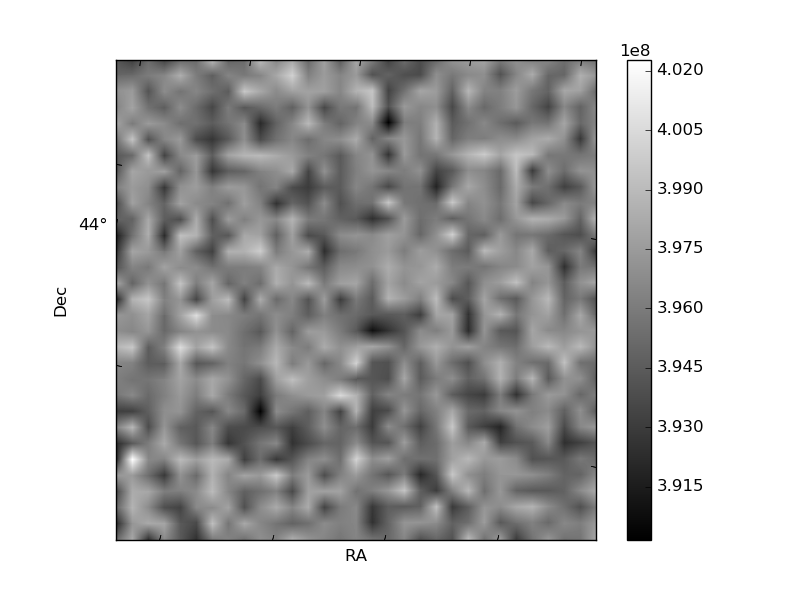
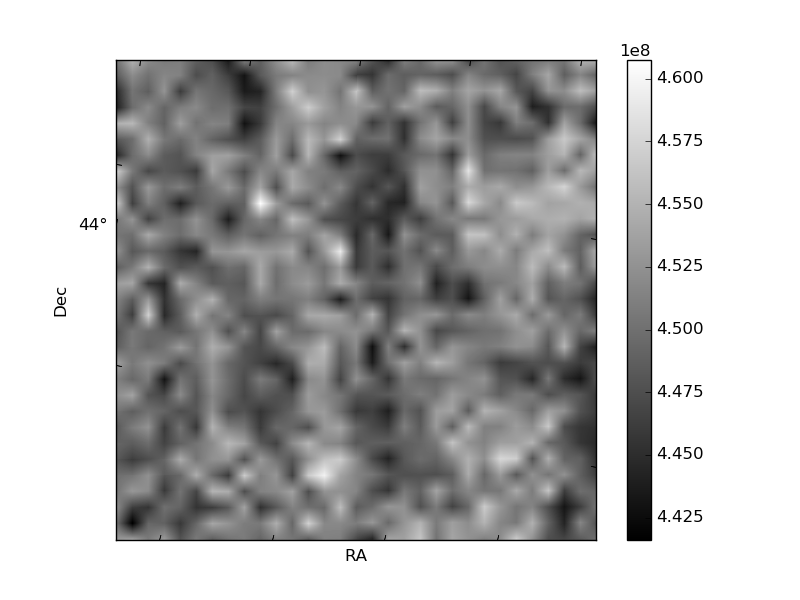
Histogram calculated using DETX and DETY for each event in the final _common_clean file
| Quadrant A | 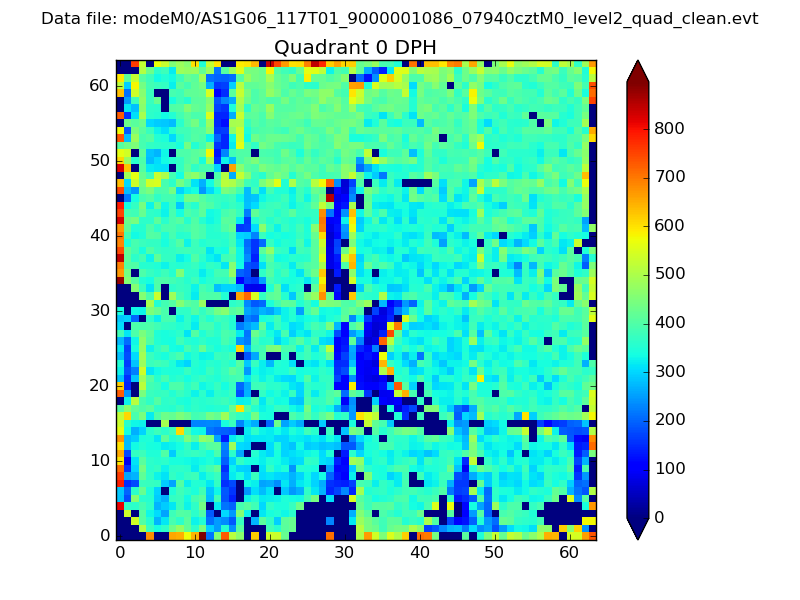 |
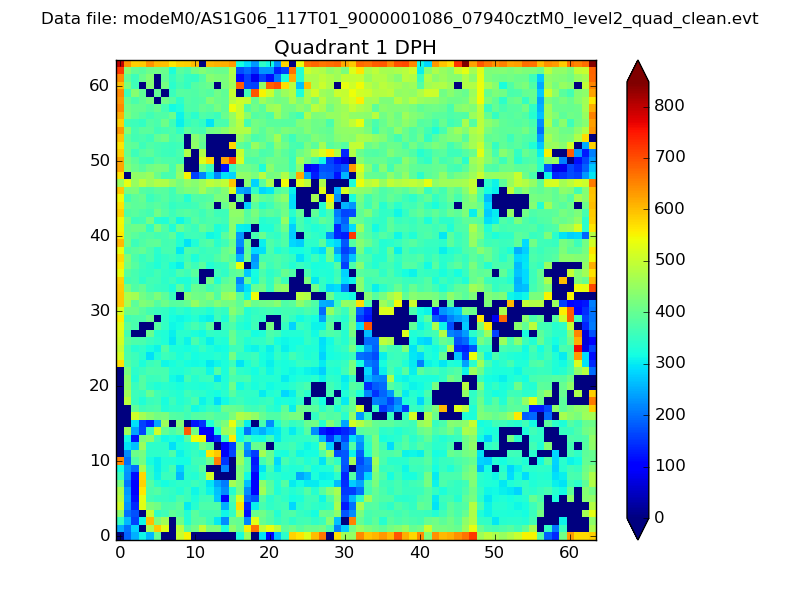 |
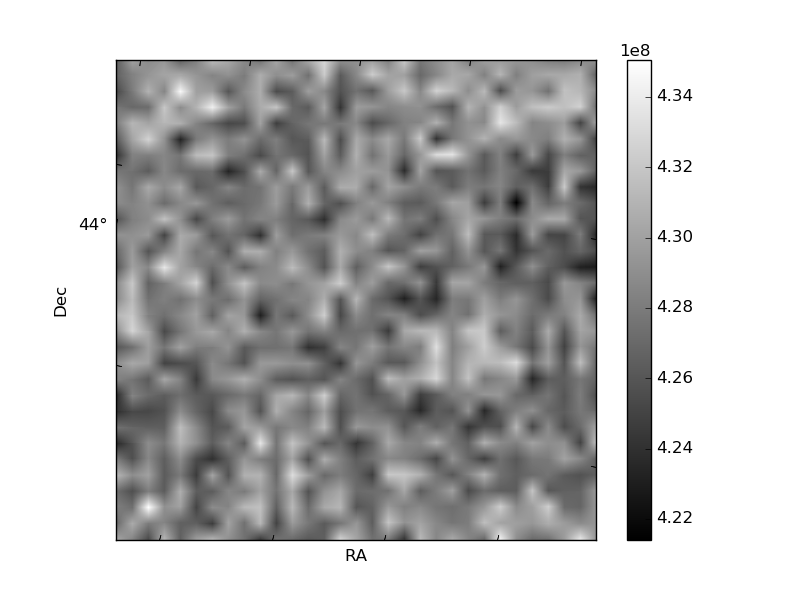
Quadrant B |
|---|---|---|---|
| Quadrant D | 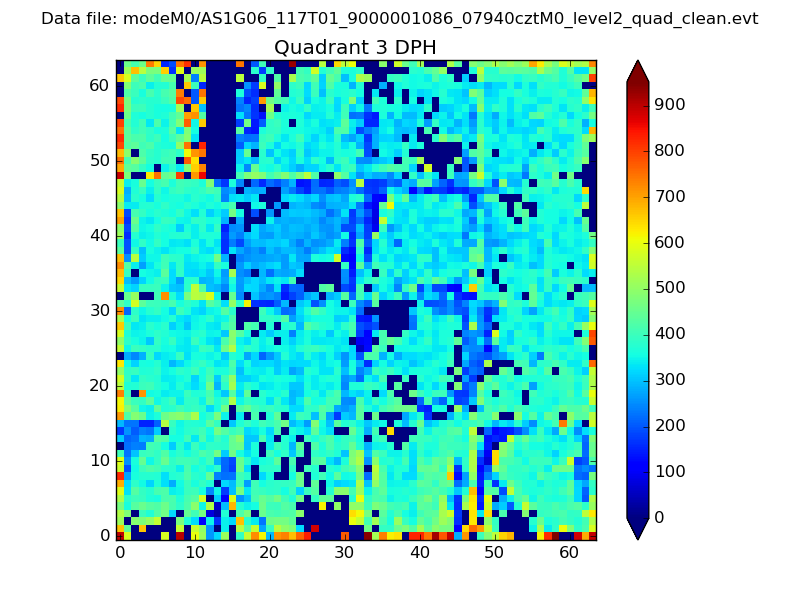 |
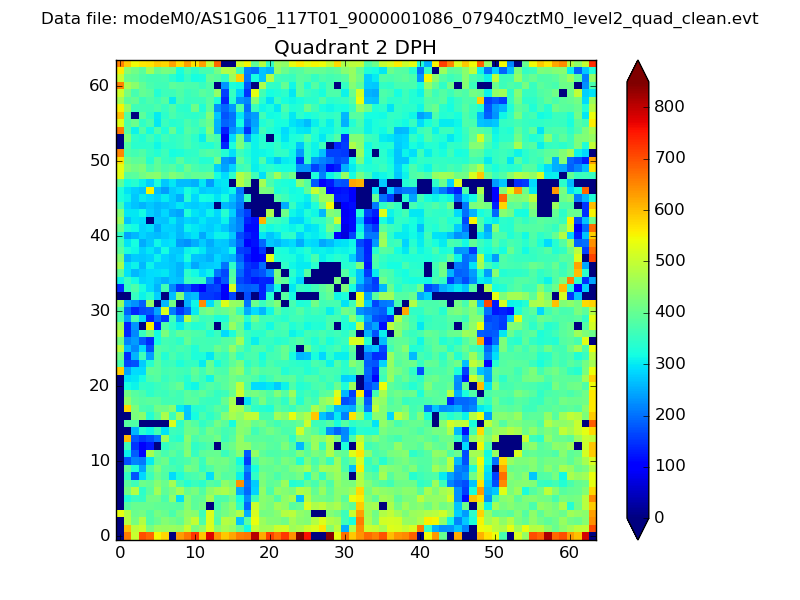 |
Quadrant C |
| Plot type | Count rate plots | Images |
|---|---|---|
| Comparison with Poisson distribution Blue bars denote a histogram of data divided into 1 sec bins. Red curve is a Poisson curve with rate = median count rate of data. |
 |
 |
| Quadrant-wise count rates Data is divided into 100 sec bins |
 |
|
| Module-wise count rates for Quadrant A Data is divided into 100 sec bins |
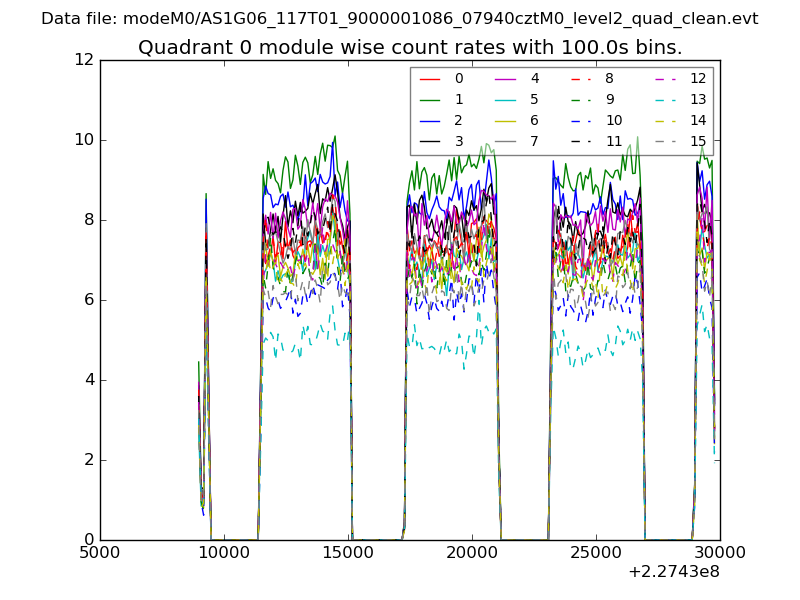 |
 |
| Module-wise count rates for Quadrant B Data is divided into 100 sec bins |
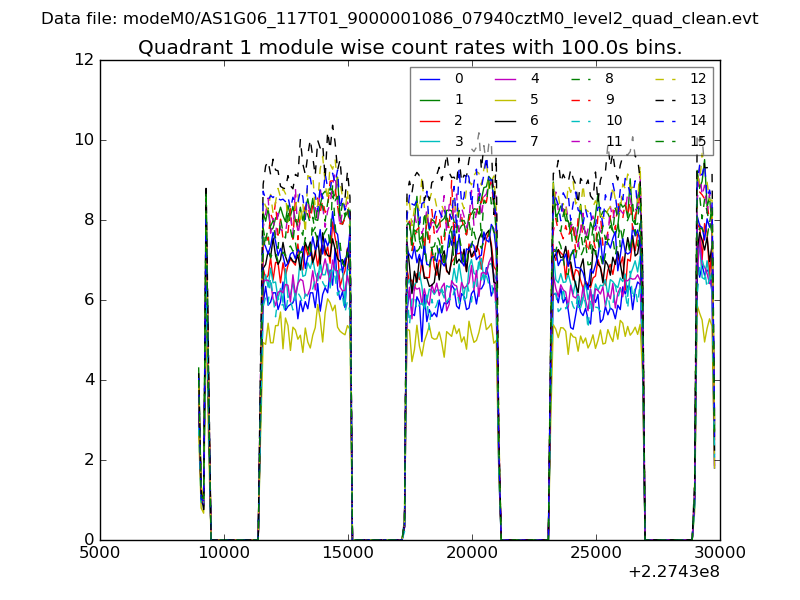 |
 |
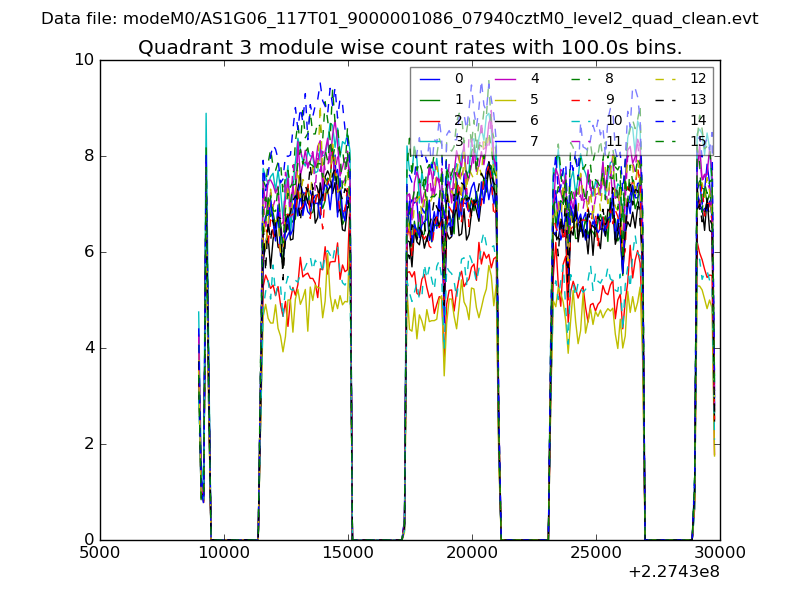
| Module-wise count rates for Quadrant C Data is divided into 100 sec bins |
 |
 |
| Module-wise count rates for Quadrant D Data is divided into 100 sec bins |
 |
 |
| Parameter | Plot |
|---|---|
| CZT HV Monitor |  |
| D_VDD | 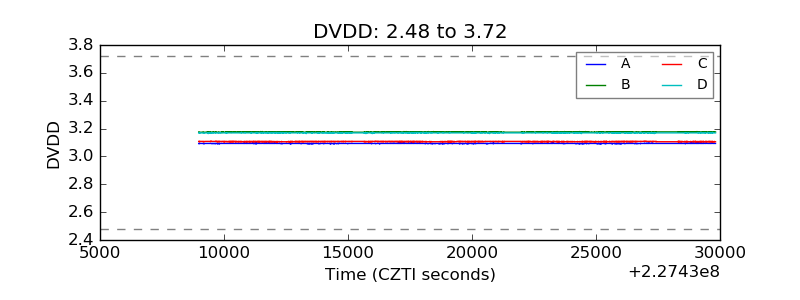 |
| Temperature 1 | 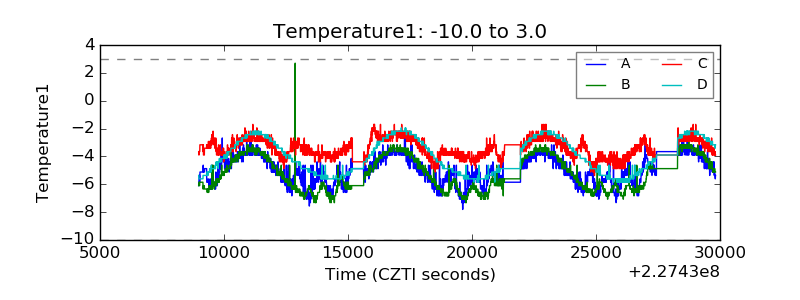 |
| Veto HV Monitor | 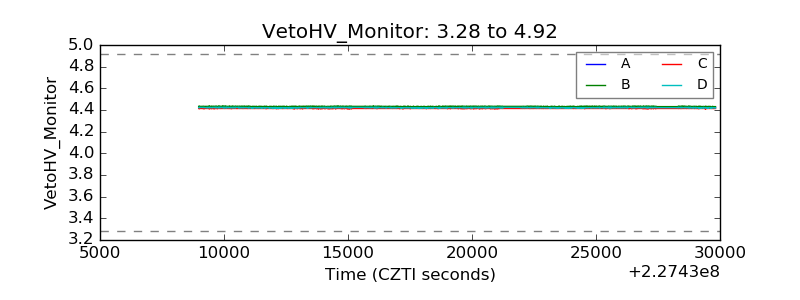 |
| Veto LLD | 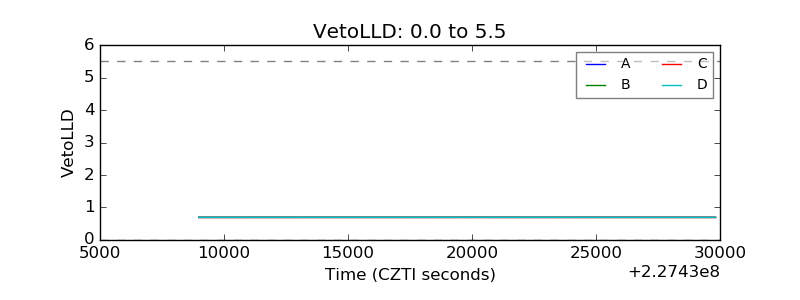 |
| Alpha Counter |  |
| _CPM_Rate | 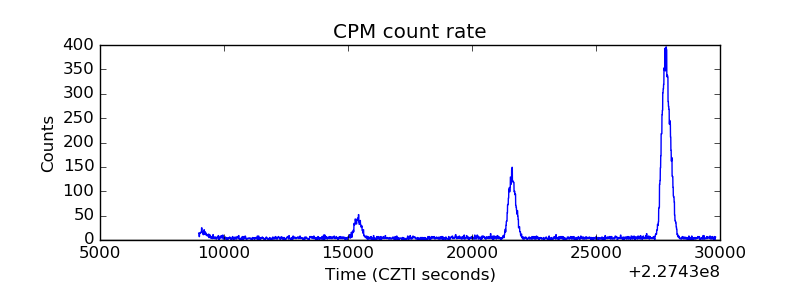 |
| CZT Counter | 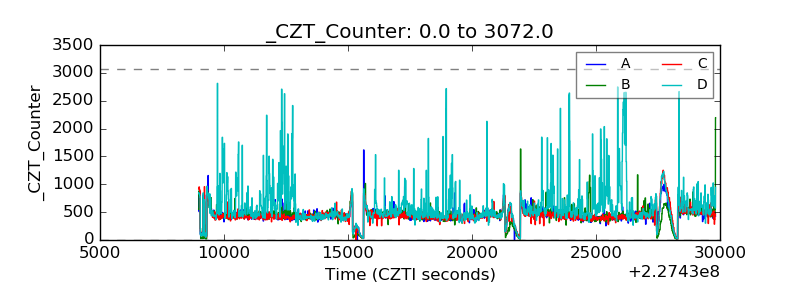 |
| +2.5 Volts monitor |  |
| +5 Volts monitor |  |
| _ROLL_ROT | 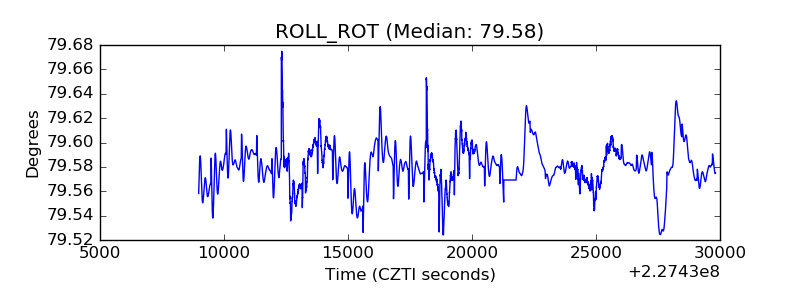 |
| _Roll_DEC | 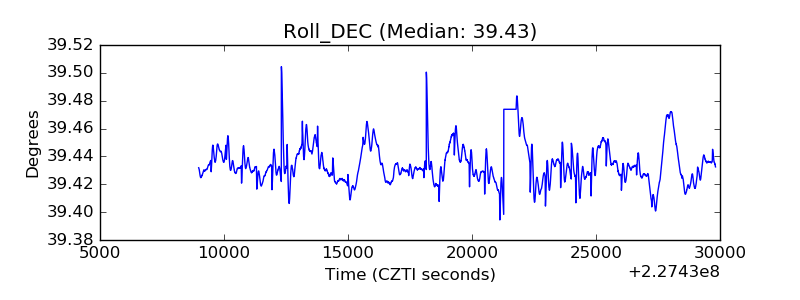 |
| _Roll_RA | 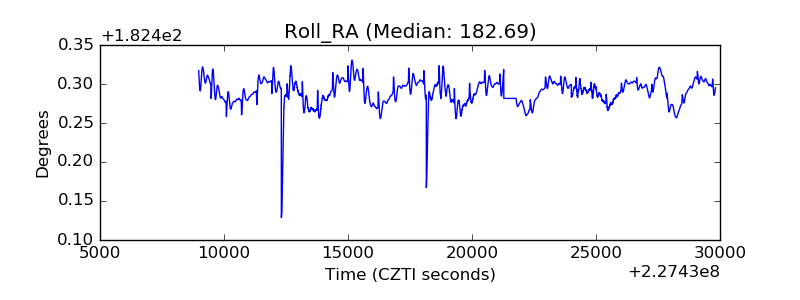 |
| Veto Counter | 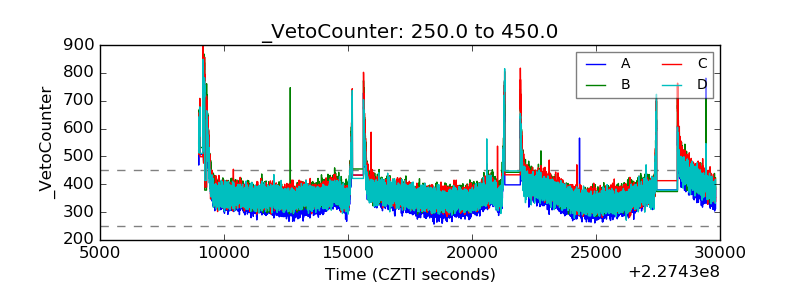 |